
Abstract
A rapid visual damage assessment of buildings around four strong-motion seismic stations in Kathmandu Valley was carried out after the damaging Gorkha, Nepal earthquake (Mw7.8) of 25 April 2015. The waveforms of the main shock recorded at these stations were compared with the damage to buildings around the stations. The damage was found to be related to strong-motion characteristics of the earthquake. A dominance of long-period oscillation could be observed in the records. The damage to low-rise buildings in the valley was less than anticipated from an earthquake of this magnitude given that the majority of buildings were built without proper engineering consideration. The acceleration response spectra of one of the sedimentary sites show high response in the 1–2 s period range, and nearly 10% of the buildings, which were all low-rise, suffered damage around this site.
Introduction
The subduction of Indian plate under the Eurasian plate at a rate of 36–50 mm (Feldl and Bilham 2006, Patriat and Achache 1984) is not continuous, but interrupted by asperities causing a large amount of stress to accumulate. The accumulated stress is released periodically in the form of small and large earthquakes as well as aseismic slip (Bilham 1995), where the stress is released by slow earthquakes and creep rather than mega earthquakes, thus rendering the Himalayan arc seismically active. With a number of small earthquakes and occasional large earthquakes, this region is one of the most seismically vulnerable regions of the world. Nepal, covering about 900 km of the Himalayan arc (known as the Nepal Himalaya), has suffered a number of interplate and intraplate earthquakes in the past. There are more than 20 accounts of damaging earthquakes occurring in or near the Nepal Himalaya since the thirteenth century (Dixit et al. 2013), including 1833 (Mw7.7), 1934 Nepal-Bihar (Mw8.2), 1980 Bajura, and 1988 Udayapur earthquakes that have left trails of damage.
The devastating Gorkha earthquake of 25 April 2015 is the latest in the list of devastating earthquakes in Nepal. With an epicenter in Barpak of the Gorkha district, 80 km northwest of the capital Kathmandu (Figure 1), this shallow (8.2-km) earthquake affected central Nepal and parts of the neighboring countries. The main shock (Mw7.8) and subsequent aftershocks of the Gorkha earthquake have claimed over 8,000 lives around the country. About 12% (73,624) of buildings were reported as completely damaged in the Kathmandu Valley (Government of Nepal 2015) as a result of the main shock and the largest aftershock of May 12 (Mw7.3), which occurred about 80 km east of Kathmandu on the eastern extreme of the rupture zone.
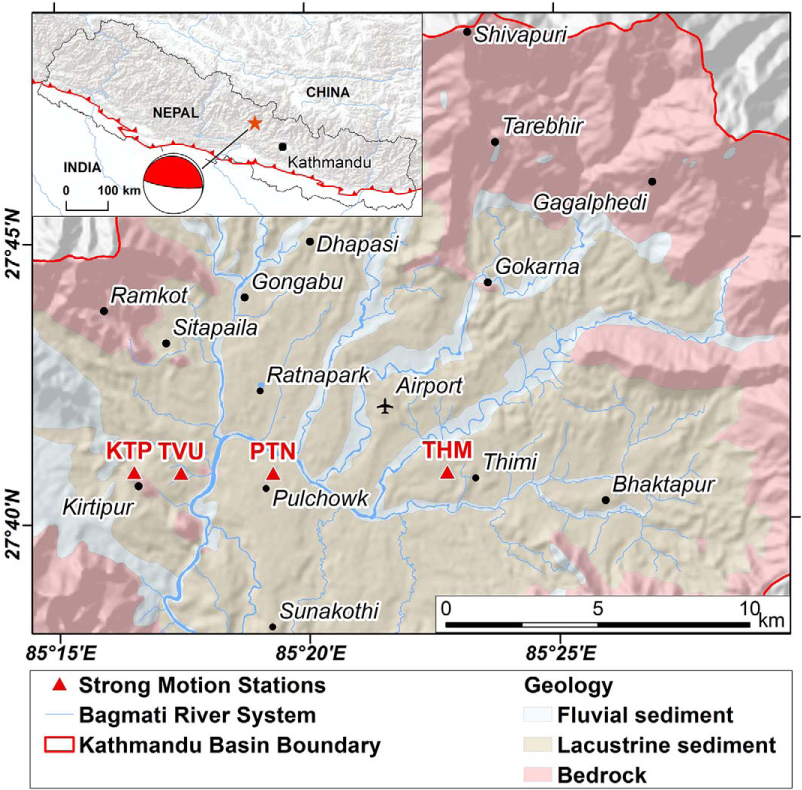
Location of strong-motion accelerometers in Kathmandu Valley. Geology based on the Engineering and Environment Geological Map of DMG, (Shrestha et al. 1998). Note the position of KTP on the rock site. Inset: Epicentre of Gorkha earthquake and its focal mechanism. The red line is the extension of MFT (Lave and Avouac 2000) as exposed on the surface.
Geological Setting of Kathmandu
The crustal shortening and active orogeny of the Himalaya, brought about by the collision, has formed a series of east-west trending regional thrusts running along its entire length, termed as Main Central Thrust (MCT), Main Boundary Thrust (MBT), and Main Frontal Thrust (MFT) from north to south (Gansser 1964, Le Fort 1975, Nakata 1989, Yeats et al. 1992). Among them, the MFT (Figure 1) is the only present active thrust (Avouac 2003), accommodating the movement of the Indian plate. These thrusts come together and join the gently sloping decollement zone called the Main Himalayan Thrust (MHT) (Avouac 2003), delineating the plate boundary at depth. The hypocenter of the Gorkha earthquake lies in this decollement zone (Bilham 2015).
The crustal shortening along these regional thrusts have formed several tectonic valleys in the Himalaya, with the Kathmandu Valley being one of them. This intermontane basin is filled with fluvio-lacustrine deposit (Figure 1) whose depth is estimated to be more than 650 m at the central part (Moribayashi and Maruo 1980). In the Pleistocene, the uplift of mountain range south of Kathmandu was too rapid for the paleo-Bagmati River to drain its basin, which resulted in the formation of a lake (Dhital 2015) that eventually drained 10,000–11,000 years ago (Sakai 2001) into the present form of the Kathmandu Valley.
The basin-fill sediments of Kathmandu mainly consist of loose sand and gravel on the fringes and mostly silt and clay in the central part (Sakai 2001, Shrestha et al. 1998, Yoshida and Igarashi 1984). Nevertheless, the basement topography of Kathmandu is uneven (Moribayashi and Maruo 1980, Paudyal et al. 2013), and one can observe hillocks of bedrock that have breached the sediments to form rock exposures inside the valley at several places (Shrestha et al. 1998).
Background of the Present Study
The devastation patterns of past earthquakes in Kathmandu show that the site amplification in the basin is due to the loose sediments. Studies have revealed that the soft silty layers of the valley undergo deformation during the shaking (Mugnier et al. 2011). There have been reported cases of liquefaction in different parts of the valley during the Gorkha earthquake (Okamura et al. 2015).
Previous studies have indicated the probability of a large earthquake in the region of Nepal Himalaya. The region west of Gorkha has not experienced a major earthquake since 1505. The stress accumulation in the seismic gap (Avouac 2007) can trigger another large earthquake. A study based on slip potential due to accumulated stress pointed out the possibility of an earthquake with a magnitude of around 7.4 in the area where the Gorkha earthquake occurred (Bilham and Wallace 2005). The study also indicated that the probability of much larger earthquakes (∼M8.6) in western Nepal looms large.
The last two decades have seen a rapid increase in the population of Kathmandu Valley. As a result, the pace and process of building construction have also increased. In Nepal, the majority of buildings are constructed without following building codes and, though some local government bodies try to enforce the codes, many have difficulty regulating and inspecting whether engineering norms and existing building codes (JICA 2002, Dixit 2004) are being followed. The situation in the capital is not much different. A survey carried out weeks after the Gorkha earthquake reported that about 80% of buildings in Kathmandu were constructed without proper engineering consultation (Bohara 2015). The apparent increase in the initial cost of construction is one of the causes for not strictly following the building codes, as many house owners end up choosing money over safety.
The location in a seismically active region and wave amplification due to thick soft sediments add up to the seismic vulnerability of Kathmandu. Although strong-motion characteristic studies of the Kathmandu basin sediment are necessary to address the vulnerability, there were only a few detailed research studies before the Gorkha earthquake.
To analyze the strong-motion characteristics of the Kathmandu Valley in this background, four continuous recording accelerometers (Mitsutoyo JEP-6A3-2) were installed in the Kathmandu Valley (Figure 1) in 2011 as a collaborative study between Hokkaido University and Tribhuvan University. The station at KTP (Kirtipur) was installed above the rock site and TVU (Tribhuvan University), PTN (Patan), and THM (Sanothimi) were installed above the soft sediment of the Kathmandu Valley. The shear wave velocity around the station KTP was found to be ∼700 m/s, whereas, in the other three sites, it was about 200 m/s (Takai et al. 2015). We considered KTP as the reference site with little or no site effect to compare the response of the other three sites located above the valley sediment.
This strong-motion array recorded the main shock (Takai et al. 2016) and the ensuing aftershocks of the Gorkha earthquake (Ichiyanagi et al. 2016). To compare the records with the damage caused by the main shock around the stations, we carried out the rapid visual damage assessment around the seismic stations after a week of the main shock based on the method of the European Macroseismic Scale 1998 (Grunthal 1998). We processed the near-field seismic records of the main shock, calculated the acceleration response spectra, and compared them with the damage assessment results to ascertain the relationship between the strong ground motion of the earthquake and the structural damage around the four stations. There were two more seismometer stations in the valley: DMG and KATNP, installed by the Department of Mines and Geology and USGS, respectively. The data from DMG were not publicly available at that time, and most of the buildings around KATNP were inside the premises of the U.S. Embassy, making it difficult to include those sites for the study.
Strong-Motion Characteristics
When a large earthquake occurring on the regional thrust MFT (Figure 1, inset) produces a surface rupture, it is visible along the northern extreme of the foreland basin at the base of the Himalayan range. Previous studies have reported the surface rupture of the great 1934 Nepal–Bihar earthquake (Bollinger et al. 2014, Sapkota et al. 2013). Nevertheless, the rupture of the present Gorkha earthquake terminated about 50 km north of the MFT (Angster et al. 2015) without being exposed to the surface. The rupture propagated towards the east (Avouac et al. 2015, Fan and Shearer 2015, Yagi and Okuwaki 2015), triggering a number of subsequent aftershocks with multistage rupture (Denolle et al. 2015, Fan and Shearer 2015). It has been estimated that the rupture traveled east with a velocity of ∼2.9 km/s (Fan and Shearer 2015) and stopped about 90 km east of Kathmandu. During the rupture propagation, most of the energy—as well as the slip—were concentrated in the north of Kathmandu (Fan and Shearer 2015, Galetzka et al. 2015). The records in GPS stations inside Kathmandu show that the valley experienced a permanent tectonic displacement of 135 cm towards south-southwest (SSW) direction and a vertical uplift of 63 cm (Galetzka et al. 2015), which is very similar to the displacement records obtained in KTP (Takai et al. 2016).
The Gorkha earthquake, resulting from a shallow low angle thrust (Kobayashi et al. 2015), has some interesting features in the waveform. The highest PGA (241 cm/s2) was recorded at the rock site KTP. The velocity waveforms nevertheless show high PGV in the sediment site TVU (99 cm/s) (Takai et al. 2016). The values of PGA are less (Takai et al. 2016) than the value estimated by ground motion prediction equations (Si and Midorikawa 1999, Boore et al. 2014). The PGA of this earthquake is less than expected for a large earthquake of this magnitude.
Since this earthquake did not originate from a single point source and the location of the stations were inside the source area, the interpretation of phases becomes complicated as the waves reaching the stations come from various sections of the rupture.
The Fourier spectra (Figure 2) of the main shock show the dominance of long-period motion. This long-period motion might have caused the rocking motion reported by people during the earthquake (Martin et al. 2015). Though the horizontal component of sedimentary sites clearly indicates the presence of long-period waves when compared with that of the rock site, the vertical component do not vary much. The fundamental frequencies in the sedimentary sites vary between 0.2–0.4 Hz. There is pronounced deamplification of Fourier spectra in higher frequencies (< 2 Hz), which might be attributed to the nonlinearity of the valley sediments (Dhakal et al. 2016, Rajaure et al. 2017). The spectral ratio, or the ratio of spectral amplitude of the sediment sites to that of the rock site (Figure 2), shows significant amplification in 0.3–0.7 Hz in the horizontal component—more than 10 times in the case of TVU. We estimated the one-dimensional velocity model of the three sediment sites by forward modeling S-waves and found that the thickness of sediment with low shear wave velocity (<500 m/s) varies from 300–440 m (Bijukchhen et al. 2017) beneath the three sites. The high amplification is the result of wave propagation through these thick soft sediments. The amplification in the vertical component, on the other hand, is not as significant as in the horizontal components.
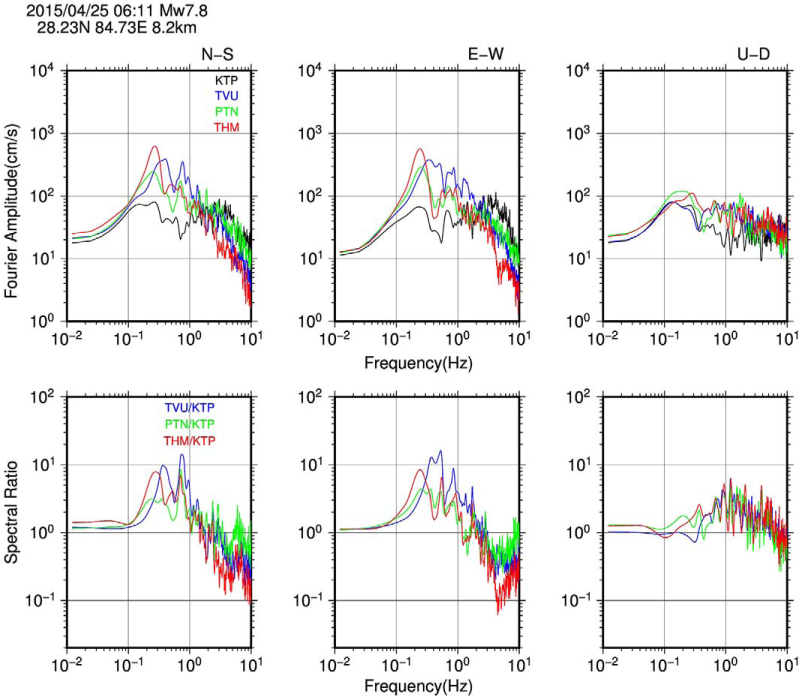
Acceleration Fourier amplitude spectra and spectral ratio. The spectral ratio is the ratio of spectral amplitude of the sediment sites to that of the rock site. Notice the prominent peaks in low frequencies. The spectra in the Up-Down (U-D) component in all sites are very similar to each other.
Practice of Building Construction in the Kathmandu Valley
As the construction practice of a building plays a huge role on their resistance to strong-motion, and thus to damage conditions, we will try to briefly introduce the practice of building construction prevalent in the Kathmandu Valley.
The Kathmandu Valley has a fair share of vernacular architectural structures. The old settlements of the valley have many old buildings and monuments built of bricks held together by mud mortar. Almost all of the buildings in the valley use bricks; newer buildings use cement as the mortar instead of mud mortar. Though the construction practice has changed a lot with time, bricks are still the predominant construction material. The abundance of clay in the valley due to the lacustrine sediments enabled early settlers to shape out bricks from the clay, and this holds true even today. The bricks were either sun-dried or fired in a kiln, depending on individual choice and the economic condition. The fired bricks needed more work and energy, making them expensive than the sun-dried bricks.
According to the practice of construction common in Kathmandu, the buildings can broadly be divided into two main categories.
Load-Bearing Masonry Structures
Load-bearing masonry structures are the most prevalent type of structure in the valley, but these are gradually being replaced by reinforced concrete (RC) infill frame structures. The traditional houses that reached 3–4 stories were built with load-bearing, thick, brick walls. In general, the walls are at least 45 cm thick at the ground story and decrease to about 30 cm at the third story (Pradhan 2000).
Traditionally, the façade is made up of three wythes or leaves of bricks, with fired-brick outer leaves and sun-dried inner leaves. Another common practice is to fill the gap between two leaves of bricks with rubble (Beckh 2006). Nonetheless, the use of fired bricks instead of sun-dried bricks can be found in buildings constructed later.
The bricks are mostly held together by mortar of clay or mud. Cement mortar has become a popular choice in recent years, but one can still find buildings with mud mortar. Another type of mortar termed “bajra”—made of a mixture of brick powder, sand, and slaked lime (Bonapace and Sestini 2003)—was also used in traditional palaces, public buildings, and monuments.
The floors of traditional buildings are typically made up of wooden joists placed perpendicular to the façade, covered with sleepers or planks joining them with adjacent joists. These joists rest on the outer walls, and side walls are held in place by the use of wooden pegs locally called “chuku.” These flexible pegs restrain joists from sliding off due to lateral motion (D'Ayala 2003), but they might not perform very well during strong shaking.
The masonry buildings have load-bearing walls of low tensile strength and, without adequate members to resist lateral forces, they get damaged by out-of-plane as well as in-plane failure of the walls. Though some traditional buildings with wooden frames can withstand smaller earthquakes, a major one like the Gorkha earthquake can be damaging. Aging of the mud mortar constructions results in rising dampness, efflorescence, loss of surface material, and loss of mortar (D'Ayala 2004), and increases the vulnerability of the structure. The walls with layers of sun-dried and fired bricks can delaminate resulting in complete collapse of the façade. In some buildings with fired brick and mud mortar, we observed that the mud mortar was not able to hold the bricks together after the earthquake.
Rc Infill Frame Structures
Construction of RC infill frame structures started after late 1970s (Chaulagain et al. 2013) in Nepal. The RC frame with unreinforced brick masonry infill has become the default construction technique for most buildings. These buildings, standing on isolated footings and reaching a height of typically 2–6 stories (6–18 m), are designed as bare frame structures where masonry infilling is added later. Taller buildings have also started to appear in the Kathmandu skyline recently. Moreover, the traditional masonry structures are gradually being replaced by RC infill frame structures.
Though, RC infill frame structures are better equipped than traditional load-bearing structures in enduring seismic movement, construction without proper engineering consultations have resulted in many buildings with questionable quality. One can see exposed RC columns and reinforcement bars on the top of many buildings, as owners wait for a suitable time to build additional story, ultimately resulting in rebar rusting. In some cases, the stories added to the existing buildings are not designed for this condition. The RC infill frame buildings found in Nepal are either designed according to the Mandatory Rules of Thumb (MRT) of the Nepal Building Code (NBC 1994), according to the Indian Building Code, or are either poorly designed without engineering supervision. A seismic vulnerability study carried out before the Gorkha earthquake concluded that the poorly designed RC infill frame buildings were highly vulnerable to earthquakes (Chaulagain et al. 2013).
Field Survey
The visual damage assessment around the stations helps to compare the direct relationship of strong-motion characteristics and the effect of earthquake. On 6 May 2015 and 7 May 2015, we carried out the rapid visual damage assessments of buildings in an area inscribed by 200-m radius from the seismic stations. A few buildings outside the 200-m radius were also considered at some of the sites. The comparison of damage status and strong-motion waves gives the relationship between site response and the situation of damage around the stations. Though this was the first damage assessment of buildings around earthquake stations in Nepal, similar studies were carried out after the 1994 Northridge earthquake, USA (Applied Technology Council 2000), 2011 Christchurch earthquake, New Zealand (Iizuka et al. 2011), and the 2014 South Napa earthquake, USA (Applied Technology Council 2015).
We used the method of damage assessment as defined by European Macroseismic Scale 1998 (EMS98) (Grunthal 1998). The extent of damage was evaluated separately for masonry and RC infill frame structures. Except for few single-storied buildings made of cement blocks, almost all of the buildings we checked used fired bricks on the outer façade, and cement mortar and masonry buildings with mud mortar were found only around KTP. A building near THM had steel columns along with RC columns. Hence for the present study, we classified the buildings into four categories: load-bearing masonry mud mortar, load-bearing masonry cement mortar, RC infill frame, and RC steel masonry. The buildings with lime mortar or “bajra” are placed in the load-bearing masonry cement mortar class, as the strength of this mortar is considered more than ordinary mud mortar (Bonapace and Sestini 2003).
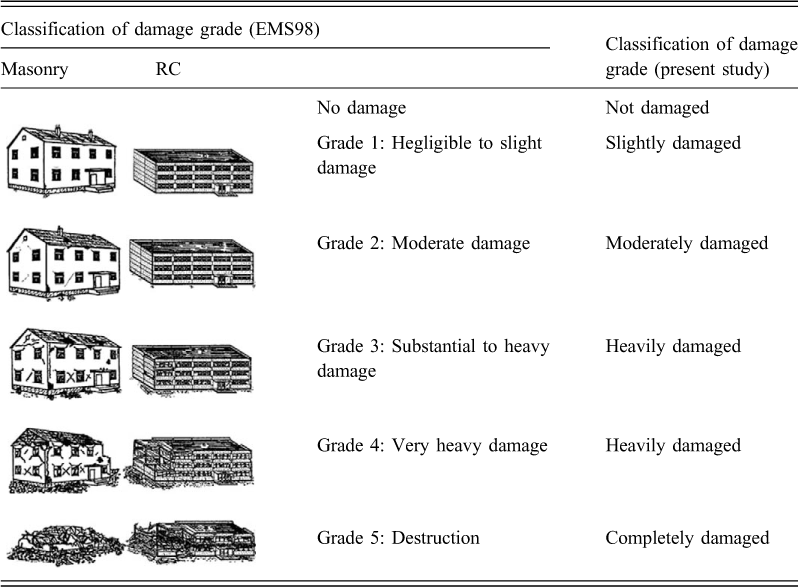
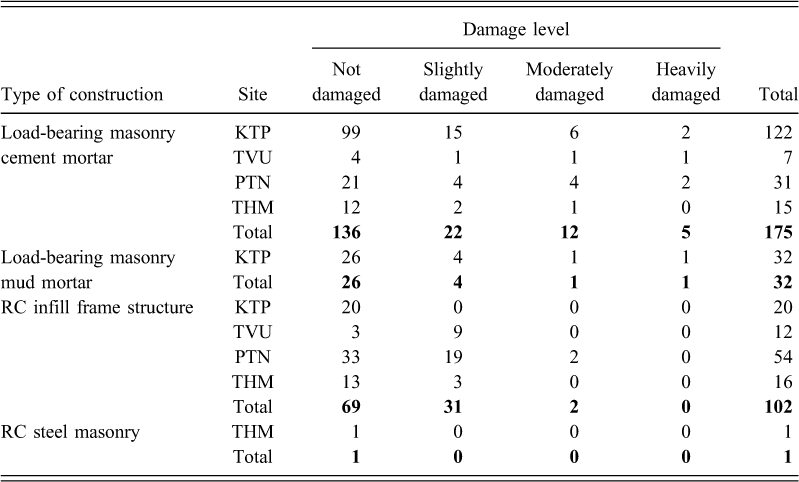
EMS98 classifies the damages in masonry and RC structures separately by dividing the damage extent into grades numbering from 1 to 5: grade 1 classified as “negligible to slight damage” and grade 5 classified as “destruction.” For the present study, though, we slightly modified the classification grades (Table 1). We differentiated them into four classes: not damaged, slightly damaged, moderately damaged, and heavily damaged. The “negligible to slight damage” (grade 1) and “moderate damage” (grade 2) classification of EMS98 were named as “slightly damaged” and “moderately damaged,” respectively. The “substantial to heavy damage” (grade 3) and “very heavy damage” (grade 4) classes were grouped as one: “heavily damaged.” The “destruction” (grade 5) classification was termed “completely damaged,” but we did not find instances of completely collapsed structures during the survey. The age of building, use, location, number of floors, and surrounding topography were also noted during the study.
Damage grades used for the present study based on EMS98 for load-bearing masonry and RC infill frame buildings
Ktp (Kirtipur Municipality)
The station KTP lies in Kirtipur, one of the oldest settlements in West Kathmandu Valley. It is installed on the ground floor of a four-story RC infill frame building of the Kirtipur Municipality Office. It is a residential area, and most of the buildings are built on a steep topography with walls touching adjacent buildings on both sides. Out of 174 buildings considered for the study, 18% were masonry structures with mud mortar (Figure 3a), of which ∼81% suffered no damage during the earthquake (Figure 3b).
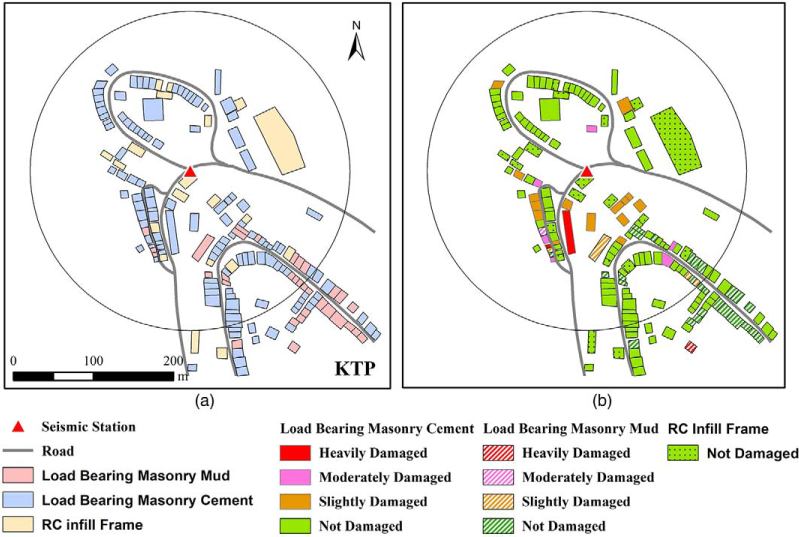
(a) Distribution of buildings according to construction type and (b) damage suffered during earthquake around seismic station KTP.
Though all RC infill frame buildings remained unscathed, one masonry mud mortar building was heavily damaged. The three-story building built on a steep topography suffered the collapse of the façade facing the slope (Figure 4a). Apart from this, instances of cracks in the inner walls (Figures 4b) were observed in a few masonry buildings. We also found fallen roof tiles from some of these houses, nevertheless, only less than 6% of total buildings suffered moderate to heavy damage during the earthquake.
(a) Heavily damaged building with a façade collapse and (b) cracks in wall inside of a slightly damaged building around KTP. The inset shows the diagram of corresponding damage grade (EMS 98).
Tvu (Tribhuvan University)
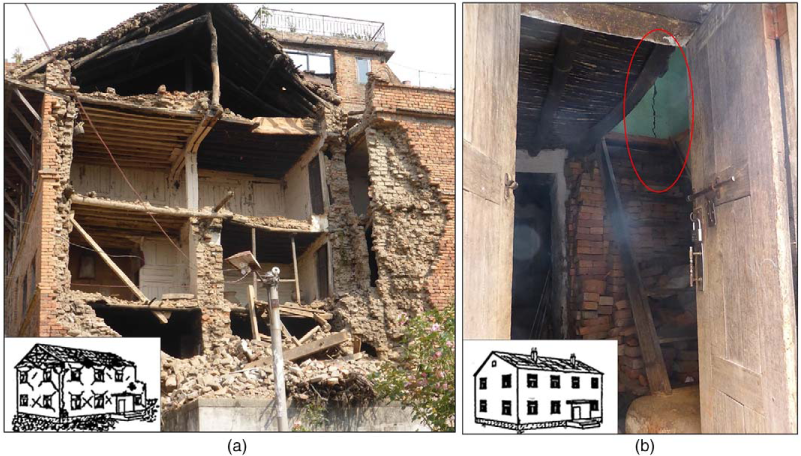
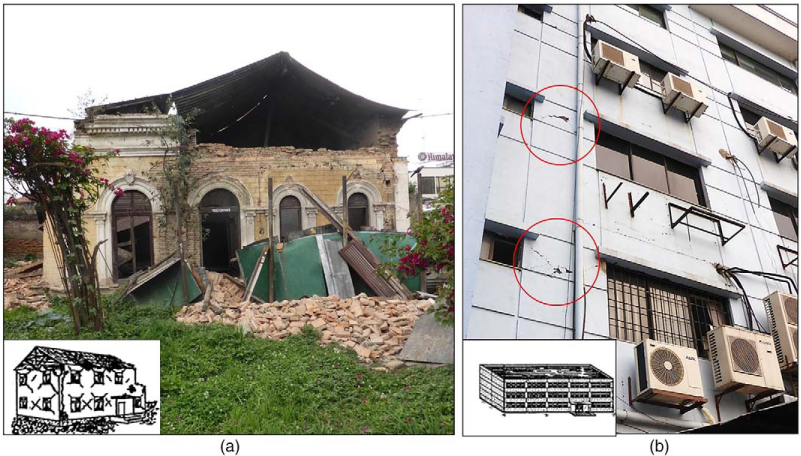
The station TVU is in the premises of the Tribhuvan University and is installed on the ground floor of a two-story RC infill frame building of the Central Department of Geology. There are only 19 buildings around it (Figures 5a), with none more than two stories tall. Statistically speaking, this site suffered the most damage (∼10%), with slight damage observed in RC buildings as well (Figures 5a). A single-story load-bearing masonry cement mortar building built in late 1960s was heavily damaged. The walls and ceiling of the building collapsed, making the building unsuitable for use (Figure 6a). Though most of the buildings around TVU are RC infill frame structures, slight damage—like broken window panes and slight cracks on the ground floor—was observed.
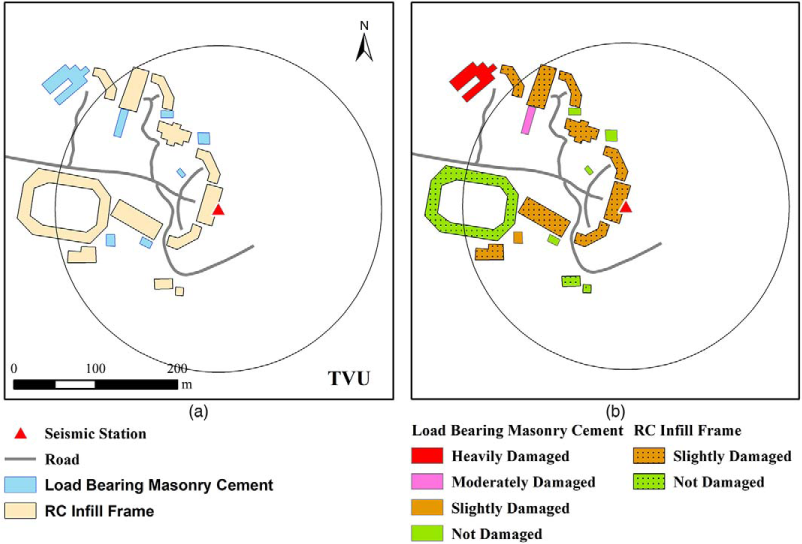
(a) Distribution of buildings according to construction type and (b) damage suffered during earthquake around seismic station TVU.
(a) Heavily damaged masonry building and (b) damage to foundation of moderately damaged RC building around TVU.
There was damage to the foundation and columns (Figure 6b) in some of the RC structures, and a compound wall around one of the department buildings completely collapsed.
Ptn (Pulchowk Campus, Patan)
Most buildings inside the Institute of Engineering, Pulchowk Campus premises where PTN is installed are predominantly load-bearing masonry cement mortar structures (Figure 7a). The station itself is set inside a single-story load-bearing masonry cement mortar building. The buildings outside the campus premises are predominantly RC infill frame structures. Almost 9% of total buildings considered for the study suffered moderate to heavy damage (Figure 7b). Two of the buildings that suffered damage were built with brick and lime mortar “bajra.” One of the buildings that was used as office suffered cracks in the walls and was evacuated following the earthquake. Another one-story lime mortar building was heavily damaged (Figure 8a). Some of the RC infill frame buildings in the study area suffered cracks on the outer walls and beams. We observed a multistory RC infill frame building with shear cracks on the outer façade (Figure 8b).
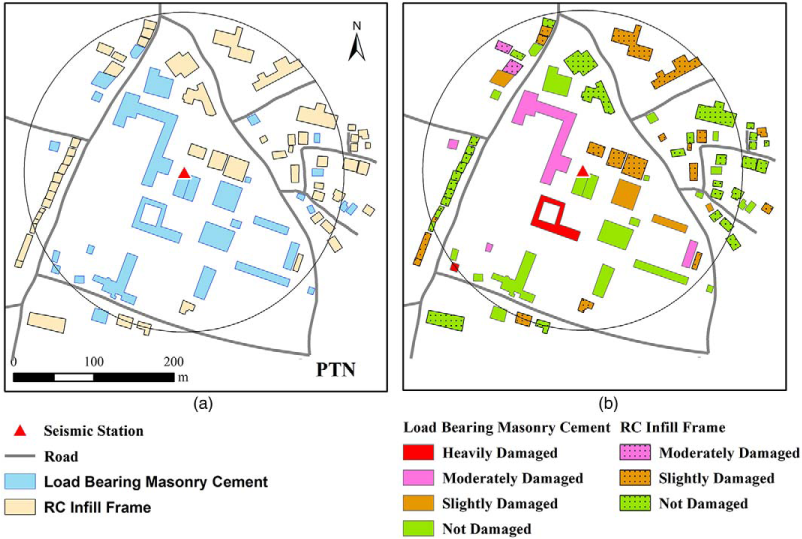
(a) Distribution of buildings according to construction type and (b) damage suffered during earthquake around seismic station PTN.
(a) Heavily damaged masonry building with lime mortar and (b) shear cracks developed in moderately damaged RC building around PTN.
Thm (University Grants Commission, Sanothimi)
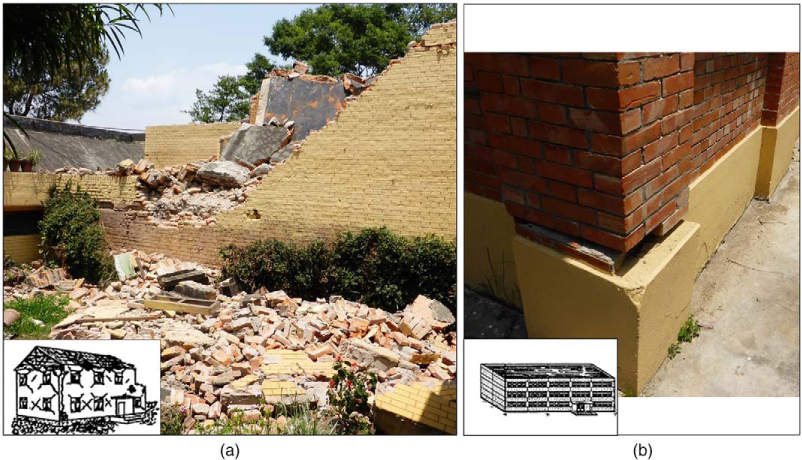
The station THM is installed in the ground floor of four-story RC infill frame building of University Grants Commission in Sanothimi. As the area around THM is a relatively new settlement, most of the buildings are RC structures, but there are public buildings that are masonry structures (Figure 9a). This site suffered the least damage (Figure 9b) when compared with the other sites. A masonry school building suffered moderate damage, and wall cracks (Figure 10a) were clearly visible. A few fallen tiles from the roof were also observed in another building of the same school. The compound walls around the school (Figure 10b) and around a government office collapsed after the earthquake.
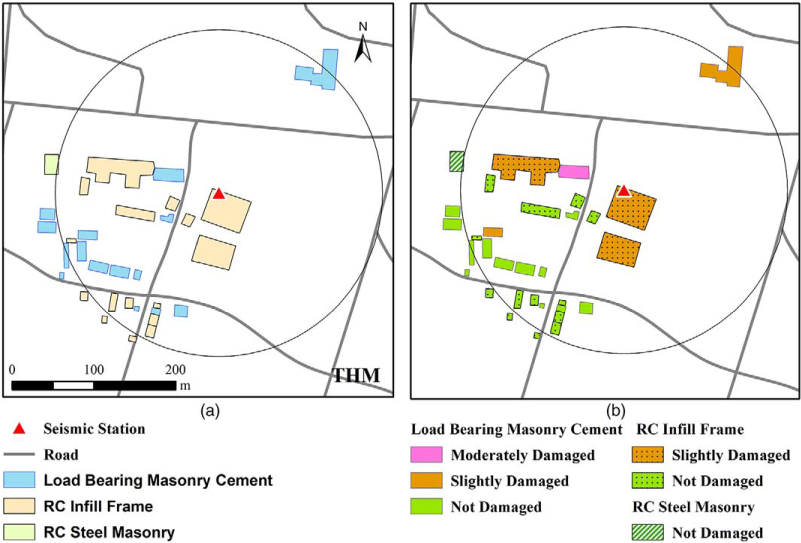
(a) Distribution of buildings according to construction type and (b) damage suffered during earthquake around seismic station THM.
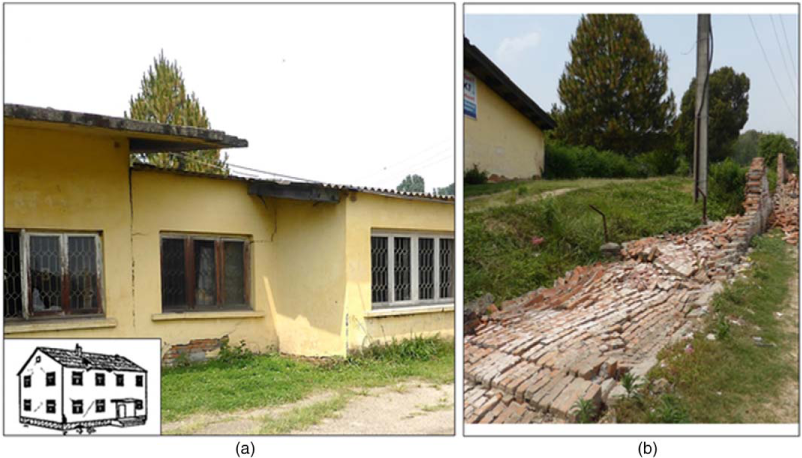
Damage around THM: (a) moderately damaged masonry building and corresponding damage classification according to EMS98 in inset and (b) collapsed masonry compound wall.
Discussion
The result of the damage assessment can be compared with the strong-motion records at the respective stations. We calculated the acceleration response spectra of a single degree of freedom (SDOF) system with 5% damping ratio in average horizontal direction for all stations (Figure 11). The acceleration response spectra display high response in short periods in rock site KTP. On the other hand, the response is high in the long-period range in the case of the sediment sites as a result of the thick lake sediments. The Fourier spectra of the main shock (Figure 2) at KTP display a predominance of short-period waves. In the acceleration response spectra (Figure 11), we can see that the response of KTP in the periods shorter than 1 s is comparatively higher. Moreover, the response at THM is the highest in periods longer than 3 s. The response in TVU has high peaks in the 0–1 s and 1–2 s ranges, and another peaks in periods longer than 3 s. The response of PTN is high in the 0–1 s and 1–2 s period ranges. In the 1–2 s period range, the response of TVU is the highest than those of other stations.
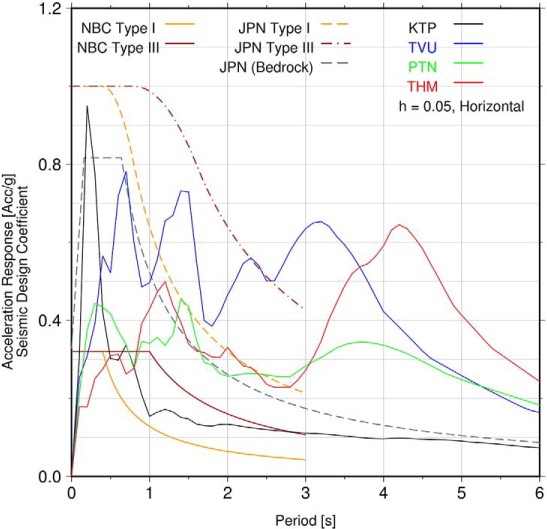
Acceleration response spectra of the earthquake. Solid brown and yellow lines are the design spectrum according to NBC-105, and dotted lines are according to AIJ-1993 and MLTI-2000.
The Nepal Building Code for seismic design of buildings (NBC-105) relates the seismic design coefficient as a function of basic seismic coefficient, seismic zone factor (Z), importance factor of buildings (I), and structural performance factor (K). The seismic zone factor in the NBC-105 is determined by the seismic zonation map of Kathmandu (NBC-105 1995), based on the Probabilistic Seismic Hazard Assessment (PSHA). The seismic design coefficient for Type I soil (hard rock/stiff soil) and Type III soil (soft soil >30-m depth) based on NBC-105 is much lower than the responses of the record (Figure 11). It is worth noting that the NBC-105 is in allowable stress design levels and the spectra shown in Figure 11 assume the following values in the NBC-105 Equation 8.1: Z = 1.0, I = 1.0, and K = 4.0. On the other hand, when compared with the design requirement of Building Standard Law of Japan (AIJ 1993) for the same soil types, we find that the design coefficient is higher than the response of the earthquake. The Safety limit curve for engineering bedrock according to the Building Standard Law of Japan (MLIT 2000) is also higher than KTP response except for very short periods.
Although there are slight damages to a few RC buildings around TVU and PTN, very few RC infill frame structures suffered moderate to heavy damage (Table 2). No RC infill frame structures suffered damages around KTP. Several load-bearing masonry structure buildings suffered moderate to heavy damage in all the sites. The summary of the damage situation (Table 3) shows the damage ratio is high in TVU and PTN. The damage ratio is the percentage of moderate and heavily damaged buildings to total number of buildings studied around a station. We compared the Fragility Curve for load-bearing masonry cement mortar and RC infill frame structures of Nepal (JICA 2002) with the damage ratio (Figure 12). We also considered the fragility curve for moderate damage of load-bearing masonry cement mortar and RC infill frame structures (Chaulagain et al. 2016). The difference in values of fragility curves for the same type of buildings from two different research studies can be attributed to difference in method of fragility curve construction. We observed that though the damage ratio is higher in the masonry structures than in the RC infill frame structure, they remained under the respective curves meaning the damage was less than expected by these curves. Since, load-bearing masonry mud mortar structures were found only in KTP, we could not compare their damage with other sites.
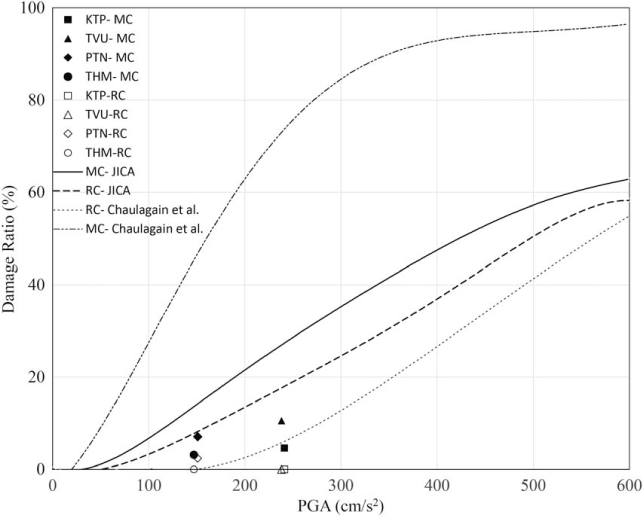
Comparison of fragility curve and damage ratio. The fragility curve for load-bearing masonry cement mortar (MC) and reinforced concrete (RC) infill frame buildings are from JICA (2002) and Chaulagain et al. 2016.
Damage of buildings according to type of construction
Summary of damage situation around the stations
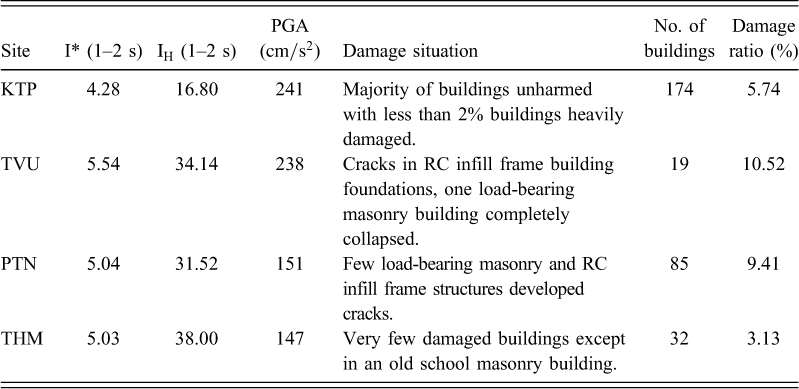
A study in Japan (Sakai et al. 2004) proposed an earthquake intensity based on acceleration response between 1–2 s period (I*) to explain damage to infrastructures as it found that the JMA Instrumental Intensity could not explain the damage properly. We referred to this and found that I* directly relates to heavy damages around the stations. We can see that this intensity is high for TVU (I*, Table 3) during the Gorkha earthquake. It is worth noting that the response of TVU (Figure 11) is higher than those of other sites not only in 1–2 s range but in broad range of 0.5–3 s. The building damage may not be related to the predominant period of the building alone, as most of the low-rise and medium-rise buildings in the Kathmandu Valley have a predominant period of 0.1–0.2 s (Parajuli and Kiyono 2015), but the response of TVU in the 0.1–0.2 s range is not the highest. The site TVU suffered the heaviest damage among the four stations, and the parameter I* can directly be associated with the building damage. On the other hand, even though the Housner Spectral Intensity (IH) (Housner 1952) calculated from the pseudo-velocity spectrum over the 1–2 s period range is the highest (38.00) for THM, the percentage of damaged buildings is lower in THM than around other stations. Figure 13 shows the positive correlation between intensity I* and the number of slightly damaged (Ds), moderately damaged (Dm), and heavily damaged (Dh) buildings. The direct effect of site amplification can be clearly understood as the area around KTP suffered less damage despite having old masonry buildings, whereas comparatively new RC structures suffered damage in the area around TVU.
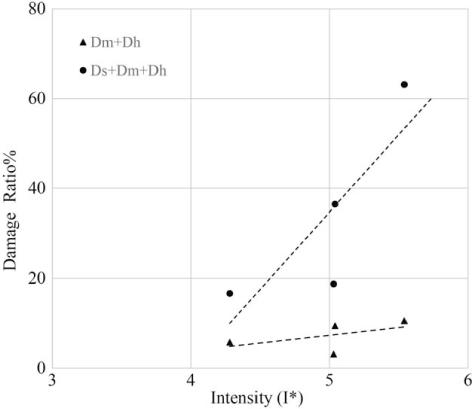
Correlation between earthquake intensity (I*) and damage ratio of slightly damaged (Ds), moderately damaged (Dm), and heavily damaged (Dh) buildings.
Many buildings in different parts of the Kathmandu Valley, like Bhaktapur, Gongabu, Sitapaila, and Ramkot, suffered heavy damage (Figure 14) due to the Gorkha earthquake. Several buildings in Gongabu were tilted due to liquefaction, and many RC buildings completely collapsed. A team of researchers (Angster et al. 2015) traced an extension of a localized lineament in an area lying south-west of THM, and they attributed the origin of the lineament to geological condition and earthquake shaking. Unfortunately, these worst hit areas of Kathmandu did not have seismic stations nearby, so the assessment on those areas has not been carried out for the present study due to lack of strong-motion data to compare the damage. As basin topography and sediment in the Kathmandu Valley is very heterogeneous, the response of sites merely few hundred meters apart varies a lot, so generalizing the response might not produce accurate results.
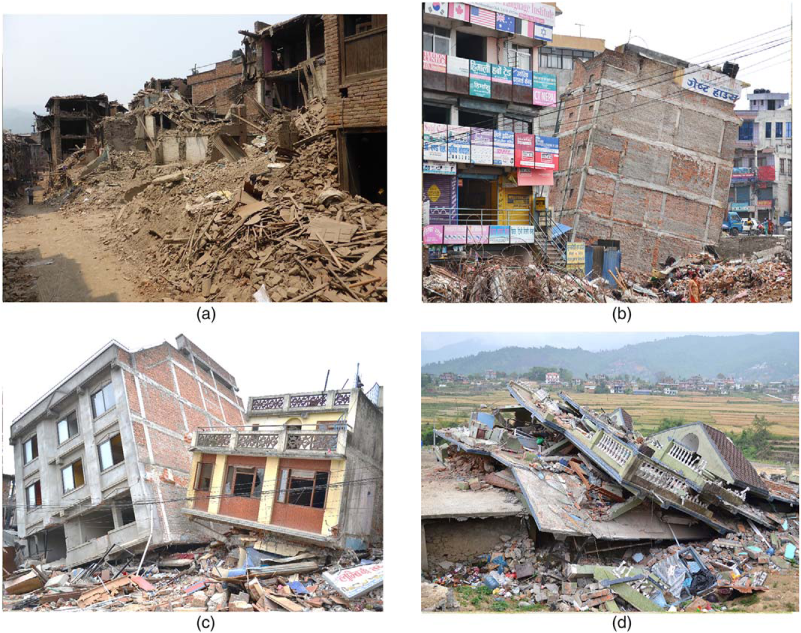
Damage to building in other parts of the Kathmandu Valley: (a) damage to masonry structures in Bhaktapur, (b) tilted and damaged RC infill frame building in Gongabu, (c) damaged RC infill frame structure in Sitapaila, and (d) collapse of RC infill frame structure in Ramkot.
The high response of the earthquake in longer periods indicates the dominance of low frequency waves during the Gorkha earthquake. The natural frequency of the low-rise buildings are high and they do not resonate with the low frequency wave (Parajuli and Kiyono 2015). This might explain the relatively low damage that occurred in Kathmandu during this earthquake, which was less catastrophic than previously anticipated (Hough 2015). Nevertheless, the low strength of load-bearing masonry structures can be the cause of damage to vernacular structures in the valley. The earthquake, on the other hand, would have been more likely to seriously damage high-rise buildings and base isolated structures that have longer natural periods, had there been any inside the valley.
Conclusion
As the latest devastating earthquake in the history of Nepal Himalaya, the Gorkha, Nepal earthquake caused a lot of damage in terms of life and property in central Nepal. The earthquake occurred at a shallow depth in west Nepal and the rupture moved toward the east. The ensuing aftershocks were concentrated in the eastern extremity of the rupture zone. This study compared the strong-motion characteristics and their relation to damage around seismic stations. As the fieldwork was carried out before the occurrence of the largest aftershock (Mw7.3), the damage recorded in the area is due to the main shock. The main shock records have dominant long-period waves and have high response in long periods. Acceleration response spectra show high response of sediment site TVU in the 1–2 s period range, and it can be directly related to the damage to structures around the site. This can be seen in contrast to the damage in KTP. Most of the old masonry structures built without proper engineering consideration in KTP survived the earthquake without substantial damage, whereas masonry structures in TVU suffered damage and even relatively new RC structures suffered slight damage. Due to absence of high-rise and base isolated buildings in Kathmandu, the effect of high long-period response of the earthquake could not be seen. The acceleration response spectra of the sites were much higher than the seismic design coefficient prescribed by the Nepal Building Code, which necessitates an update to the present building code to accommodate potential large earthquakes of this magnitude. On the other hand, the update of the code to include stringent measures raises the question of the higher cost of construction. The local government can play an important role in raising awareness about seismic safety as well as minimizing the economic burden for house owners. For our further work, we will use the earthquake records of the main shock and aftershocks to prepare a three-dimensional subsurface model of the Kathmandu Valley to understand the strong-motion characteristics of the heterogeneous valley sediment that will help in updating the building code.
Footnotes
Acknowledgments
We used the Generic Mapping Tools (Wessel et al. 2013) to prepare some of this figures in the paper. We would like to acknowledge USGS (USGS 2015) for the data regarding epicenter location, origin time, and the focal mechanism. The MFT surface extension drawn in the location map was based on (![]() ). We would like to acknowledge Prof. Dr. M. R. Dhital and Mr. Sudhir Rajaure from the Central Department of Geology at the Tribhuvan University in Nepal for their important role in maintaining the strong-motion network. A part of this study was supported by the Grant-in-Aid for Scientific Research No. 23404005 from MEXT, Heiwa Nakajima Foundation, Obayashi Foundation, and MEXT of Japan, under its Earthquake and Volcano Hazards Observation and Research Program. We are grateful to the anonymous reviewers who gave their time to review the manuscript and helped improve it.
). We would like to acknowledge Prof. Dr. M. R. Dhital and Mr. Sudhir Rajaure from the Central Department of Geology at the Tribhuvan University in Nepal for their important role in maintaining the strong-motion network. A part of this study was supported by the Grant-in-Aid for Scientific Research No. 23404005 from MEXT, Heiwa Nakajima Foundation, Obayashi Foundation, and MEXT of Japan, under its Earthquake and Volcano Hazards Observation and Research Program. We are grateful to the anonymous reviewers who gave their time to review the manuscript and helped improve it.