
Abstract
The Faculty of Architecture and Engineering Building at Tohoku University survived two strong ground motions. This is not surprising because the structure was stiff and strong. What is surprising is that the first ground motion did not cause severe structural damage but the second one caused so much structural damage that the building had to be evacuated and demolished. The damage occurred despite two key facts: (1) the intensities of the mentioned ground motions are understood to have been similar and (2) the building was strengthened after the first motion (and before the second) following stringent standards.
Introduction
The Faculty of Architecture and Engineering Building at Tohoku University is an ideal study case. It had a fairly regular structural system, its blueprints were clear and well preserved, it was instrumented and its instruments were well maintained, and it experienced two strong ground motions with similar intensities (one in 1978 and another in 2011). Between these two ground motions, the building was repaired and strengthened and this work was carefully documented. Conceiving and executing a full-scale experiment to produce the information provided by this building and gathered by the dedicated researchers who studied and monitored it through decades would have taken not only much time and effort but also a prohibitive amount of money. This paper reviews the properties and history of the building and focuses on the damage caused by the 2011 Tohoku earthquake and plausible explanations for it.
Brief Description of the Structure
The building was a nine-story composite structure built in 1969 (Figures 1 and 2). It had a two-story podium with a seven-story tower above it. The structural system consisted of a combination of structural walls and three-dimensional frames. It was instrumented with accelerometers installed in the first and ninth stories (Shiga et al. 1981).
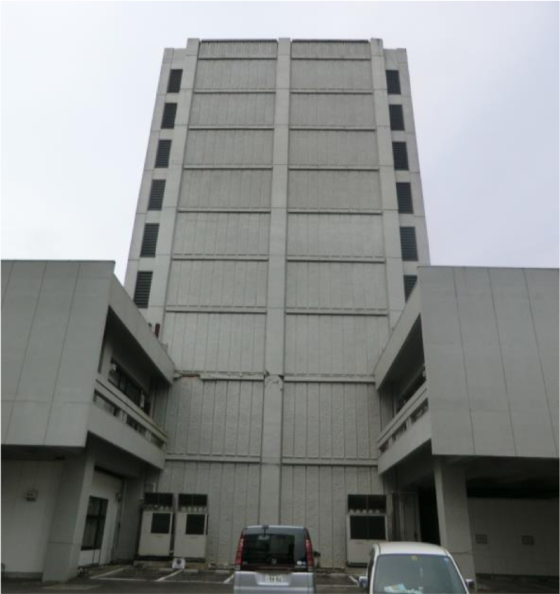
Faculty of Architecture and Engineering Building at Tohoku University.
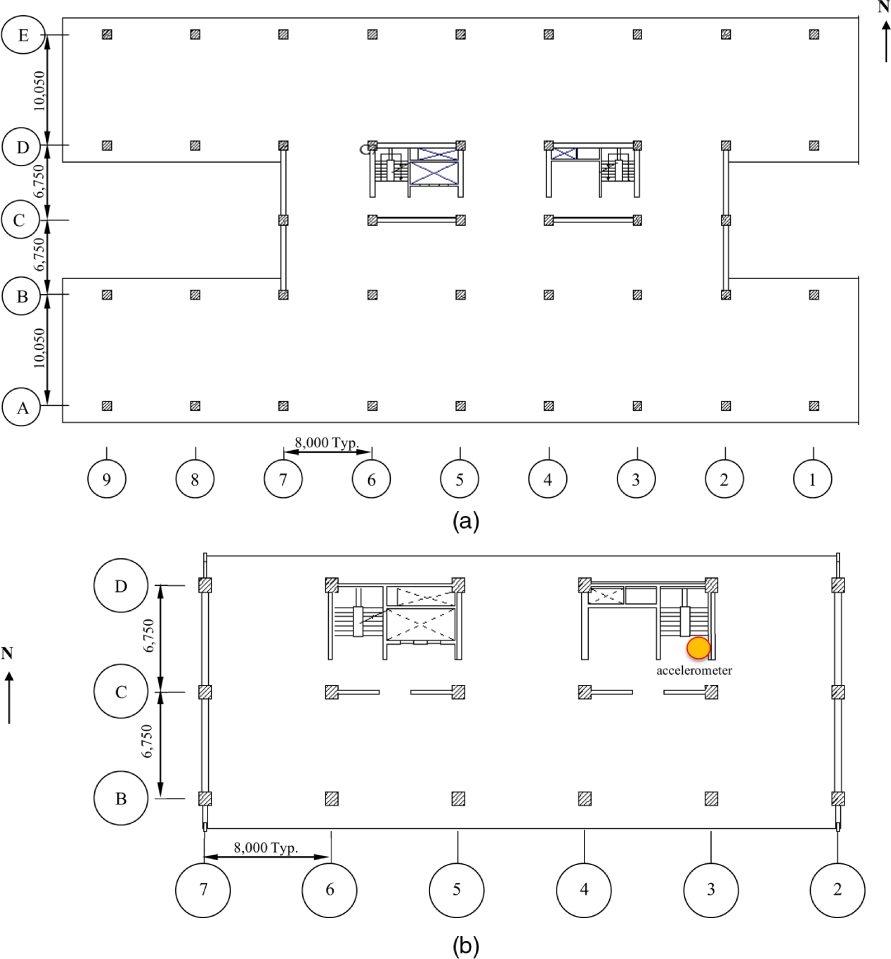
Plan views: (a) Stories 1 and 2 and (b) Stories 3 to 9 (dimensions in mm).
Structural Layout
In the lower two stories, the building had eight bays and two overhangs in the east-west (E-W) direction and four bays in the north-south (N-S) direction. The floor plan of the two lower stories had the shape of the letter H, with outer dimensions of 72 m (E-W) by 36.6 m (N-S). The floor plans of the upper seven stories were rectangular, with five bays in the E-W direction, two bays and two overhangs in the N-S direction, and outer dimensions of 40 m (E-W) by 17.2 m (N-S). The total floor area was 9,200 m2. Story heights measured from top of slab to top of slab were 5 m for the first story, 4.3 m for the second story, 3.8 m for the third story, and 3.3 m for the rest. Figure 2 shows floor plans, and elevations are given in Figures A1 and A2 of the online Appendix.
The lateral load–resisting system was a combination of frames and structural walls. Frames were not discontinued where structural walls were present. Instead, frame elements (both columns and beams) with the same dimensions as frame elements elsewhere were cast integrally with the walls. This arrangement resulted in wall boundary elements with the same dimensions of columns located away from walls. The layout of walls and columns is shown in Figure 2. Details about the structure are given in the online Appendix and in NEES (2016).
In each plan direction, there were two parallel walls. They were continuous from foundation to roof. In the E-W direction, both walls were located along the midcolumn line (Axis C). In the N-S direction, they were located along the exterior column lines of the upper seven floors. In addition, C-shaped walls were located next to the northernmost column line (Axis D).
The floor system consisted of flat slabs supported by frame girders and intermediate beams framing into these girders at their midspans. The foundations of the building comprised spread footings connected by grade beams.
Structural Details
Beam, column, and wall dimensions and reinforcement are listed in the online Appendix. Beams and columns were reinforced with steel angles, plates, and reinforcing bars in both transverse and longitudinal directions (Figure 3). Essentially, the angles and plates formed a lattice frame that was cast within a concrete frame.
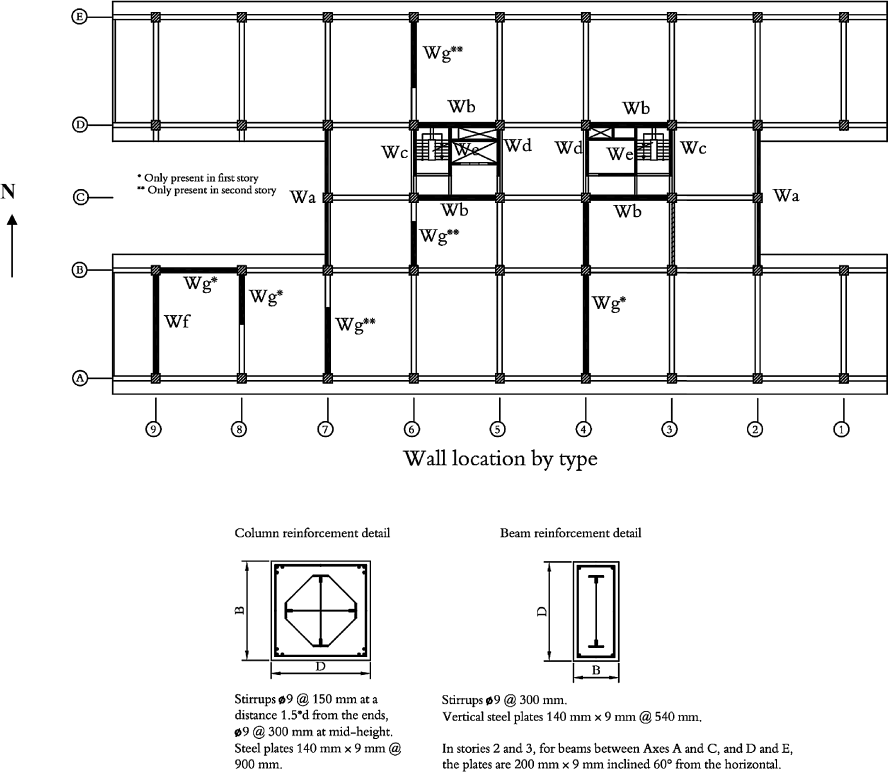
Wall layout and beam and column reinforcement details. (See the online Appendix for details.)
The specified compressive strength of the concrete was 210 kgf/cm2 (21 MPa, 3,000 psi). The mean compressive strength of samples extracted from the building in April 2011 was 180 kgf/cm2 (18 MPa, 2,600 psi) (Kuji Architecture Studio 2011). The mean compressive strength of cores extracted from the third story was 150 kgf/cm2 (15 MPa, 2,100 psi).
The longitudinal reinforcing steel bars were specified to meet Japanese Standard SD35: nominal yield stress of 3,500 kgf/cm2 (345 MPa, 50 ksi) and expected yield stress of 4,000 kgf/cm2 (390 MPa, 57 ksi). Steel angles were specified to meet Standard SS40: nominal yield stress of 2,400 kgf/cm2 (235 MPa, 34 ksi) and expected yield stress of 3,000 kgf/cm2 (295 MPa, 43 ksi). Transverse reinforcing bars were specified to meet Standard SR24: nominal yield stress of 2,400 kgf/cm2 (235 MPa, 34 ksi).
Measured Period and Estimated Base Shear Strength
The fundamental or first-mode period of the building changed over the years. The stiffness of the structure changed because of cracking caused mainly by earthquakes and because of strengthening done in 2001. Numerical analyses of a linear-elastic model of the as-built building, carried out without consideration of foundation soil flexibility, indicate that, in the longitudinal direction (E-W), its initial period was approximately 0.5 seconds while in the transverse direction (N-S) it was 0.4 seconds. Motosaka et al. (2004) report initial periods approximately equal to these values for displacement amplitudes not exceeding approximately 1/105 times the building height.
Published limit analysis results (Suzuki et al. 2013, Kimura et al. 2012) show that the base shear strength of the building was (1) likely to have been between 0.3 and 0.5 times its weight (with the variation related mainly to differences in the assumed distribution of lateral forces) and (2) controlled by a flexural failure mechanism with hinges in columns and walls at the base of the third floor. Other studies about the building and the ground motions that affected it include Francisco and Matsuoka (2006), Fujihashi and Inoue (1997), and Shiga et al. (1981).
Response to the Earthquake of 1978
One of the major earthquakes that affected this building was the 1978 Miyagi-Ken-Oki; refer to Figure 17 for acceleration records obtained by Tsamba and Motosaka (2011) at the first story. The peak ground acceleration was 0.26 g in the N-S direction, 0.21 g in the E-W direction, and 0.16 g in the vertical direction. The peak ground velocity was approximately 0.35 m/s in the N-S direction and 0.25 m/s in E-W direction. The earthquake caused shear and flexural cracks (with thicknesses not exceeding 1 mm) in the exterior shear walls (Figure 4), short beams, and a few columns of the third and fourth stories (Shiga et al. 1981). Approximately 2.5% of the windows broke and furniture overturned.
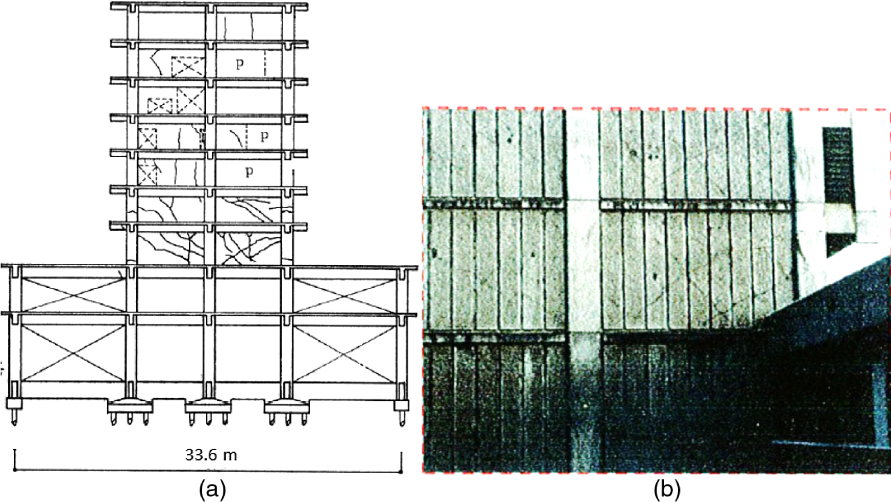
Damage observed in 1978: (a) crack map of the exterior wall along Axis 2 (Shiga et al. 1981) and (b) post-1978 earthquake cracks in second, third, and fourth stories.
The Retrofit of 2001
In 2001 the building was retrofitted to reduce torsion and increase the shear strength of the exterior walls in the N-S direction. The retrofit was limited to the upper seven stories. The concrete of the webs of the exterior walls in the N-S direction (Axes 2 and 7) was replaced with thicker cast-in-place webs made with concrete having a cylinder compressive strength of 300 kgf/cm2 (29 MPa, 4.3 ksi). Steel jackets were mounted on short beams in the interior frames (Axes 3–6 between Axes C and D) in the N-S direction. These beams were expected to be vulnerable to shear. Steel braces were fitted into two bays of the southernmost frame (Axis B between Axes 3 and 4 and Axes 5 and 6) in the E-W direction to reduce torsion, and portions of the floor slabs (between Axes 2 and 3 and Axes 6 and 7) were thickened and reinforced with additional steel welded wire. Figure 5 shows examples of the retrofit.
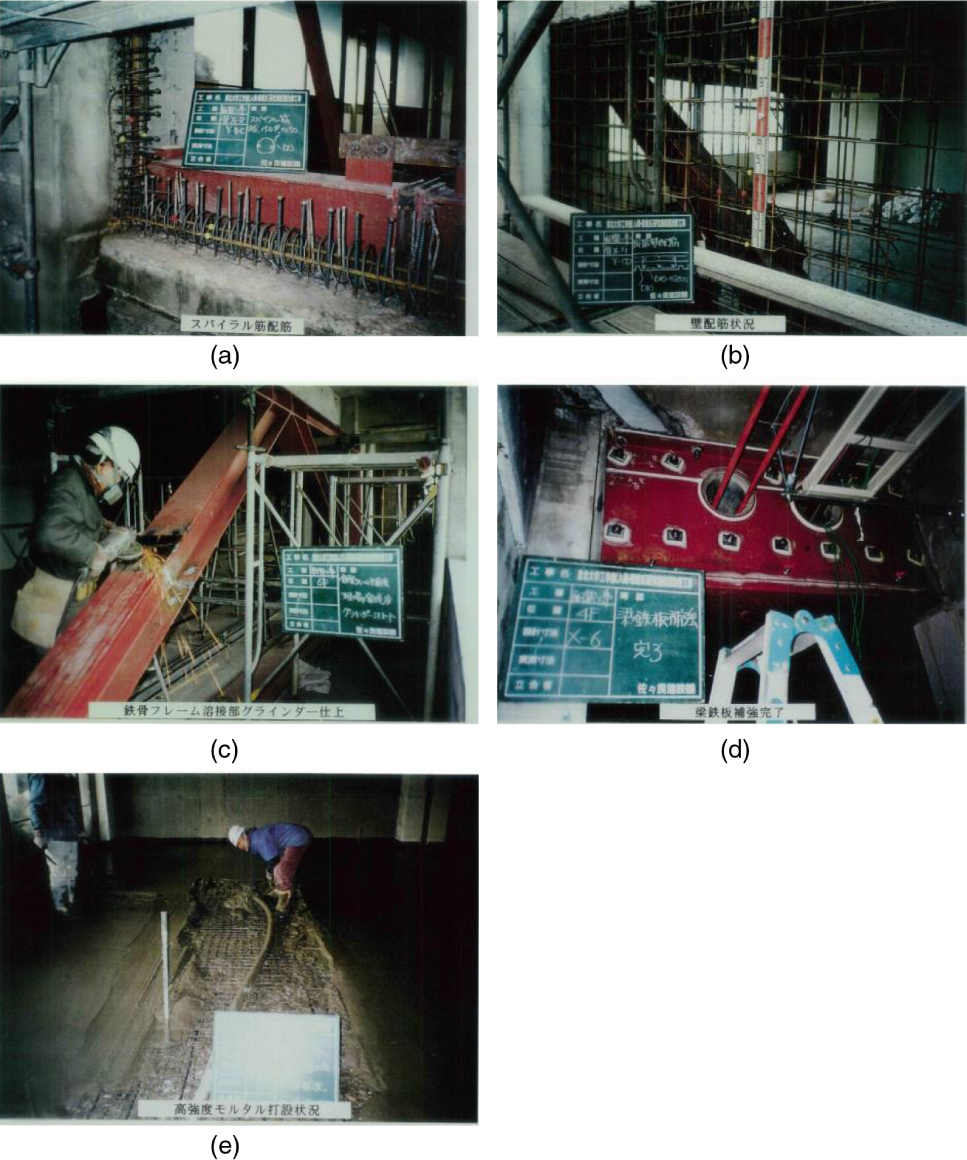
Retrofit of 2001: (a) reinforcement at wall web-beam connection, (b) replaced wall web reinforcement, (c) exterior steel braces in south facade, (d) steel jacket on short beams, and (e) slab thickening (courtesy of Tohoku University).
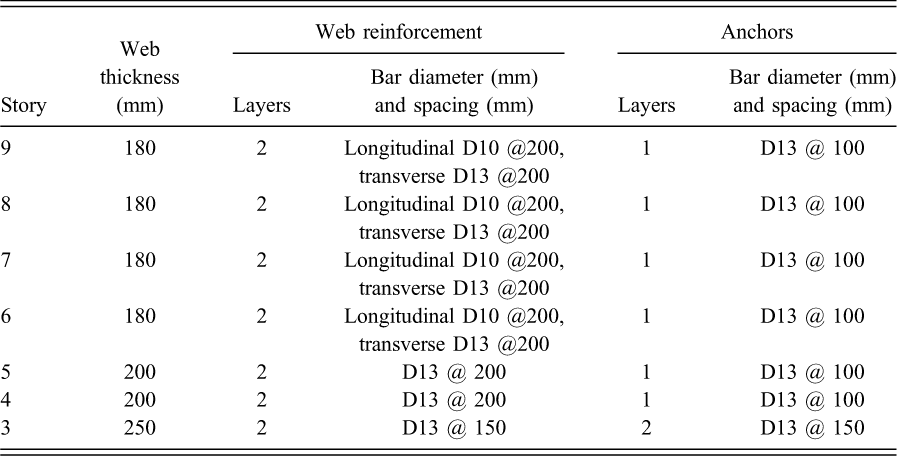
Figure 6 details the reinforcement used in the replaced wall panels. As the existing concrete of the webs of the exterior walls (oriented in the N-S direction) was removed, the existing reinforcement was cut 0.20 m away from the beams and columns. New web longitudinal and transverse reinforcement was provided in two layers (Table 1). Postinstalled anchors (deformed headed studs with 13-mm shafts spaced at 0.10 m) were glued 110 mm into the beams and columns and were embedded 260 mm in the new webs. These lengths were determined using Japanese design provisions for shear transfer. Spiral reinforcement, with a bar diameter of 6 mm, a pitch of 50 mm, and an outer diameter of 120 mm, was provided around the perimeter of the new webs. The spirals were used to prevent splitting and sliding failure at anchor bolts.
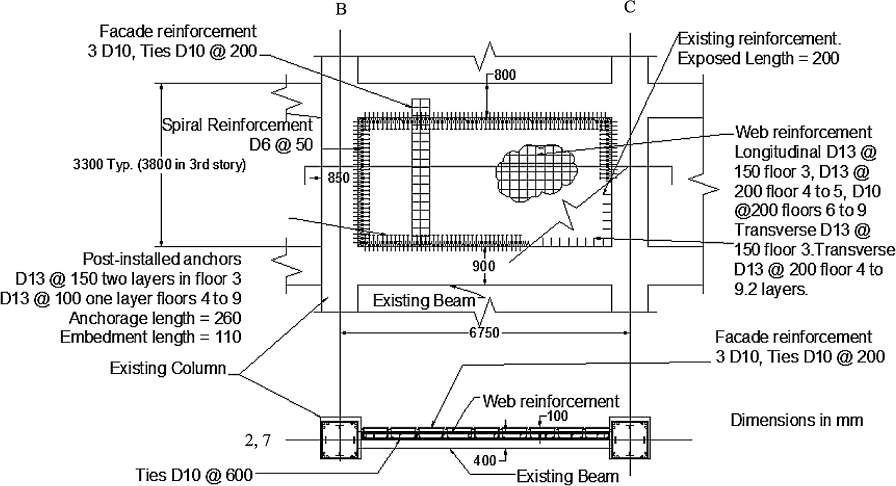
Details of the wall web reinforcement installed in 2001 (online Appendix).
Retrofit details for the walls on Axes 2 and 7
Response to the Earthquake of 2011
The building withstood the 11 March 2011 earthquake but not without heavy structural damage. It was demolished because the cost of repair was deemed too high for a structure nearing the end of its expected life span. Peak ground acceleration was approximately 0.34 g in both the N-S and E-W directions and 0.26 g in the vertical direction (refer to Figure 17b for acceleration records obtained at the base of the first story). Peak ground velocity was approximately 0.45 m/s in the N-S direction and 0.50 m/s in the E-W direction. At the ninth story, the maximum acceleration recorded in the transverse direction was 0.93 g (refer to Figure 18b).
The damage was concentrated at the base of the third floor in the exterior walls oriented in the N-S direction (Figure 7). The concrete in the boundary elements of these walls disintegrated along heights of up to 0.8 m. Longitudinal reinforcement buckled and/or fractured. The joint between the original beams and the wall webs cast in the retrofit of 2001 was damaged: the concrete at the top of the beams spalled and the top beam reinforcement was exposed. The interior C-shaped walls in the third floor had shear and flexural cracks, and at the level of the 4th floor, spalling occurred (Figure 7b).
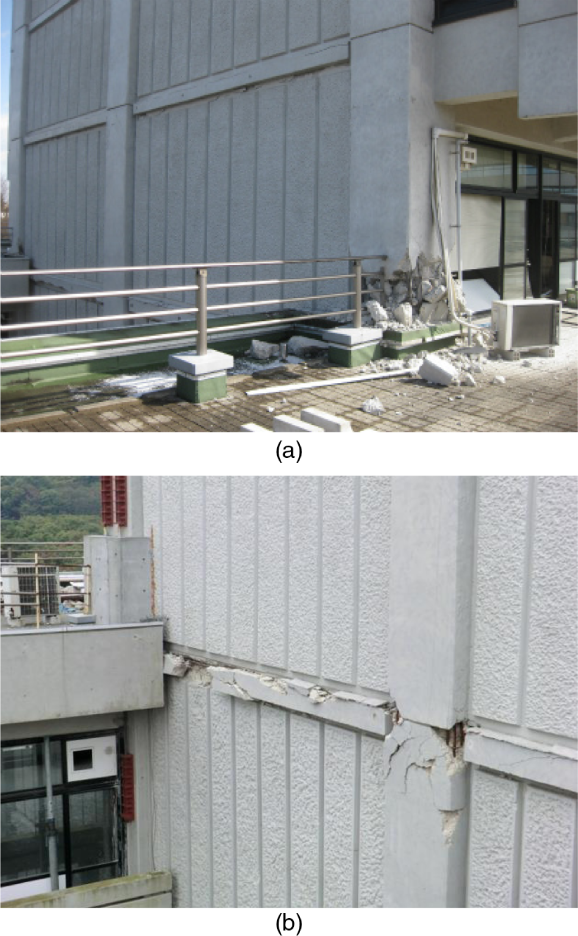
Damage to exterior walls after the earthquake of 2011: (a) disintegrated boundary element and (b) damage to beam-web joint and intermediate column.
Surveys of the building were done in October 2011, March 2012, and June 2012. Figure 8 shows crack maps obtained in those surveys for Axes 2 and 3.
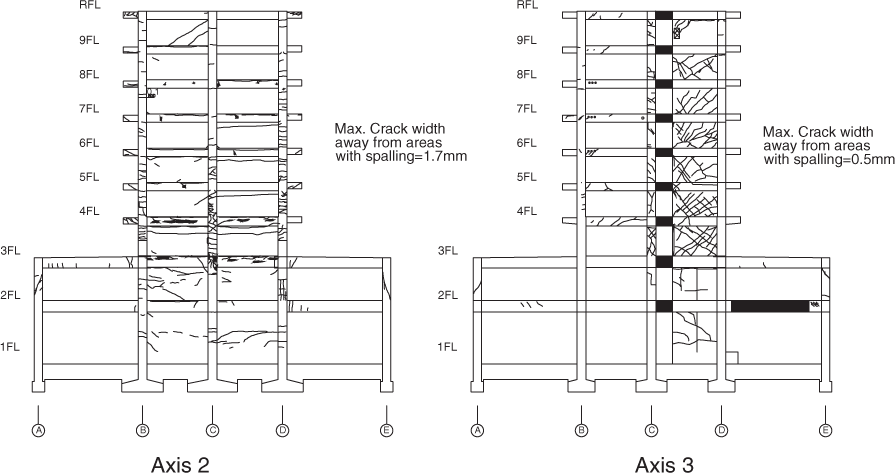
Crack maps obtained after the 2011 earthquake.
Key Observations and Inferences
The structure was shored snug during the retrofit of 2001 to avoid large increases in the axial loads in columns along the retrofitted axes (Axes 2 and 7). The top portions of the replaced web “panels” were cast using a concrete mix designed to reduce shrinkage, which could also have caused increases in the column axial load. No clear signs of shrinkage in the replaced webs were observed in the inspections made after the 2011 earthquake.
Figure 9 shows one of the columns that disintegrated during the 2011 earthquake. All deformed bars buckled. Some steel angles also buckled and remained buckled, but, interestingly, other angles did not. Instead, they remained straight and had fractures. The angles that did not have buckled shapes after the earthquake are likely to have fractured at welds or rivet holes (Figure 10). The angles that remained buckled must either have (1) fractured at rivet holes in the beam-column joint or (2) accumulated large plastic tensile deformations followed by compression. Studies of the steel samples extracted by Takenaka Corporation indicate that, away from rivet holes and welds, at least some of the reinforcing angles in the damaged columns did not reach large plastic deformations. The observed buckling may have resulted from a sequence of events starting with fracture in the beam-column joint followed by pullout and ending with buckling (Figure 11). The buckling of vertical reinforcing angles may have triggered the observed spalling of the column concrete shell. Wall sliding is unlikely to help explain the combination of buckling and fractures observed. The following observations provide more insight:
The shape of the cross sections of interior (C-shape) and exterior walls would indicate that, as confirmed by analysis, the webs of interior walls were at least as vulnerable in compression (caused primarily by flexure) as the boundaries of the exterior walls under southward inertial forces. The webs of interior walls did show cover spalling at their connections with fourth-floor beams. Nevertheless, the level of damage was not comparable to the damage observed in the boundary elements of exterior walls. Figure 7b shows the 2011 earthquake damage to the intermediate column (at Intersection 2C) in the exterior structural wall on the east elevation of the building. The deformed reinforcing bars buckled despite the fact this column was unlikely to experience large compression forces during ground motion. Vertical splitting cracks in the column may have been the result of reinforcement buckling. Such cracks were not visible in the web, where damage tended to concentrate around the bottom ends of the anchor bolts installed in 2001.
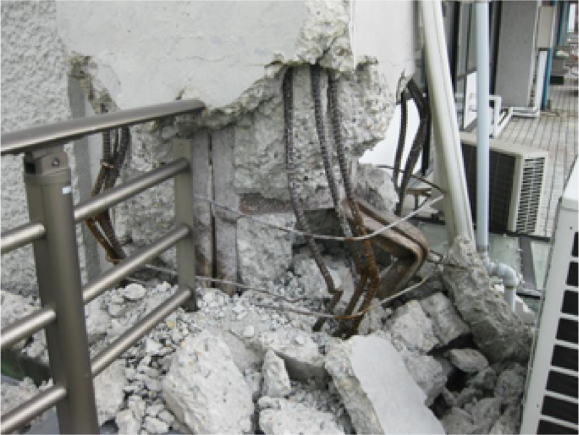
Base of boundary element at the third floor.
Fracture at weld.
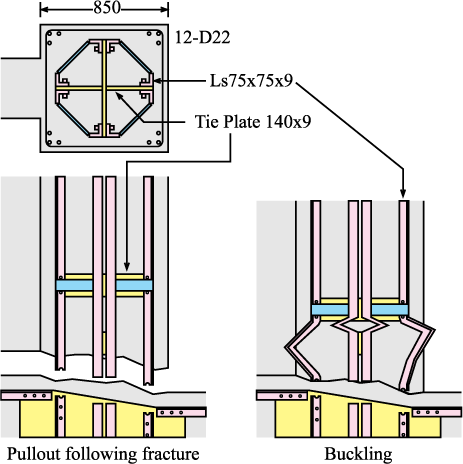
Plausible failure sequence (dimensions in mm).
These observations support the idea that spalling was caused or accelerated by the buckling of reinforcement with large permanent tensile deformations or pullout failure following fracture in beam-column joints. A plausible failure sequence is as follows:
Angles fractured in tension in beam-column joints or near the lower ends of columns. Deformed bars reached large tensile strain near fractures in angles. Deformed bars buckled as the load reversed, forcing them to work in compression. Angles that had fractured in joints buckled as the load reversed (Figure 11) while those that had fractured in the columns did not.
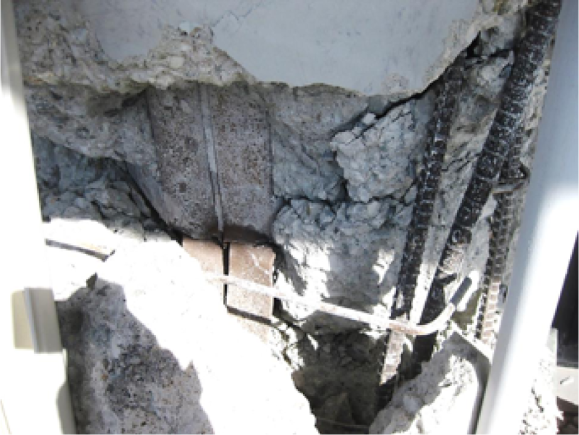
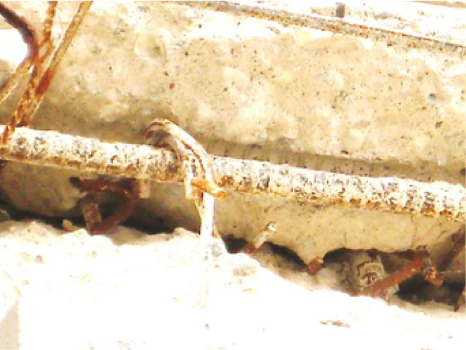
Figure 12 shows the top of a third-floor beam after the 2011 earthquake, indicating:
Anchor bolts that pulled out of the beam, forming “conical” failure surfaces in the concrete Buckled plain vertical bars that were part of the original web reinforcement Beam stirrups Beam top longitudinal reinforcement
Close-up of web-beam joint.
The buckled plain bars were embedded in the webs cast in 2001 approximately 20 bar diameters. They are unlikely to have developed their strength in such a short length. Again, the observed buckling may be the result of pullout failures followed by compression. Figure 13 shows a cross section of the web-beam joint as modified in the retrofit. Observe that the dotted line does not cross any reinforcement anchored effectively to resist large vertical tensile forces. At this location, the exterior walls were essentially unreinforced. A tensile failure at this location is likely to have occurred at a small wall drift and may have drastically altered the response of the wall, as discussed later. Pullout of the anchor bolts explains the concentration of damage seen in the web. This type of failure could have been avoided had the concept of “capacity design” been followed closely (Sullivan 2010). The anchorage of reinforcement needs to be stronger than the reinforcement itself.
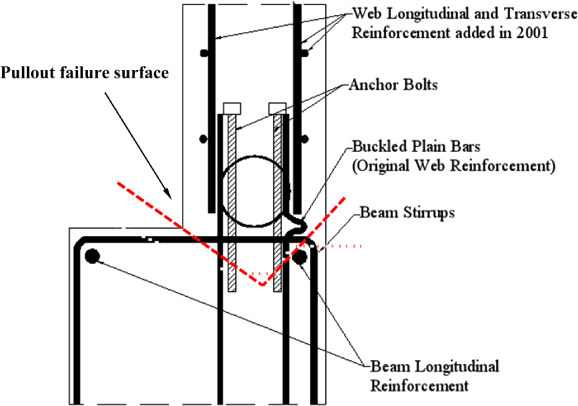
Cross section of web-beam joint.
The cracking away from the third-floor beams is also revealing and shows that shear deformations (and cracks) were larger in 1978 than in 2011, when the deformations seem to have concentrated at horizontal wall-beam joints.
The Conundrum
The key question is why there was more damage in 2011 despite the strengthening done in 2001. We see two plausible explanations: (1) the demand was higher and/or (2) the retrofit made the building more vulnerable.
Was Demand at the Site Higher?
It is clear that the earthquake of 2011 (Great East Japan earthquake, Mw 9.0) was a larger event than the 1978 earthquake (Miyagi-Oki earthquake, Ms 7.7). The critical question is whether the intensity at the site was higher.
Within 0.5 km, at least four other buildings that survived the 1978 event were evacuated and demolished after the 2011 event. We do not know all the details about their state after the 1978 earthquake, so we cannot make direct comparisons on this basis. Nevertheless, we do know that (1) 4 out of 13 buildings inspected in the area in 1978 had 1.5-mm cracks in structural walls and were deemed to require structural repairs, and (2) in two of the buildings surveyed in 1978, the damage in 2011 took place mostly in coupling beams, which were not inspected in 1978.
In terms of PGA, the ground motion of 2011 was 30%more demanding. In terms of PGV, the increase in demand was also 30%. Nevertheless, PGA and PGV are far from being infallible intensity indices. A better index is linear spectral displacement. Figure 14 shows that, for practical purposes, the linear spectra from 1978 and 2011 were essentially equal. This coincidence is remarkable and makes this case extraordinary. Because linear spectra are not the only vehicle available to estimate displacement demand, we also considered nonlinear spectra. Nonlinear spectra are not as crisp as linear spectra because they depend on many parameters in addition to the ratio of mass to initial stiffness (i.e., postcracking stiffness, strain-hardening stiffness, unloading stiffness, reloading stiffness, etc.). Nearly 700 dynamic analyses of nonlinear SDOF systems were conducted to try to understand the extent to which nonlinear oscillators may have been more sensitive to the 2011 ground motion. The oscillators considered are described in Table 2 and Figure 15. The analysis results are summarized in Figure 16.
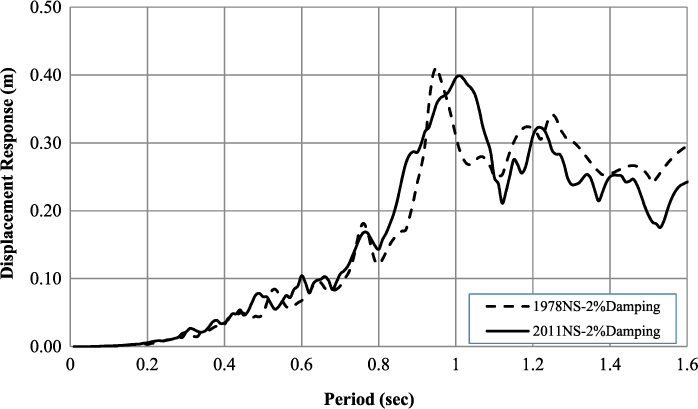
Linear displacement spectra.
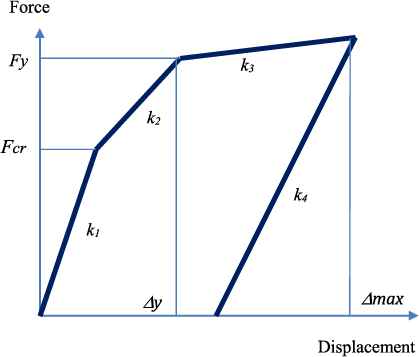
Load-displacement curve for nonlinear oscillators.
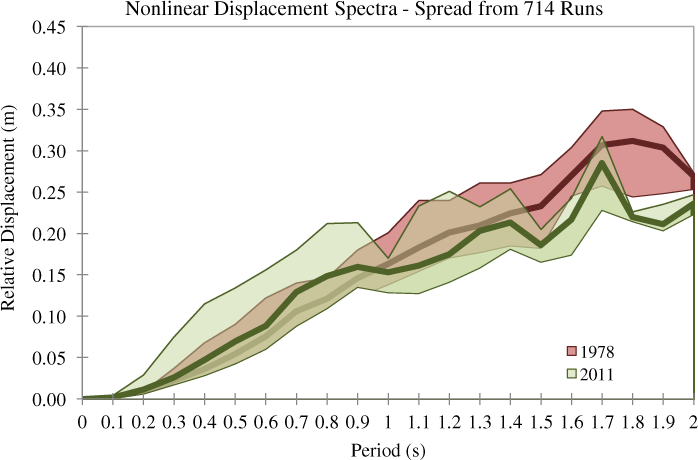
Nonlinear displacement spectra.
Parameters of oscillators.
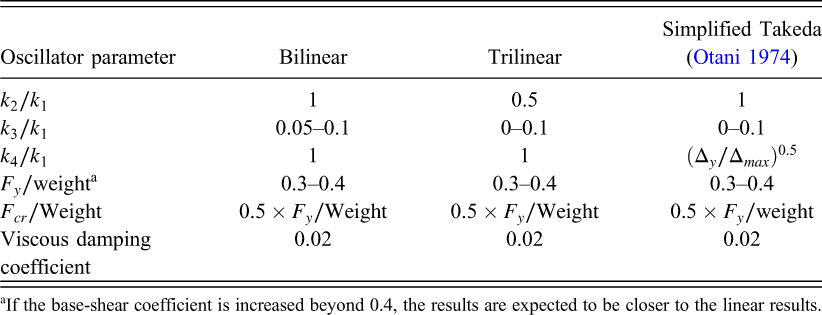
If the base-shear coefficient is increased beyond 0.4, the results are expected to be closer to the linear results.
From the nonlinear analysis results obtained, it seems reasonable to conclude that the 2011 record did not produce consistently larger displacement demands in structures with the required toughness. From the evidence presented, we cannot conclude that the demand in 2011 was drastically larger than that in 1978.
We now turn to the recorded response to try to infer the displacement demand at which the failure of 2011 may have started.
The N-S Records
Figures 17 and 18 show segments of acceleration records obtained at the site and generously provided to us by Prof. Motosaka of Tohoku University in 2011. A quick inspection reveals a large difference in duration. The 2011 motion lasted more than four times the duration of the 1978 motion. We modified the acceleration records by removing signals with periods exceeding 6 s (for records from 1978) and 16 s (for records from 2011). The velocity records obtained by integrating the resulting acceleration records were also modified by removing the mean velocity. The modified velocities were integrated to obtain estimated displacements. Figure 19 shows segments of relative displacement histories estimated from the 1978 and 2011 records. They were computed by subtracting computed base displacements from computed ninth-floor displacements. We concentrate on the N-S direction because this was the direction of the walls that failed.
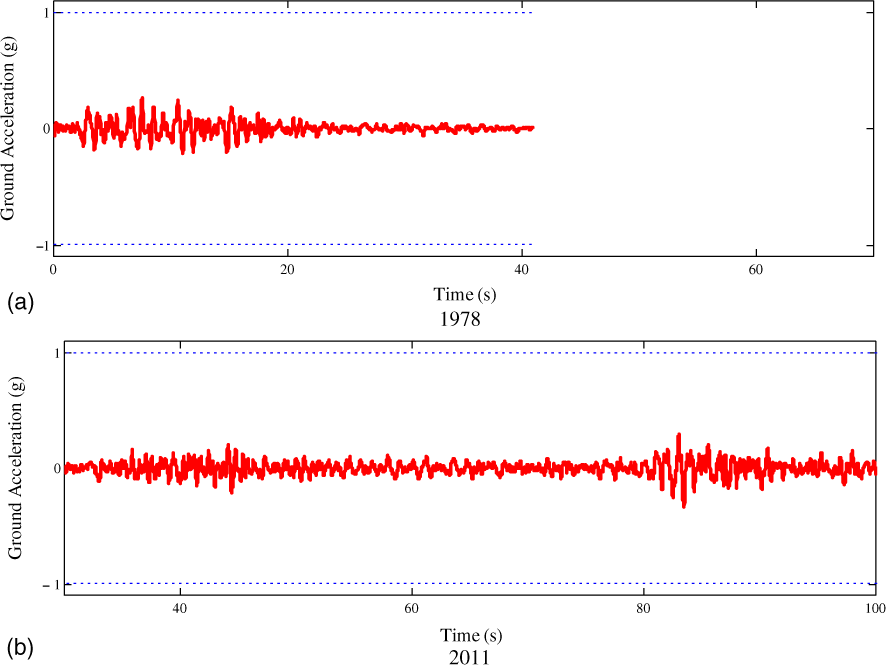
Ground acceleration records.
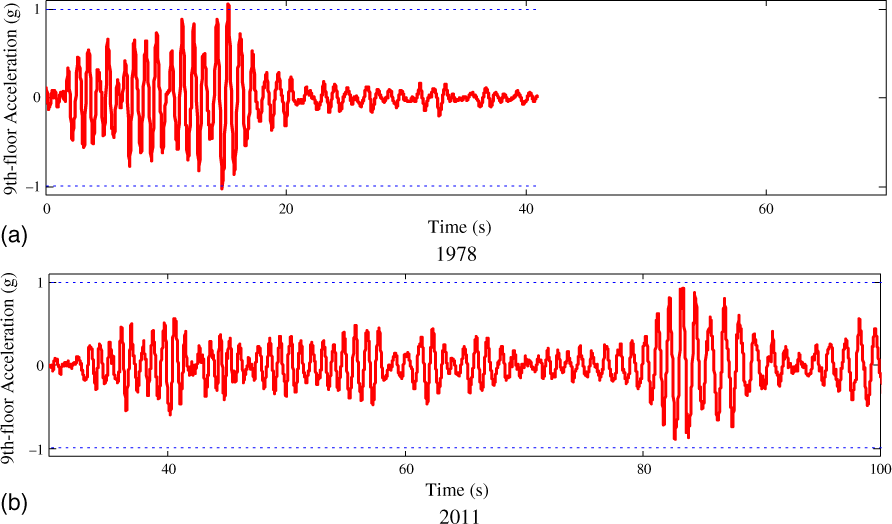
Ninth-floor acceleration records.
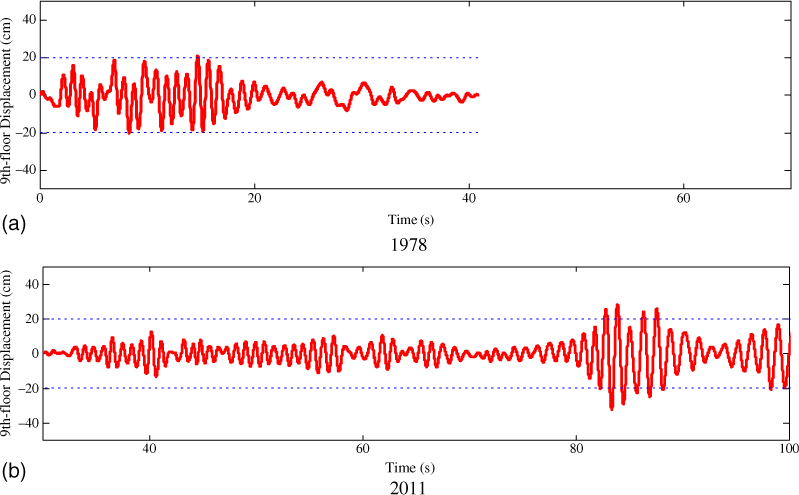
Ninth-floor relative displacement.
The acceleration and relative displacement records are rich with information. Among other things they show that the peak relative displacement in 1978 was approximately 21 cm. They also show that the effective period of the building was approximately 1 s in the same ground motion. This is also true for the initial part of the 2011 record. (Keep in mind that between 1978 and 2011 the building was strengthened and experienced several smaller earthquakes.)
At 82.2 s into the 2011 motion, something occurred to the structure. The 2011 acceleration record reached a plateau (Figure 20), indicating that yielding may have occurred as the displacement reached the maximum displacement reached in 1978 (21 cm). As the building swayed in the other direction, a radical event took place. The acceleration reached another plateau at approximately 82.7 s and soon after decreased abruptly. The acceleration plateau was reached at an estimated displacement of approximately 21 cm. The abrupt acceleration drop occurred at an estimated displacement of nearly 23 cm. We do not claim to have the accuracy to estimate these displacements within 1 cm. We display the unwarranted number of significant figures simply to stress that the observed drop in acceleration occurred at a displacement comparable to the maximum displacement reached in 1978, which confirms what the linear displacement spectra suggested (i.e., that the displacement demands were similar in 1978 and 2011). Additional abrupt drops in acceleration took place at 83.2 s and 83.7 s. From that instant on, the structure had an increased effective period of approximately 1.2 s.
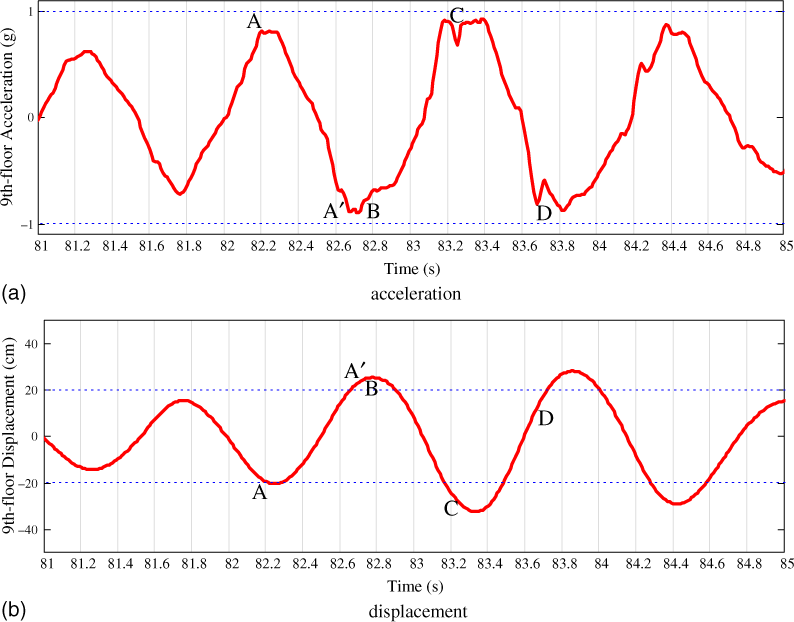
Close-up views of ninth-floor acceleration and relative-displacement histories (2011).
The fluctuations in acceleration can be attributed to (1) the observed fractures in the boundary wall reinforcement and/or (2) the effects of higher modes of vibration. We find Option 1 more likely for the following reasons:
The change in period that took place after the acceleration dropped indicated a large and abrupt change in stiffness that cannot be explained by referring to higher modes. Analyses of MDOFs and the shape of the computed response spectra (which show high amplifications for periods close to 1 s) tell us that the response of the structure was dominated by its first mode.
It is also reasonable to expect the observed fractures to have taken place when peak accelerations were reached (i.e., when the lateral forces peaked).
Notice that before 82 s, the relative displacement computed from the 2011 record did not exceed 10 cm more than three or four times, and never reached 15 cm. This observation suggests that the increase in duration is unlikely to have been the cause of the failure because most of the cycles seem to have taken place well within the linear range of response.
Because the response of the structure was dominated by its first vibration mode, we examine next the relationship between absolute acceleration measured at the ninth floor and the relative displacement estimated for the same level. We do so expecting this relationship to provide us with information about how the stiffness and strength of the structure varied over time.
Absolute Acceleration–Relative Displacement Records
Figures 21 and 22 show absolute acceleration–relative displacement curves estimated based on the records obtained on the ninth and first floors in the N-S (transverse) direction. Interpreting these plots is not simple because they are sensitive to (1) the effects of higher modes and (2) the modifications made to the records to obtain sensible displacement estimates. With these limitations in mind, we do notice in them consistent trends:
Wide hysteretic loops were observed only in the first 15 s of the 1978 motion (Figure 21a). After that instant, the structure responded nearly as an SDOF, showing no clear evidence of stiffness decay or yielding until 82.2 s into the 2011 motion (Figures 21b through 21d). Yielding was first reached at a displacement of 20–21 cm (Points A, A′ in Figure 20, 22a). At 23 cm the first large drop in acceleration (or strength) took place (Point B, Figures 20 and 22a). Two consecutive acceleration drops took place between 83 and 84 s (Points C, D, Figsures 20 and 22b). After these drops, the structure was softer and retained the resulting stiffness for the rest of the motion. The peak acceleration in 1978 was higher than the peak acceleration in 2011, indicating that the strength of the structure may have decreased because of anchor bolt failure.
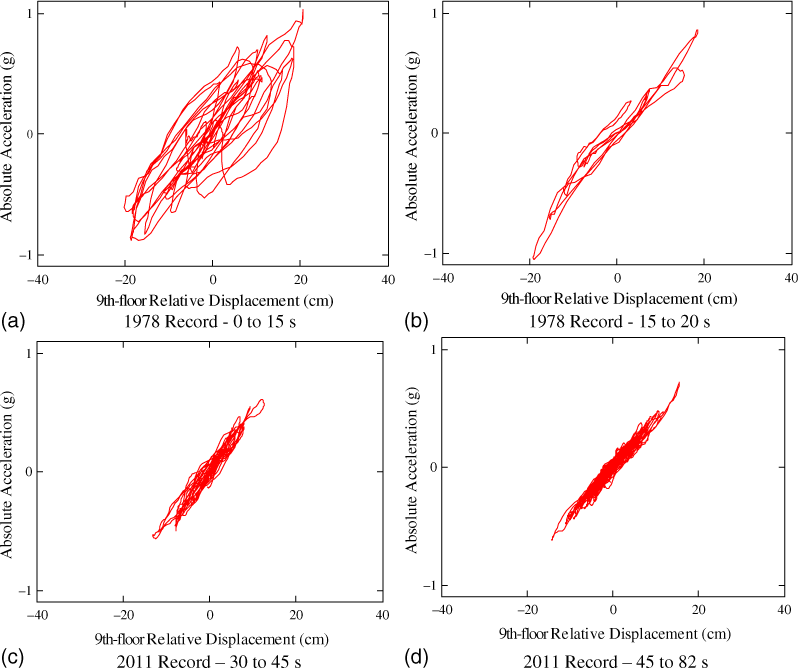
Initial ninth-floor acceleration-displacement response.
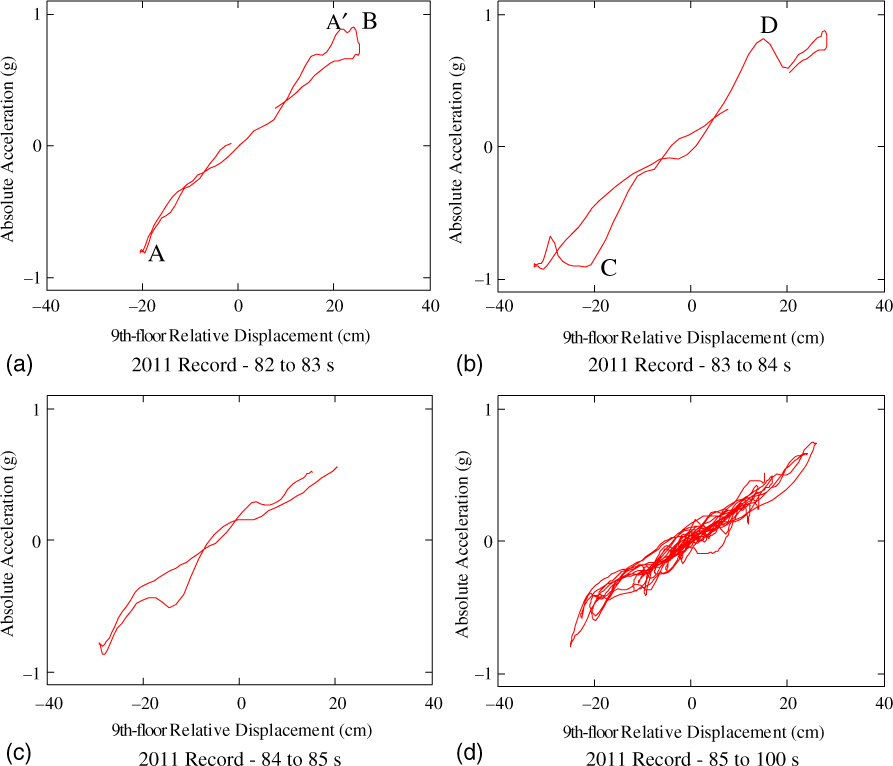
Final ninth-floor acceleration-displacement response.
Synthesis
The bulk of the evidence presented points in a single direction: the column failures of 2011 are likely to have taken place at a displacement similar to the maximum displacement reached in 1978. Despite this inferred similarity, and despite the strengthening done in 2001, the damage caused by the 2011 motion was dramatically different. Therefore, it is reasonable to conclude that the structure was more vulnerable in 2011. The observed damage hints that the source of the vulnerability was the web-beam connections modified in the strengthening of 2001. It is plausible that the discontinuity in the vertical web reinforcement created during the retrofit of the exterior walls led to a weak (essentially unreinforced) plane at the base of the third-story exterior wall webs. Wall deformations seem to have concentrated at this level during the earthquake of 2011. The concentration of deformations must have led to larger unit tensile strains in the reinforcement (Wang 2014). This plausible increase in strain could have resulted in the fractures observed and the higher probability of buckling of longitudinal column reinforcement. If “low-cycle fatigue” problems commenced in 1978, the increased strains must have accelerated them. Had the connection between the reinforcement replaced in 2001 and the rest of the structure not failed, it is likely that the response of the structure in 2011 would have been more similar to the response observed in 1978. Boundary element confinement could also have helped reduce the damage seen in 2011 by restraining buckling. Confinement, nevertheless, would not have helped in preventing the observed tensile fractures.
Conclusions
The available evidence suggests that discontinuities in reinforcement introduced during retrofit work done in 2001 caused the concentration of deformations that led to the wall boundary element failures in the Faculty of Architecture and Engineering Building at Tohoku University during the Tohoku Earthquake of 2011. Reinforcement discontinuities ought to be avoided at critical sections of elements expected to resist lateral forces induced by earthquakes.
Footnotes
Acknowledgments
We are grateful for the support received from the Japan Science Foundation and the U.S. National Science Foundation. We also would like to express our gratitude to Takenaka Corporation, in particular to Dr. H. Kimura, and to all of the engineers who helped inspect the building described here and who provided us with feedback about our interpretations. The insight and guidance provided by Professors A. Shibata and Mete Sozen are invaluable to us. Our work would not have been possible without the generosity of Professor M. Motosaka.
Appendix
Please refer to the online version of this paper to access the figures and tables in the electronic supplement.
References
Supplementary Material
Please find the following supplemental material available below.
For Open Access articles published under a Creative Commons License, all supplemental material carries the same license as the article it is associated with.
For non-Open Access articles published, all supplemental material carries a non-exclusive license, and permission requests for re-use of supplemental material or any part of supplemental material shall be sent directly to the copyright owner as specified in the copyright notice associated with the article.