
Abstract
Conditional spectral dispersion (CSD) is a measure of response spectrum variability that implicitly characterizes the variety of spectral shapes within a suite of ground motions. It is used here to explain the discrepancy between median structural demands estimated from different suites of scaled and spectrum-matched ground motions. Performing response history analyses with spectrum-matched ground motions is known to result in unconservatively biased median demand estimates in some cases. Herein, several suites of scaled ground motions with equivalent median intensities and varying levels of CSD are selected. A single suite of spectrum-matched ground motions is also created. These records are used to analyze the responses of inelastic single-degree-of-freedom and first-mode-dominated multiple-degree-of-freedom structural systems. Collapse capacities are also examined. A consistent trend between CSD and resulting median responses indicates that the bias phenomenon can be fully explained by an asymmetric relationship between conditional spectral ordinates at periods affecting inelastic response.
Introduction
Quantification of the seismic performance of structures is a critical step in the design and analysis of our built environment. Response history analysis (RHA) is a computationally demanding procedure by which engineers can estimate structural seismic performance, its use becoming more prevalent in professional practice as computational power and understanding of both structural behavior and seismology improve. Prior to any assessment utilizing RHA, acceleration time histories (a.k.a. “records” or “ground motions”) resulting from (or attempting to simulate) real earthquakes must be obtained.
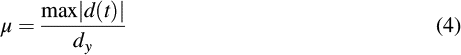
Ground motion selection and modification (GMSM) is the collective field of study in which ground motions are selected from databases contingent on desired seismological characteristics, and are then sometimes modified. A common intensity measure (IM) used to describe ground motions is spectral acceleration, denoted S a (T) at period T. Spectral shape—a measure of the relative amplitudes of spectral ordinates over a range of periods—has been shown to be useful for predicting structural responses, or engineering demand parameters (EDPs), such as interstory drift or ductility (e.g., Iervolino and Cornell 2005, Baker and Cornell 2006). This usefulness leads structural engineers often to require ground motions that have specific spectral shapes for design or analysis purposes (e.g., ASCE 2010, McGuire et al. 2001). However, specific spectral shapes can be difficult to obtain due to limited record databases, especially as additional seismological characteristics are specified.
Spectrum matching is a technique that modifies an acceleration time history such that its response spectrum is changed to provide a desired spectral shape (e.g., Al Atik and Abrahamson 2010), effectively increasing the number of records with specific shape characteristics available to the engineer. It is also used to reduce spectral variability within a suite of ground motions at a range of periods, in turn reducing EDP variability to enable more efficient estimation of median demands (e.g., Hancock et al. 2008). Recent work by Carlson et al. (2016) has quantified the effect of matching on a number of other ground motion characteristics in addition to spectral ordinates.
A principal concern with the use of spectrum-matched records for RHA is that they may provide unconservatively biased response estimates relative to those obtained using comparable scaled ground motions (Carballo and Cornell 2000, Bazzurro and Luco 2006, Iervolino et al. 2010, Huang et al. 2011, Seifried 2013), though not all studies indicate such a bias (Hancock et al. 2008, Heo et al. 2011, Grant and Diaferia 2013). Bias is defined here as a ratio of geometric mean EDPs:
Identification of any bias depends on a number of factors. First, the degree of bias tends to increase with the level of nonlinearity experienced by a system (e.g., Iervolino 2010, Seifried 2013). Second, due to the importance of spectral shape on nonlinear response, it is important to assess the presence of a bias using suites of ground motions with carefully controlled intensities vis-à–vis equivalent spectral shape. Given the importance of spectral shape to system response, if the median shape of each suite is different, it is difficult to separate the effects of spectral shape and the matching procedure on the resulting inelastic structural responses. Third, the variable nature of most EDPs makes it difficult to distinguish between significant differences in response and artifacts resulting from uncertain estimates.
Recent attempts to characterize the nature of the bias for spectrum-matched ground motions have not been able to account for the full magnitude of observed discrepancies. Carballo and Cornell (2000) examine scaled ground motions normalized to a common spectral amplitude at a structure's fundamental period. They note an asymmetric relationship between a simplified measure of spectral shape for a given record and its resulting demand: disproportionately large EDPs were observed for an increase in the shape parameter compared to EDPs observed for an equivalent decrease in the shape parameter, which indicates a skewed conditional distribution of EDP and IM. However, this parameter is insufficient to describe the bias observed for responses to spectrum-matched ground motions relative to scaled or unscaled ground motions. This implies either that a more sufficient measure of spectral shape is required to capture the relationship, or that an additional source also contributes to bias.
It is known that EDPs from a nonlinear structure are correlated with spectral ordinates at “effective” periods longer than the structure's fundamental period (e.g., Iwan 1980). However, this relationship is poorly defined (e.g., Carballo and Cornell 2000, Seifried 2013, Iwan 1980). This work considers a different measure of spectral shape to verify that an asymmetric relationship between IM and EDP is responsible for the bias observed with spectrum-matched records and also confirms that a response bias is not limited to this type of ground motion modification.
Conditional Spectral Dispersion
Conditional spectral dispersion (CSD) is introduced here as the log-standard deviation of spectral ordinates at an effective period, conditional upon the normalization of the ground motion suite to a single spectral value at a structure's fundamental period, S
a
(T1), or:

Herein, effective periods are those at which energy present in ground motions will affect structural response. This includes periods slightly longer than the fundamental period to account for inelastic deformation (“softening”) or those shorter than the fundamental period to account for additional modes that may contribute to EDP levels, where applicable.
CSD explicitly describes the presence or absence of extreme spectral ordinates at a single period, and it also implicitly accounts for the shape of each spectrum because spectral amplitudes at nearby periods are correlated (e.g., Baker and Jayaram 2008). Note also that it describes an entire suite of ground motions as opposed to a single record. Large values of CSD imply that a wide range of spectral shapes and extreme spectral amplitudes are present, while small values of CSD imply that more homogenous spectral shapes and ordinates are present. Therefore, selecting multiple suites of ground motions to have the same median spectrum but varying levels of CSD will measure the impact of these different spectral shapes and spectral amplitudes at effective periods on structural response, on average, without having to account for the effect of different median intensities.
Scope
Carefully selected suites of ground motions, each with the same median response spectrum but different levels of CSD, are used to analyze several inelastic single-degree-of-freedom (SDOF) systems and one inelastic multiple-degree-of-freedom (MDOF) system. For each system, five suites of scaled ground motions are chosen and conditioned on the fundamental period, and one common suite of spectrum-matched ground motions is utilized. Bias among the resulting responses from each suite is then examined, including tests for statistical significance of any observed differences in geometric mean EDP. The collapse capacity of the MDOF system in relation to CSD is also investigated.
Structural Models
Inelastic Sdof Systems
Non-degrading bilinear models have been used extensively in previous research to demonstrate the potential presence of a bias between EDPs obtained from spectrum-matched and scaled ground motions (Carballo and Cornell 2000, Bazzurro and Luco 2006, Iervolino et al. 2010, Huang et al. 2011, Seifried 2013). Their relatively simple behavior is similar to that of more complex systems with EDPs dominated by a single mode, such as the inelastic MDOF model described below.
For an oscillator with elastic period, T
el
, the bilinear model is fully defined by yield displacement, d
y
, post yield stiffness ratio, α, and mass (Figure 1a). Yield displacement is determined here as a fraction of the spectral displacement for a suite of ground motions, or:
(a) Inelastic SDOF backbone curve; (b) schematic of MDOF frame; and (c) schematic moment-rotation behavior of MDOF joints. Note: (c) is from Haselton and Deierlein (2007).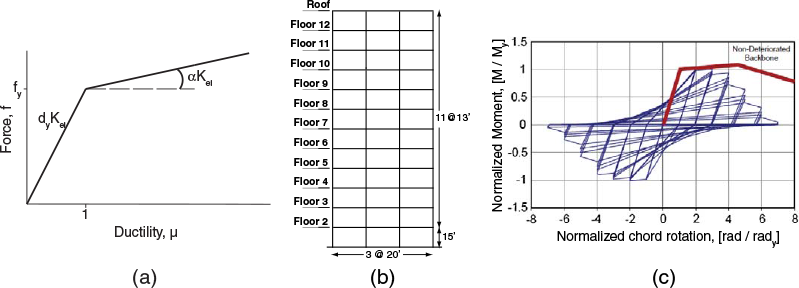

Structures with short or long fundamental periods may be affected differently by various ground motion characteristics, so two representative examples (T el = 0.33 s and T el = 2.0 s) are analyzed. To consider the impact of other structural properties, each of these systems is studied using two levels of post-yield stiffness, α = {0,0.10}, and three levels of strength reduction factor, R = {2,4,6}. Note that a post-yield stiffness of 0.10 is not likely to be encountered in real structural components: a ductility of ten (which is not uncommon with this type of system) will result in a force equal to twice the yield strength. The goal of including this value along with the alternative of zero is to identify potential bias over a broad range of this parameter, as well as because it has been used in other studies (Bazzurro and Luco 2006).
Inelastic Mdof System
The inelastic MDOF system studied here is a two-dimensional model of a 12-story, three-bay reinforced concrete moment frame with its first three modal periods T1 = 2.01, T2 = 0.68, and T3 = 0.39 s (Figure 1b). This structure was modeled in OpenSEES (2009) by Haselton and Deierlein (2007) to conform to modern building codes, taking into account P-Δ effects, strain-softening, and cyclic deterioration behavior (Figure 1c) that are critical for simulating large displacements, element rotations, or collapse.
The EDPs of interest for this system are story drift ratio (SDR), the maximum story displacement divided by story height observed over all stories, and collapse capacity (S a (T1) col ), the S a (T1) value at which the structure achieves dynamic instability during RHA. These parameters both arise often in design recommendations and performance-based assessments (e.g., ASCE 2010, ATC 2012).
Ground Motions
Scaled Ground Motions
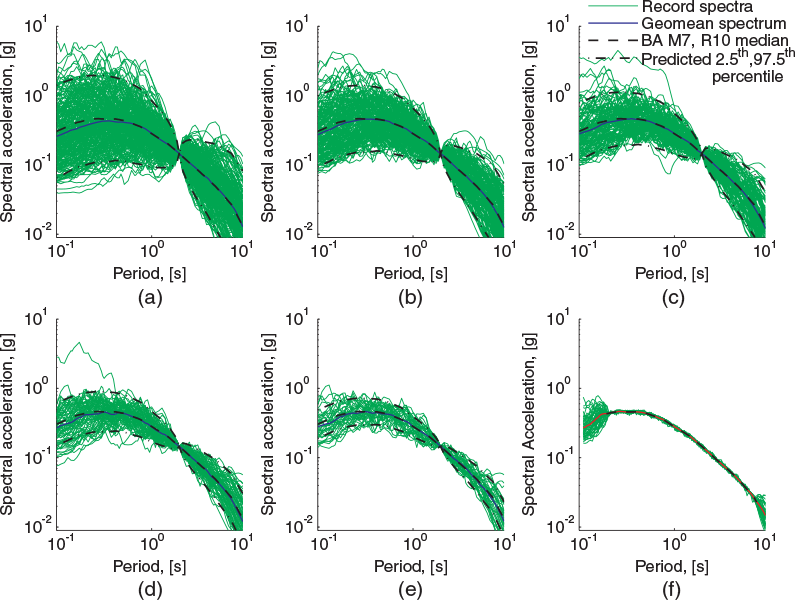
Multiple suites of single-component records are selected to have equivalent median response spectra but varying levels of CSD. Spectral shape is given primary importance in the ground motion selection due to its influence on structural response. For each of the two SDOF systems (with elastic periods of T = 0.33 s and T = 2.0 s), five suites of records are selected using the method of Jayaram et al. (2011), which employs an optimization algorithm to match both a target median spectrum and target spectral variance over a range of periods. The target spectrum and variance are based on a conditional spectrum (CS; Baker and Cornell 2006) consistent with a magnitude M = 7 strike-slip earthquake at distance R = 10 km and site condition VS30 = 250 m/s, as predicted by the Boore and Atkinson (2008) ground motion prediction equation and correlations from Baker and Jayaram (2008), denoted the “BA GMPE.” Ground motions are selected from the NGA database (Chiou et al. 2008), considering only candidate records with M > 6, maximum useable periods of at least 5 s, and scale factors of 10 or less. Other seismological parameters are not explicitly considered, though they will be reflected to some degree by the shape of the target response spectrum. Suites conditioned on S a (T = 0.33 s) are denoted S1 a–e (not shown), while those conditioned on S a (T = 2.0 s) are denoted S2 a–e and illustrated in Figures 2a–e. The conditional dispersion used as a target for selection in suites SX a through SX e is set using factors of 1.2, 1.0, 0.8, 0.6, and 0.4, respectively, applied to the BA GMPE prediction.
Ground motion suites conditioned at T = 2.0 s and based on a CS with
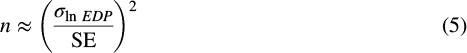
One of the goals of this analysis is to determine whether any observed difference in median response between suites of ground motions is statistically significant using a one-sided t-test. Given the variability of EDPs and the degree of differences observed below, many ground motions are required to achieve this. Note in the analysis below that as CSD is reduced, the dispersion of EDP is also reduced. The number of ground motions in each suite is set to provide roughly equivalent standard errors (SE) of the resulting median demand according to:
The large number of records included in the selected suites precludes more rigorous filtering criteria. The tradeoff with applying additional seismological characteristic restrictions is that it becomes increasingly difficult to achieve the target median spectrum and variance, especially as the target variance decreases. Figure 2 demonstrates that adherence to target values is less ideal at very short periods, but energy at these periods is inconsequential to the SDOF analysis, and is expected to have minimal contribution to SDR and collapse capacity for the MDOF analysis.
The selected suites are not fully independent of one another in that records are allowed to appear in multiple suites. This is another tradeoff between the number of records in each suite and fit to the target spectrum. However, because of the large number of records, and because the records are randomly selected after relatively few characteristic filters, a systematic bias due to duration, directivity, magnitude, etc., is not expected to influence the results of this analysis.
Spectrum-Matched Ground Motions
A single suite of spectrum-matched ground motions is created to analyze each structure. Twenty-five seed records with a good initial fit to the target spectrum between periods of 0.1 s and 10 s are selected, considering only NGA database records with magnitudes between M = 6.5 and M = 7.5, distances less than or equal to 60 km, and maximum useable periods of at least 5 s. The time domain spectrum matching procedure of RSPMatch2009 (Al Atik and Abrahamson 2010) is used to match each record to the same M = 7, R = 10 km, VS30 = 250 m/s BA GMPE median spectrum from the selection process above. Spectra are matched at 75 evenly log-spaced periods from 0.18 s to 8 s. The procedure is applied in four iterations using the improved tapered cosine wavelet (Al Atik and Abrahamson 2010) in progressively wider period bands. Each resulting time series is checked to ensure that it has realistic time domain properties and energy distribution. The resulting suite is denoted M1 and illustrated in Figure 2f.
Csd in Each Suite
CSD is calculated for each suite at a single T eff using Equation 2. The absolute values of CSD in Figure 3 depend on the choice of T eff , which is 2.5T el . However, spectral variability in each suite of ground motions is controlled for a range of periods in the record selection process, so relative values of CSD among the suites will not change if T eff is selected as some other value. Therefore, any trends in the analysis to follow do not depend on the specific value of T eff as long as it is in the range of periods controlled by the selection process. Also, due to tolerances in the matching procedure, CSD for the spectrum-matched suite is not exactly equal to zero, as it would be if all spectral ordinates were identical at T eff .
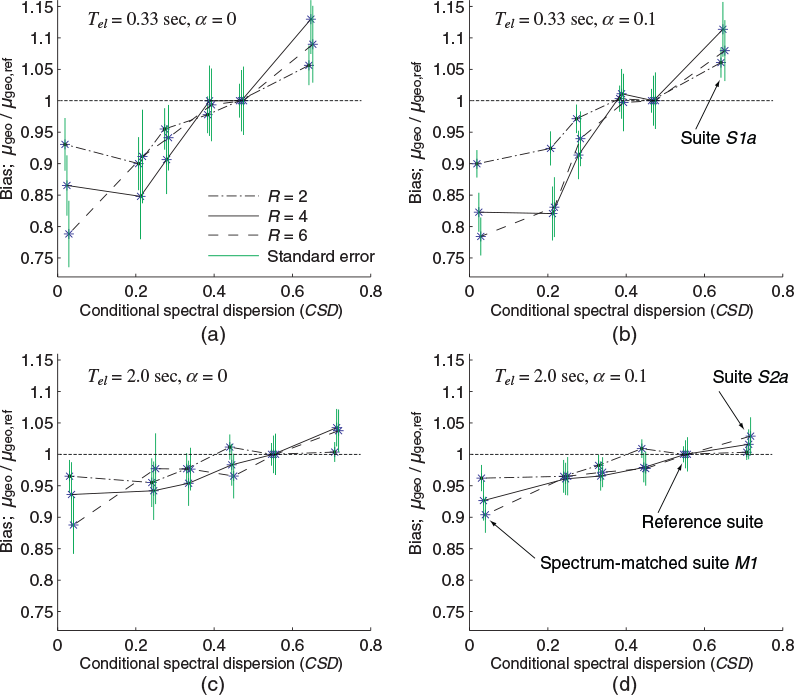
Bias in estimated ductility versus conditional spectral dispersion (CSD) for each inelastic SDOF system. CSD is evaluated by Equation 2 at T eff = 2.5Tel.
Analysis
Inealstic Sdof Systems
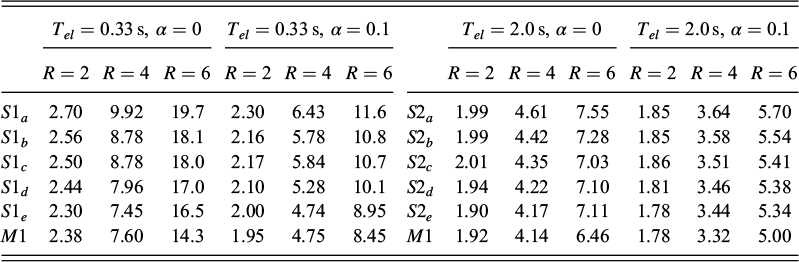
Suites S1 a–e , S2 a–e , and M1 are used to analyze the inelastic SDOF systems at each combination of T el , α, and R. Bias of μ is calculated using suites S1 b and S2 b as the reference suites in Equation 1 for T el = 0.33 s and T el = 2.0 s, respectively, because they correspond to the unmodified CS obtained from the BA GMPE. Bias and standard errors are shown in Figure 3, where suites S1 a and S2 a , which have the largest CSD, are on the right of each subfigure, and suite M1, which has the smallest CSD, is on the left of each subfigure. Geometric mean ductility (μgeo) and bias for each suite are provided in Tables 1 and 2, respectively. Bias is equal to 1.0 for suites S1 b and S2 b because the numerator and denominator of Equation 1 are from the same suite. The apparent slight offset in absolute values of CSD among each R value for an individual suite is artificially introduced to allow the standard error bars to be differentiated.
Geometric mean μ from inelastic SDOF analysis
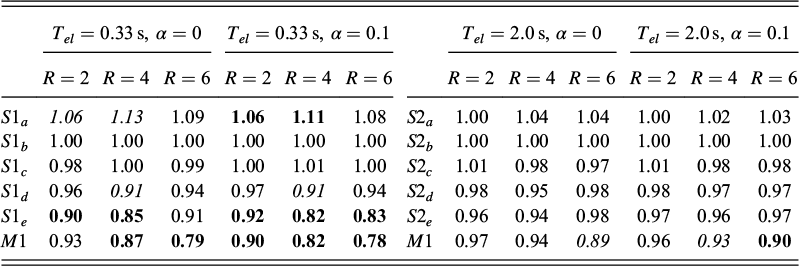
SDOF ductility bias, relative to suites S1 b and S2 b . Bold values are statistically significant to a level of 0.05 using a one-sided t-test. Italicized values are statistically significant to a level of 0.10.
In general, the four plots in Figure 3 display a consistent trend between bias and CSD over all combinations of parameters, though the degree of bias varies. Bias tends to be closest to 1.0 when R = 2 and deviates further from 1.0 as R increases. This agrees with previous research (e.g., Luco and Bazzurro 2006, Seifried 2013), though it is not as clear here. Bias also appears to depend on the elastic period of the system, but is less influenced by α. Additionally, the trend among responses from the scaled suites aligns with the bias observed for the spectrum-matched suite.
Note that even though many ground motions are used, some variation in the trend from Figure 3 is expected due to the limited sample size. Tests for statistical significance are performed to indicate whether the trend is meaningful given these variations. Bias tends to be statistically significant for responses to ground motion suites at opposite extremes of CSD, and this significance is stronger for the system with the shorter T el .
As mentioned above, this type of model has been used in other research to analyze whether a response bias exists for spectrum matched ground motions relative to scaled motions. While the bias approaches 0.8–0.9 for some cases, the level of ductility experienced by some of these models, as well as the associated peak post-yield force when α = 0.1, is sometimes unrealistic (e.g., μ ≈ 15 – 20 for T el = 0.33 s and R = 6). Therefore, these models should be viewed through the context of those studies. Results presented here demonstrate that a consistent bias is present with spectrum matched ground motions. Figure 3 suggests that the cause of this bias is related to the CSD of a suite of records.
The asymmetry in responses noted by Carballo and Cornell (2000) and Seifried (2013) is illustrated by the nonlinear relationship shown in Figure 4. Ground motions with larger conditional S a (T eff ) tend to produce ductilities disproportionately larger than those with smaller conditional S a (T eff ), which is emphasized by the regression line included in each subfigure. Therefore, a greater value of CSD encompasses a greater range of the nonlinearity between IM and EDP, which in turn results in a greater median ductility. In reality, S a at more than a single period longer than T el will influence the peak response of the SDOF systems, so Figure 4 is a simplified representation of the relationship between response and spectral shape, but it offers insight into why a trend is observed for geometric mean response as CSD changes. The figure also suggests that either μ or S a (T eff ) are not strictly distributed lognormally.
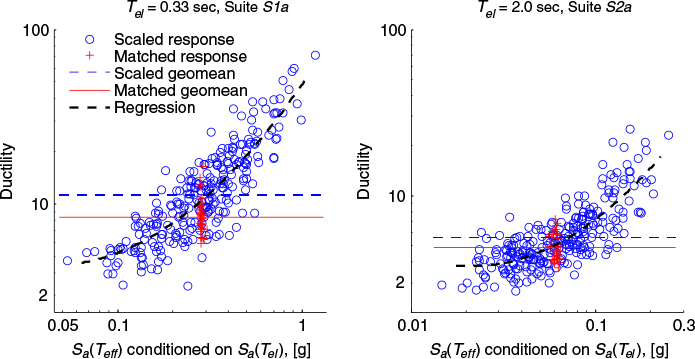
Responses from SDOF systems versus conditional spectral ordinates. R = 6 and α = 0.1 for the system in each subfigure. T eff is 2.5 times longer than T el in each case.
The subtle nature of the bias observed between suites of scaled ground motions with similar levels of CSD offers an explanation for why this phenomenon has gone mostly unnoticed: even with large, carefully selected suites of ground motions, statistical significance is difficult to ascertain. However, even though the greatest degree of bias and strongest statistical significance is observed at extreme ductilities experienced by systems with extreme structural properties (α = 0.1), bias is still generally present in all analysis cases.
Inelastic Mdof System
The 12-story MDOF model analyzed here is designed such that the median-level intensities of suites S2 a–e do not impose significant inelastic deformations. Therefore, suites M1 and S2 a–e are scaled up by a factor of 1.5 (and denoted as M1* and S2 a–e *) to achieve a higher degree of inelastic behavior. Recall that each of these scaled suites is conditioned on a period of 2.0 s, which approximately equals the fundamental period of the 12-story model. Although the rescaled intensity level is no longer associated with the BA GMPE scenario described above, the ground motion suites still all have consistent median spectra and so serve to evaluate relative structural responses. The rescaled ground motions result in some collapses for the two most variable suites of scaled ground motions (see Table 3). When a ground motion causes collapse, that realization of SDR is set to the peak observed level of SDR from the remaining ground motions in the suite that did not cause collapse. This enables the median to continue to be estimated as the geometric mean without ignoring collapse cases, and also allows estimation of standard error.
Summary of structural response results from inelastic MDOF analysis. Bold values are statistically significant to a level of 0.05 using a one-sided t-test. Italicized values are statistically significant to a level of 0.10.

Bias for SDR is calculated relative to suite S2 b * using Equation 1 and plotted versus CSD in Figure 5. Summary statistics are provided in Table 3. As with the SDOF analysis, a trend is observed between bias and CSD among responses from scaled ground motions that is consistent with responses from spectrum-matched ground motions. In Table 3, a reduction in dispersion of SDR (σln SDR)as CSD decreases is evident. Statistical significance for the bias is also indicated in Table 3.
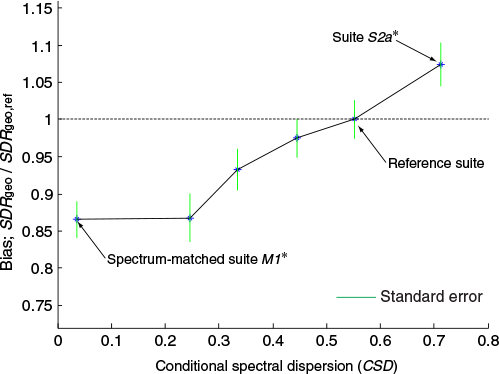
Bias versus CSD for the 12-story MDOF system. CSD is evaluated by Equation 2 at T eff = 2.5T el .
Collapse Capacity of Mdof System
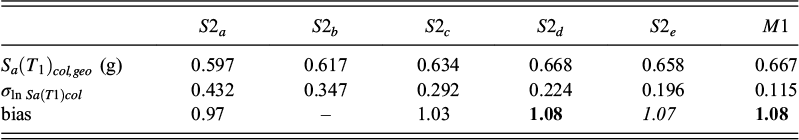
The 12-story MDOF is investigated for the effects of CSD on S a (T1) col using suites M1 and S2 a–e . Incremental dynamic analysis (IDA; Vamvatsikos and Cornell, 2002) is performed and the resulting collapse-level spectral intensities at the fundamental period of the structure are recorded. Summary statistics of these values for each suite is reported in Table 4. Bias is calculated relative to suite S2 b using Equation 1 and plotted versus CSD in Figure 6. As with each analysis above, a trend is observed between bias and CSD among responses from scaled ground motions that is consistent with responses from spectrum-matched ground motions. Also similar to the above analyses, there is some degree of variation in the trend. Note that in this case a bias greater than 1.0 implies that on average the ground motions reach greater intensities before causing collapse (i.e., a bias >1 is unconservative in this case). In Table 4, the reduction in dispersion of S a (T1) col as CSD decreases is evident. Statistical significance for the bias is also indicated in Table 4.
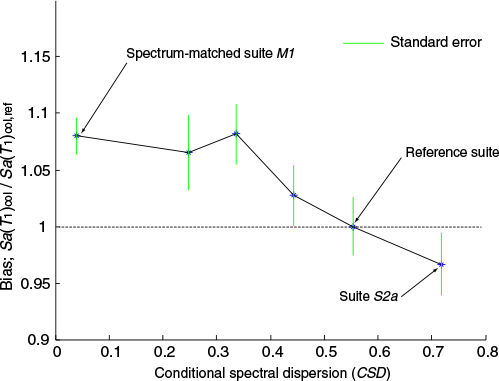
Bias versus CSD for the 12-story MDOF system. CSD is evaluated by Equation 2 at T eff = 2.5T el .
Summary of collapse capacity estimated from IDA performed with the MDOF system. Bold values are statistically significant to a level of 0.05 using a one-sided t-test. Italicized values are statistically significant to a level of 0.10.
This analysis of S a (T1) col expands the observation of a response bias related to CSD beyond the peak-oriented EDPs of μ and SDR to a cumulative damage measure. These results support the intuition that if SDR is reduced by decreasing CSD, on average, then collapse will also be delayed by decreasing CSD, on average.
Conclusions
The effect of CSD on structural responses is investigated. A number of structural models are analyzed using five suites of scaled ground motions with equivalent median intensities and different levels of CSD at a range of effective periods, as well as one suite of spectrum-matched ground motions. For all models and EDPs studied, a similar trend is observed between bias and CSD among the scaled suites that is consistent with the bias present for the spectrum-matched suite. CSD completely accounts for the observed bias, which reinforces that an asymmetric relationship between EDP and IM is responsible for it.
The presented results agree with the bias reported for spectrum-matched ground motions in previous research: a bias is present, consistently unconservative, and tends to increase with ductility. This research builds on previous work by demonstrating statistical significance of the bias, expanding results to a cumulative damage measure, and revealing an underlying trend with the spectral variability of scaled ground motions. This trend is often subtle, which offers a possible explanation for why it has not explicitly been noted previously. There also appears to be some dependence on structural properties, which may contribute to the variation in conclusions from other research.
Due to the dependence of the investigated bias on structural model characteristics and EDP, this work does not show the bias to be systematic or predictable based on CSD alone. This implies that a generic correction factor based on CSD to counteract any bias, while ideal for practitioners, may not be appropriate. However, the viability of such factors based on additional structural characteristics is not precluded here. Short of a solution of that type, the median response level of a particular EDP for a particular structural system at a target CSD value could be estimated through the analysis of multiple suites of ground motions. It is also worth noting that not all combinations of model and EDP are guaranteed to result in a bias.
There are two main implications of these findings. First, the process of spectrum matching itself is not responsible for the observed bias between EDPs resulting from scaled and spectrum-matched ground motions. Second, efficient GMSM techniques should consider the demonstrated effect of conditional spectral variability on the central tendency of response, especially procedures that seek to minimize spectral variability. Current ground motion selection practice assumes that reducing spectral variability serves to reduce EDP variability without introducing bias, but the above results indicate that this is incorrect.
Note also that bias is computed above with respect to geometric mean EDP, while design standards often consider arithmetic means. The arithmetic mean is larger than the geometric mean of lognormally distributed data, and the difference between these two measures increases as variability increases. This implies that if bias were computed using the arithmetic mean of responses from scaled ground motions that retain CSD and from spectrum matched ground motions that remove CSD, it may be even greater than the results presented here.
These conclusions are subject to a number of limitations. First, the structural models and EDPs considered are representative of single-mode-dominated systems with moderate fundamental periods. Second, the ground motions that were used have been coarsely filtered and do not explicitly consider some effects known to be important to structural response (e.g., duration or directivity), though they are accounted for to some extent through spectral shape, and the large number of considered records should avoid undue influence of these characteristics. Finally, this analysis only considers spectrum matching in the time-domain, although other procedures are available. However, if additional models, EDPs, ground motion properties, or matching techniques are desired to be studied in future research, a framework has been established here to aid that work.
Footnotes
Acknowledgments
We thank Curt Haselton for providing the MDOF structural model and Peter Stafford for constructive comments that improved the manuscript. This work was supported in part by the National Science Foundation under NSF grant number CMMI 0726684. Any opinions, findings and conclusions or recommendations expressed in this material are those of the authors and do not necessarily reflect the views of the National Science Foundation. We also thank the Shah Family Fellowship and John A. Blume Fellowship for providing additional financial support for this work.