
Abstract
This paper presents a probabilistic methodology for the prediction of post-earthquake community recovery over time, based on a set of socioeconomic resilience parameters and a post-earthquake damage indicator. Pre-existing socioeconomic conditions are widely associated with the ability of a community to recover following an earthquake and, therefore, should be considered in a recovery prediction model. The city of Napa, California and the monitored recovery from the 2014 South Napa earthquake were used as a case study for the development and validation of the proposed methodology. The documentation of the recovery, which is herein associated with the recovery of the building stock, was accomplished via field surveys over a period of 18 months following the event. In addition to community-level recovery predictions in different areas over time, the methodology allows for the identification of the pre-existing socioeconomic parameters that most significantly affect the recovery trajectory. Thus, emergency managers can identify critical areas that take longer to recover, as well as identify strengths and weaknesses of their communities and respectively promote or address issues that facilitate recovery.
INTRODUCTION
Various authors have established that recovery from adverse hazard impacts, such as those caused by earthquakes, depends not only on the extent of the physical damage of the built environment but also on the resilience level of the affected communities (e.g., Burton 2014, Cutter et al. 2014). Resilience is herein defined as the ability of social systems to prepare for, respond to, and recover from damaging events (Cutter et al. 2008b). This definition includes inherent conditions that allow communities to learn, prepare, plan for, absorb, recover from, and more successfully adapt to actual or potential hazard impacts in a timely and efficient manner (Cutter et al. 2014). The resilience of communities has been widely investigated and qualitatively associated with socioeconomic parameters (i.e., indicators, Burton 2014). Despite the existence of several studies demonstrating that disaster recovery is intrinsically linked with resilience conditions, these efforts have failed to use real-world applications to provide a quantitative relationship between the two concepts. In addition, there is a limited number of long-term recovery studies and post-disaster surveys within the literature. This significantly narrows the extent to which resilience indicators may be used to quantitatively predict community disaster recovery over time in a robust and scientifically valid way.
In order to overcome these limitations, this paper presents a probabilistic recovery-modeling framework that provides predictions of post-earthquake community recovery at different time periods based on a set of socioeconomic parameters, as well as an indicator that implicitly accounts for the level of seismic-induced damage (modified Mercalli intensity [MMI] scale). The model is able to quantitatively relate resilience indicators with community recovery, rather than solely providing a qualitative relationship between the two (as in virtually all the cases in the literature). The methodology was developed and validated using data on building recovery of the city of Napa, California, following the 2014 South Napa earthquake, which was collected via field surveys conducted over a period of 18 months, at six-month intervals following the event.
The paper is organized as follows. First, the study area is presented and investigated in terms of the evolution of recovery after the 2014 South Napa earthquake. Subsequently, proxy indicators of resilience were compiled by collecting variables that are able to capture the pre-existing community's conditions, focusing on the social, economic, institutional, and infrastructural sectors of the area of interest. The final sections present the proposed methodology for linking the aforementioned concepts—recovery and resilience—through a probabilistic approach.
STUDY AREA AND 2014 SOUTH NAPA EARTHQUAKE
The city of Napa is the largest city in Napa County, which is located northeast of San Pablo Bay in the Greater San Francisco Bay Area of California (Figure 1). According to the one-year estimates of the 2014 American Community Survey, the city of Napa was home to approximately 78,000 people at the time. On 24 August 2014, a Mw 6.0 earthquake with an epicenter located approximately 9 km south-southwest of Napa hit the region at 3:20 a.m. local time. Two people died and 300 people reported injuries as a result of the earthquake or subsequent clean-up activities (Johnson and Mahin 2016). Despite a relatively modest intensity, the event caused significant ground shaking and damage, particularly in the city of Napa. According to various sources, total losses are estimated to range between U.S. $443 million and U.S. $800 million, involving thousands of properties (Huffman 2015).
City of Napa, key surrounding features, and the borders of the five main cities within the county.
METHODOLOGY
POST-EARTHQUAKE RECOVERY ASSESSMENT
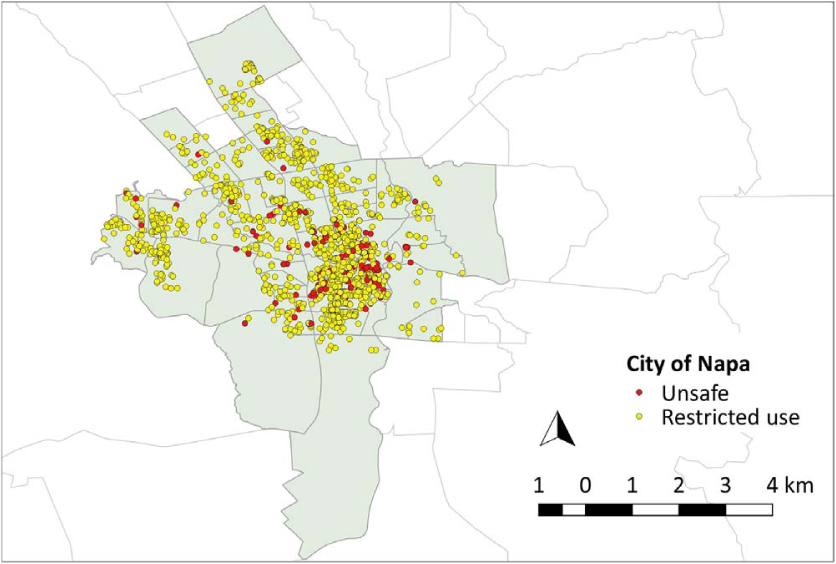
In the aftermath of the Napa earthquake, city officials implemented a rapid structural assessment program throughout the city with the assistance of structural engineers who volunteered from various areas across California. These building damage observations, which were mainly concentrated in the city of Napa, were geocoded and made available via a web geographic information system (GIS) by the city of Napa and included: (a) the location of the damaged structures across the city by address; (b) ancillary information, such as the buildings' construction material, and occupancy type; (c) color-tagging information: red or yellow (ATC 2005); and (c) the associated building damage description. This website is no longer publically available, yet a brief description of the platform can be found in Pratt (2015). At the time of this research, city officials assessed 1,462 buildings, 146 of which were red-tagged with the remaining ones being yellow-tagged (Figure 2a).
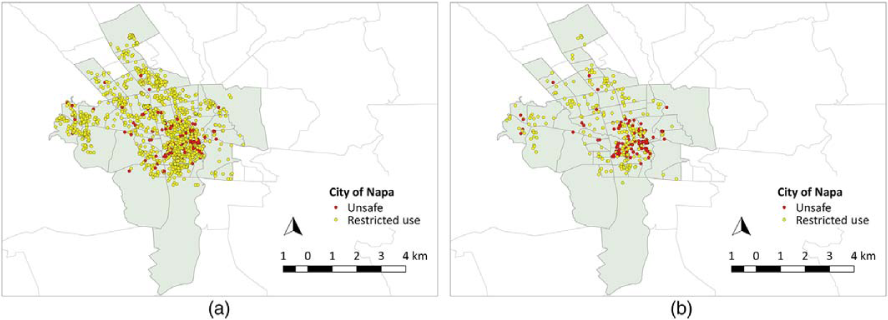
(a) Total initial red and yellow-tagged buildings across the city of Napa (zoom in the city) and (b) the 356 red and yellow-tagged buildings that we monitored over time.
In order to monitor and quantify the recovery over time in the city of Napa, we conducted a building-by-building detailed inspection via three separate field surveys at six-month intervals following the earthquake (February 2015, August 2015, and March 2016). Due to time constrains, it was not feasible to survey all the 1,462 buildings initially identified by the city officials. Thus, 400 structures were selected for inspection, which was considered a realistic goal to achieve within our available time frame. These 400 buildings included all the red-tagged structures identified in the post-earthquake assessment performed by the city officials (146 in total), as well as a sample of 254 yellow-tagged structures selected at random in order not to introduce an observation bias with respect to the actual damage distribution. Following the first field visit to each of the 400 buildings in February 2015, buildings inaccessible for visual surveying, or those tagged due to adjacency to unsafe structures, were excluded from the subsequent recovery evaluation process. As a result, 356 buildings were finally considered for recovery monitoring, with 102 being red-tagged and 254 being yellow-tagged (Figure 2b). According to the HAZUS building typologies (FEMA 2016), most of these buildings (~74%) are wood-framed structures designed to moderate code seismic standards and nearly 10% are high-code wood-framed structures. Unreinforced low-rise masonry buildings without seismic design (pre-code) together with reinforced low-rise masonry buildings account for almost 6% of the total sample. It can be observed that almost all the pre-code structures sustained significant damage and were assigned a red tag.
During the field surveys, each building was assigned a binary code (0 or 1) defining the stage of recovery, based on an exterior visual inspection. In this framework, 0 represents a “No Recovery” stage (no retrofit and/or rebuild operations with respect to the immediate post-earthquake condition); and 1 is associated with the building's “Full Recovery” (building fully repaired/reconstructed and reoccupied). It is important to note that this method captures only exterior recovery evidence, as the interior access to the residences was not possible. We acknowledge that some structures may have suffered interior damages that may not be easily identified this way. However, as previously discussed, a general description of the initial damage of yellow- and red-tagged buildings (including interior damage) was made available. Thus if a building was still tagged yellow or red at the time of our field surveys, it was possible to infer that the initial interior damage had not been repaired. In addition, and when possible, we talked to several homeowners during the surveys, which helped to further clarify the recovery stage of the structures. As such, although the interior access was not possible, a suitable documentation of the progress of the recovery was accomplished. For illustration purposes, Figure 3 presents an example of the recovery progress of a building in the city of Napa over a period of 18 months. Figure 3a corresponds to the first inspection, Figure 3b shows the recovery stage at the time of the second survey, and Figure 3c refers to the recovery stage at the time of the third field survey.
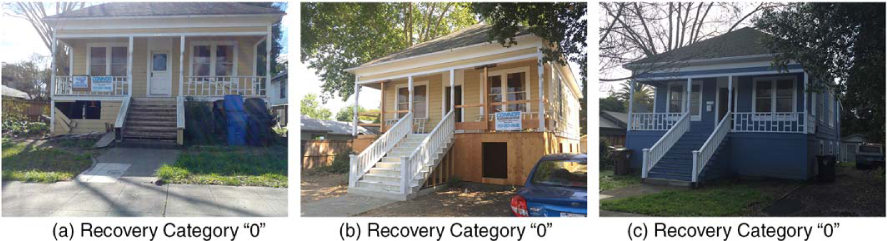
Examples of the recovery progress of a building in the city of Napa after (a) 6, (b) 12, and (c) 18 months following the earthquake.
Based on our first inspection, 179 of the 356 evaluated buildings were fully recovered within six months following the earthquake; 154 of which were initially yellow-tagged and the remaining 25 being red-tagged. One year after the earthquake, the structures previously classified as fully recovered were excluded from the evaluation, and the remaining buildings were reevaluated in order to define an updated recovery category based on their reconstruction progress. In all, 177 buildings were revisited, and the recovery stage of 36 additional buildings evolved from category “0” to “1”, with equal proportion between yellow- and red-tagged structures. Finally, during the third survey and 18 months after the earthquake, the remaining 141 buildings still not recovered were revisited and 55 of these were verified to be fully recovered at the time. Out of this sample of 55 buildings, 39 were yellow-tagged and 16 were red-tagged after the earthquake. In sum, almost 83% of the yellow-tagged buildings of our sample were fully recovered after 18 months (~60% within the first six months). On the other hand, nearly 50% of the red-tagged buildings were still not recovered at the end of our surveys.
COMMUNITY RESILIENCE MEASUREMENT
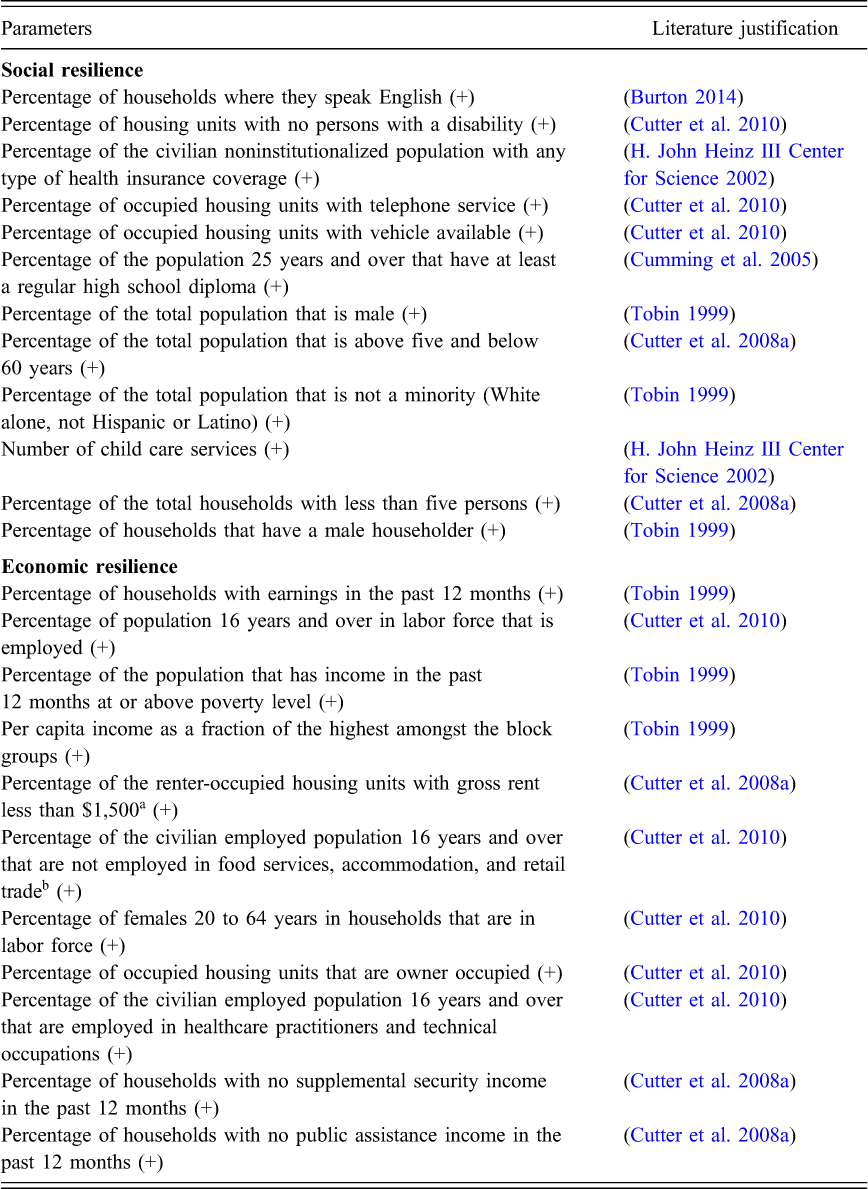
In order to quantify the pre-existing level of resilience within the city of Napa, a set of 55 proxy resilience parameters were collected based on two criteria: (a) they must be retrievable from publically available data sources; and (b) they must be relevant to the subject matter, based on citations within the existing resilience and/or recovery literature. In this paper, the conceptual approach developed by Cutter et al. (2010) (referred to as Disaster Resilience of Place model or, simply, DROP) was used as a benchmark for the variable collection procedure. The DROP model explicitly focuses on antecedent conditions, event characteristics, and the capacities of communities to absorb the impacts and recover from a disaster. Antecedent conditions refer to the pre-existing characteristics within communities that create the potential for loss, but also allow populations to mitigate, cope, and recover from impacts when they occur. The selected variables are intended to be suitable for the assessment of the level of resilience of various community sectors (Table 1), namely: social, economic, infrastructure, community capital, 1 and institutional, as thoroughly described by Cutter et al. (2010) and Burton (2014).
List of potential parameters representing pre-existing disaster resilience in the city of Napa (“+” represents a positive effect on resilience, whereas “−” is associated with the opposite trend)
(continued)
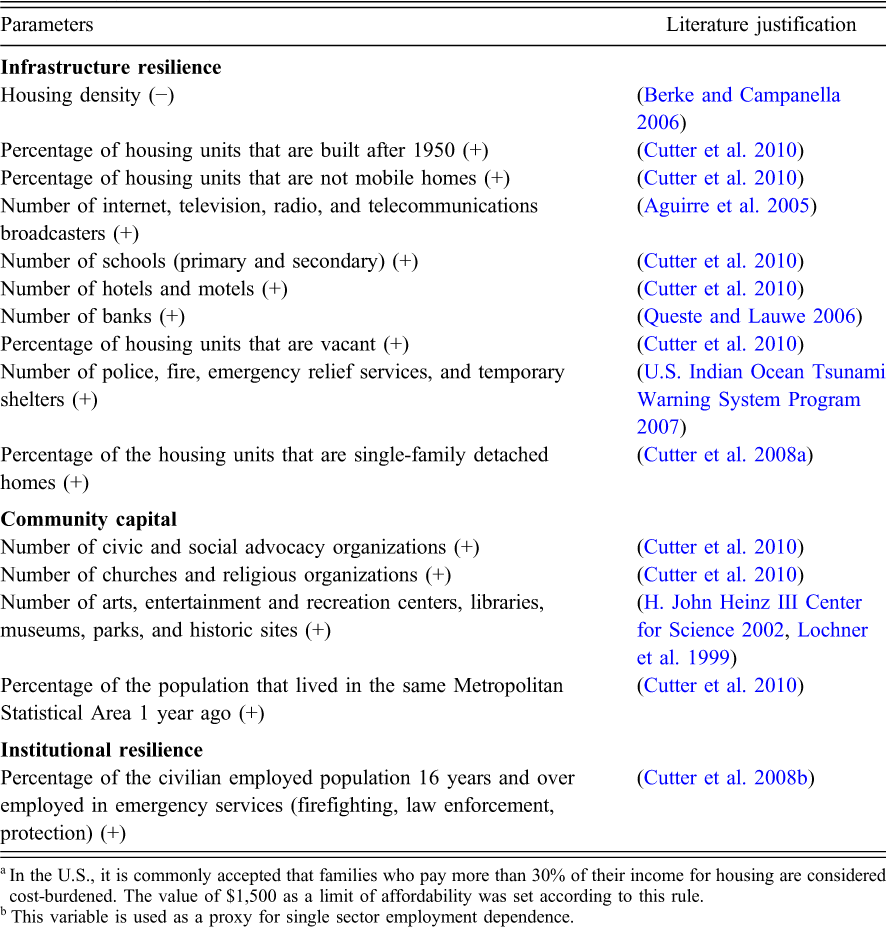
Following the data collection, all the raw values were converted into comparable indicators (i.e., percentages or ratios). Then, the data was evaluated in terms of their correlations, using the Spearman's Rank correlation coefficient (ρ) in order to define a set that was sufficient and appropriate to describe the resilience phenomenon from a theoretical and statistical perspective. As a result, in cases where the pair's correlation ρ was ≥0.80, one of the two variables were subjectively eliminated from further use based on the author's expert opinion; resulting in a final set of 38 indicators (Table 1). Alternative methods, such as factor analysis or principal component analysis could be additionally used to further investigate the correlations and reduce our dataset. These methods can potentially allow for a more refined evaluation of correlation between variables. However, our objective was to “remove” only the variables that were expected to be correlated in any possible application and keep others that, although being correlated in this study, might not be in other regions.
This analysis was conducted at the census block group level of geography (subdivisions that can be seen in Figure 2), as defined by the U.S. Census Bureau, which provides a relevant proxy for neighborhoods within an area (Burton 2014). The five-year estimates provided by the 2013 American Community Survey (ACS) were the primary source of statistical data pertaining to the 38 selected variables. However, variables referring to number of schools, child care services, hotels or motels, banks, civic and social advocacy organizations, churches and arts, and recreation centers were collected from additional publicly available sources such as Google (2005) and the Napa Valley Coalition of Non-profit Agencies (1995). Table 1 presents the final set of the proxy parameters selected to characterize the pre-existing disaster resilience of the assessed region.
LINKING RECOVERY PROGRESS AND COMMUNITY RESILIENCE
Following the analysis of recovery over time and the assessment of pre-existing community resilience, the objective is to establish a quantitative relationship between the two. Methods such as multivariate linear regression can be used to describe the relationship between some outcome one is interested in predicting (in this case, the recovery progress), and a set of explanatory (independent) variables known to influence that outcome (in this application, the resilience parameters presented in the previous section). However, when the dependent variable is dichotomous—consisting of two possible values (such as 0 and 1 in the present case)—a multivariate logistic regression model is more appropriate (Hosmer and Lemeshow 2000). In addition to being amenable to the use of binary data, we chose a multivariate logistic regression model because it provides estimates of the probability of a binary outcome, such as the probability of moving from the no recovery stage to a full recovery. According to the logistic model, if x
1, …, x
n
are the independent variables and Y is the dependent one, the probability of occurrence of the outcome of interest is computed as:

In the present case, the 38 resilience indicators presented in Table 1 constitute the independent variables of the logistic model and P(Y = 1) represents the probability of a given building (in a certain block group) being fully recovered. As previously discussed, these variables were used as proxies to represent the level of resilience of the studied region, as they have been previously demonstrated to influence the capacity of a community to recover from an earthquake event (e.g., Cutter et al. 2010). However, if two particular block groups with similar resilience conditions are considered, their recovery trajectory may mostly depend on the corresponding extent of the initially observed damage. As a result, these 38 parameters were complemented with an indicator that is able to implicitly account for the level of seismic-induced damage at a given location. The median MMI (Wood and Newmann 1931) observed in each block group at the time of the 2014 South Napa earthquake was considered as a measure of seismic-induced damage, constituting a 39th independent variable. The distribution of MMI is readily available and was acquired from the United States Geological Survey (USGS) ShakeMap platform (USGS 2015) at a spatial resolution of 30 arc seconds. One might argue that less subjective parameters such as peak ground acceleration (PGA) or spectral ordinates would be a more suitable alternative to MMI. However, these are intrinsically related with the observed ground motion properties and do not necessarily correlate well with the induced damage (Sousa et al. 2016).
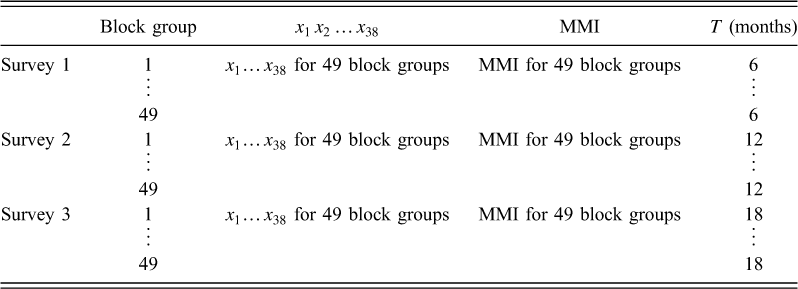
In addition, because the temporal evolution of recovery was also of interest, an independent variable representing the time (T) was included, assuming values of 6, 12, and 18 months, as presented in Table 2.
Organization of considered independent variables for each of the 49 block groups of the city of Napa for which recovery data has been collected
MODEL REGRESSION
As presented in Table 2, a specific value of each variable was assigned to each block group, at each time T. Subsequently, each block group was assigned a recovery stage (0 or 1) based on the recovery stage of the buildings assessed in that same block. More specifically, a simulation procedure was devised and for each of a total of 1,000 simulations, a single building was selected at random from the structures assessed in each block group. For each of the 1,000 simulations, the recovery stage (0 or 1) of the randomly selected building was attributed to the respective block group.
For each simulation (S), the recovery outcomes randomly selected for each block group were used in the regression of a multivariate logistic model, as a function of the 40 block group variables. As a result, rather than a single value of P(Y = 1), it was possible to obtain 1,000 possible probabilities of recovery for each block group at each time T. Thus, both the mean predicted values of P(Y = 1) and associated uncertainty can be calculated for each block group. An example of these results is presented in Figure 4, where the mean, as well as the lower (16% percentile) and upper (84% percentile) bound predicted recovery probabilities, were mapped for each block group six months after the earthquake (similar graphs can be produced at any time after the event, even after the time of our last field survey). Figure 4 highlights the fact that it is possible to communicate the uncertain nature of the recovery process in a simple yet meaningful way, allowing decision and policy makers to plan for various scenarios.
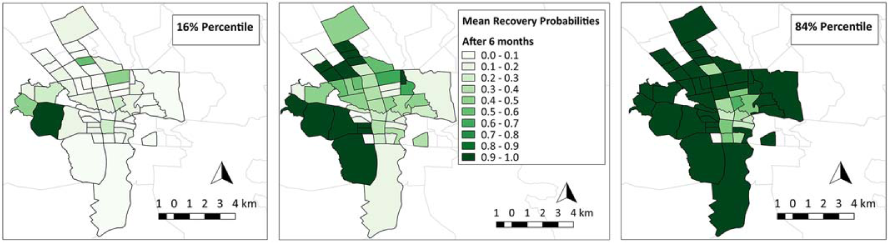
Mean, 16%, and 84% percentile recovery probabilities in the assessed area six months following the event, as determined by the proposed model.
It is worth noting that, because a different number of buildings was surveyed in each block group, the simulation procedure outlined previously was calibrated in order to overcome the bias potentially introduced if the number of observed buildings in each block group would have been considered equally significant. In other words, a block group where a small number of buildings have been assessed shall not have the same contribution to the regression analysis as one with a larger (and more significant) number of observations. In order to overcome this limitation, a weight corresponding to the fraction between (a) the number of assessed buildings in a given block group, and (b) the maximum number of assessed structures in all block groups was assigned to each block group. From a practical point of view, the weights are, in fact, probabilities of a block group contributing to the regression (i.e., a block group with a weight of 0.1 will be considered in 10% of the 1000 simulations, whereas one with the maximum number of assessed buildings—weight equal to 1.0—will be included in all the 1,000 simulations).
REGRESSION AND GOODNESS-OF-FIT
The robustness of the proposed model can be evaluated by the so-called goodness-of-fit test (Hosmer and Lemeshow 2000). This test is particularly useful because it provides a probability (p-value) that can directly be compared with a statistical significance (alpha) level of interest. Loosely speaking, when the p-values are lower than alpha, we can assume that the model estimates are statistically significant. As presented in Figure 5, in which the p-value resulting from each of the 1,000 regressions is shown, the predicted values of P(Y = 1) are statistically significant in virtually all simulations.
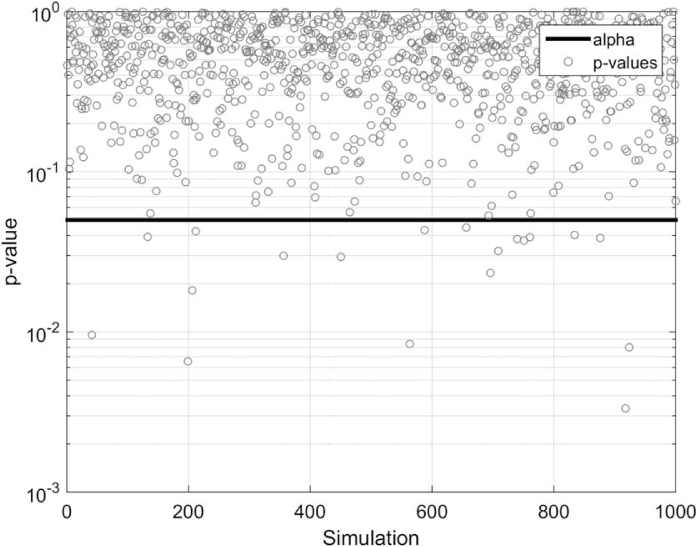
p-values computed for each of the 1,000 multivariate logistic regressions.
To further determine the level of accuracy and quality of the model, the mean predicted values of P(Y = 1) were plotted as a function of the corresponding “surveyed” probabilities in each block group for each of the field surveys. In this context, “surveyed” probabilities were determined as the fraction of assessed buildings that were fully recovered at the time of each survey, in each block group. As shown in Figure 6, there is a remarkable agreement between predicted and surveyed probabilities of recovery, specifically when the surveyed probabilities are different from zero or one. On the other hand, when surveyed probabilities are either zero or one (mainly in block groups where very few buildings were surveyed), the model probabilities differed significantly from the observed ones. This is considered to be a strength of the proposed model, because the observed probabilities in these cases (zero or one) are not an accurate representation of reality, but rather a consequence of the limited number of buildings assessed in these particular block groups. As a result, the correction provided by the model for these probabilities reflects the spatial trend of recovery in the block groups with higher (and more significant) number of assessed structures.
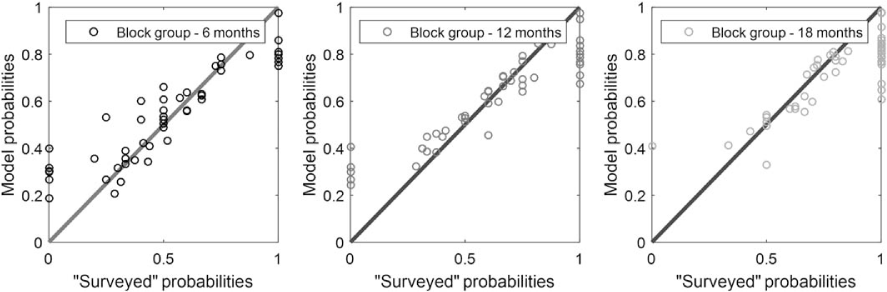
Predicted versus “surveyed” probabilities in each block group for the first, second, and third surveys.
DISCUSSION OF MAIN BENEFITS AND RESULTS OF THE METHODOLOGY
The recovery probabilities provided by the model can be understood as the likelihood of a building located in a specific block group being fully recovered at some time T after the earthquake. These probabilities can be obtained using Equation 1.
In addition to assessing the accuracy of the proposed methodology, as shown in Figure 6, the model can further be used to predict the evolution of recovery at any time in the future. To exemplify, Figure 7 illustrates the recovery probabilities in the city of Napa at T = 24 and 30 months following the event.
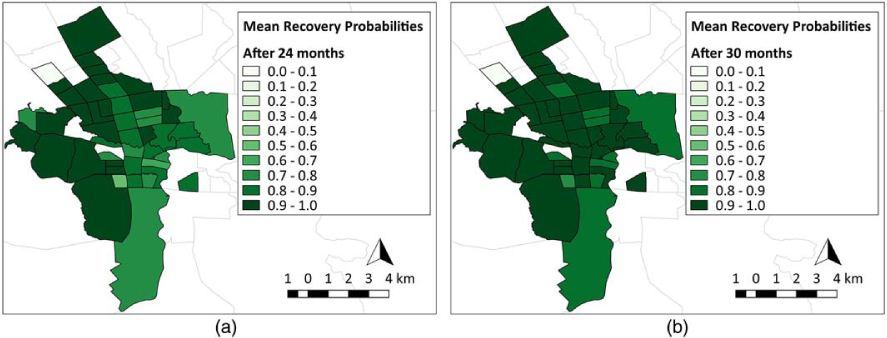
Mean predicted recovery probabilities at (a) 24 and (b) 30 months after the earthquake.
In addition, it is possible to use the proposed model to identify the variables that have the most significant influence on the assessed recovery progress. This is accomplished by evaluating the statistical significance of each of the variable coefficients (β 1 to β 40) using the Wald statistic. The Wald statistic can be calculated as the ratio between the coefficient of a given independent variable and its standard error, in which case it follows a standard normal distribution (Hosmer and Lemeshow 2000). In this study, Wald statistics were used to compute the significance (p-value) of the regression coefficients obtained for each independent variable. According to the latter, p-values lower than 0.10, as suggested by Hosmer and Lemeshow (2000), were assumed to correspond to the indicators that most significantly affect the recovery results.
In the case of Napa, the indicators found to influence the trajectory of recovery to the greatest extent are shown in Figure 8. These include: (a) the variable representing the time (TIME); (b) the damage indicator (MMI); (c) the age of building construction (PHU-BUILTAFT50); (d) the percentage of housing units that are owned by the residents in a block group (PHU-OWNED); (e) the employment status (PEMPLOYED); (f) the percentage of households (within a block group) that have any type of available income (PH-EARNINGS); (g) the percentage of households that have a male householder (PMALE-HOUSEHOLDER); (h) the percentage of population within a block group that have health insurance (PHEALTHINS); and (i) the percentage of English-speaking households in a block group (P-ENGLISH).
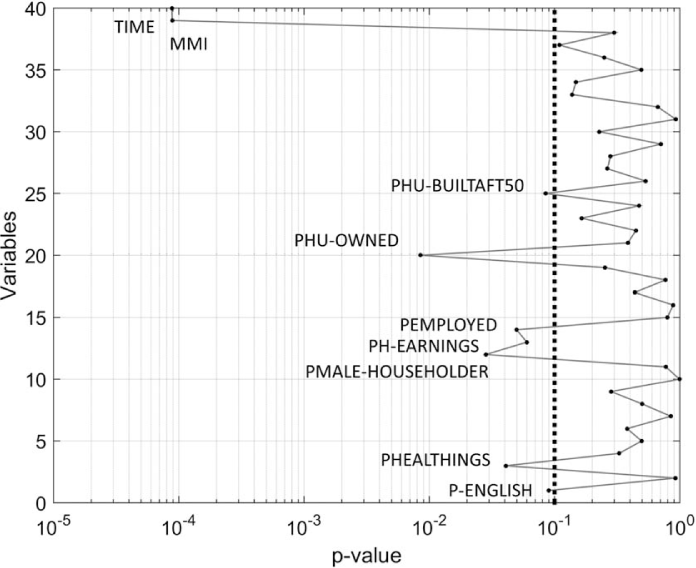
Contribution of independent indicators as determined by the p-values. In this case, a single logistic regression has been performed using the recovery information of all the assessed buildings, rather than several regressions with one selected building per block group (as such, the resilience indicators of each building are assumed as the ones of the corresponding block group).
The influence of home ownership is justified by the fact that homeowners are usually in a better financial condition to respond to the impacts of a devastating earthquake (Burton 2014) and they are more likely to have better access to government assistance programs (Comerio 1997). In addition, as it was verified during our field surveys, homeowners are more sentimentally attached to their homes, which provides a further incentive to promptly initiate recovery activities.
Particularly in Napa, where the employment rate is high and most of the households have some type of available income (Figure 9), many homeowners paid for repairs from their personal resources and savings. This contributed to a more expedite recovery because they did not have to wait until other recovery funding resources were made available. Similarly, the presence of health insurance facilitates the recovery processes because access to medical care is an important post-event source of relief. The lack of medical services will likely lengthen the relief and contribute to longer-term recovery from a devastating earthquake.
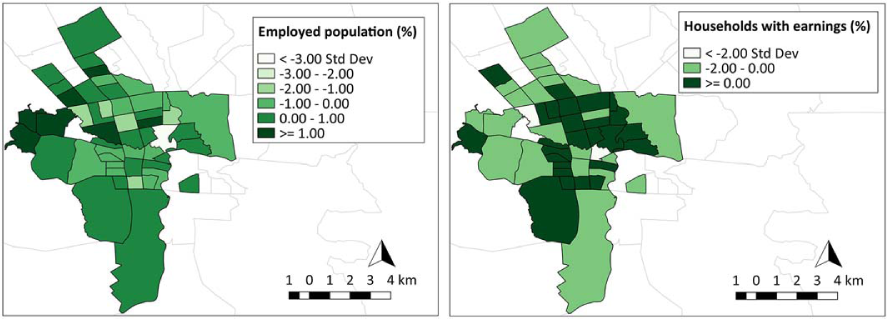
Spatial distribution of the employed population and the percentage of the households with earnings across the block groups of the city of Napa.
Populations that do not speak English, or those that speak English as a second language like many residents of the Latino communities in Napa, constitute a rather vulnerable group following a disaster. In the particular case of Napa, local governments faced many challenges in identifying and documenting housing damage and estimating monetary losses. One of the main factors contributing to this issue was that these communities were particularly reluctant to report building damage due to a lack of trust in authorities for fear of losing their housing rights (City Manager, personal communication, March 2016). This significantly affected the progress of recovery.
Despite these limitations, the city of Napa is a resourceful and resilient community (Rabinovici 2017), which significantly contributed to the overall timely and satisfactorily pace of recovery, as shown in Figure 10, where the mean recovery probabilities provided by the model at six, 12 and 18 months after the earthquake are presented (Figure 10a, 10b, and 10c, respectively). In this figure, it is possible to verify that the recovery is constantly progressing over time, albeit with a slower pace in the central and south-eastern block groups. This pattern is in accordance with the spatial distribution of the aforementioned significant resilience variables (Figure 8), according to which lower resilience values (which are known to hinder recovery processes) are also found in the central, south-eastern block groups. This trend is evident in Figure 10, where the spatial distribution of the percentage of homeownership (Figure 10d), the percentage of the population with health insurance (Figure 10e), and the percentage of English-speaking households (Figure 10f) are shown. Indeed, it can be observed that the spatial distribution of these resilience variables is in good agreement with the plotted probabilities of recovery, with lower values in areas where a slower recovery is taking place.
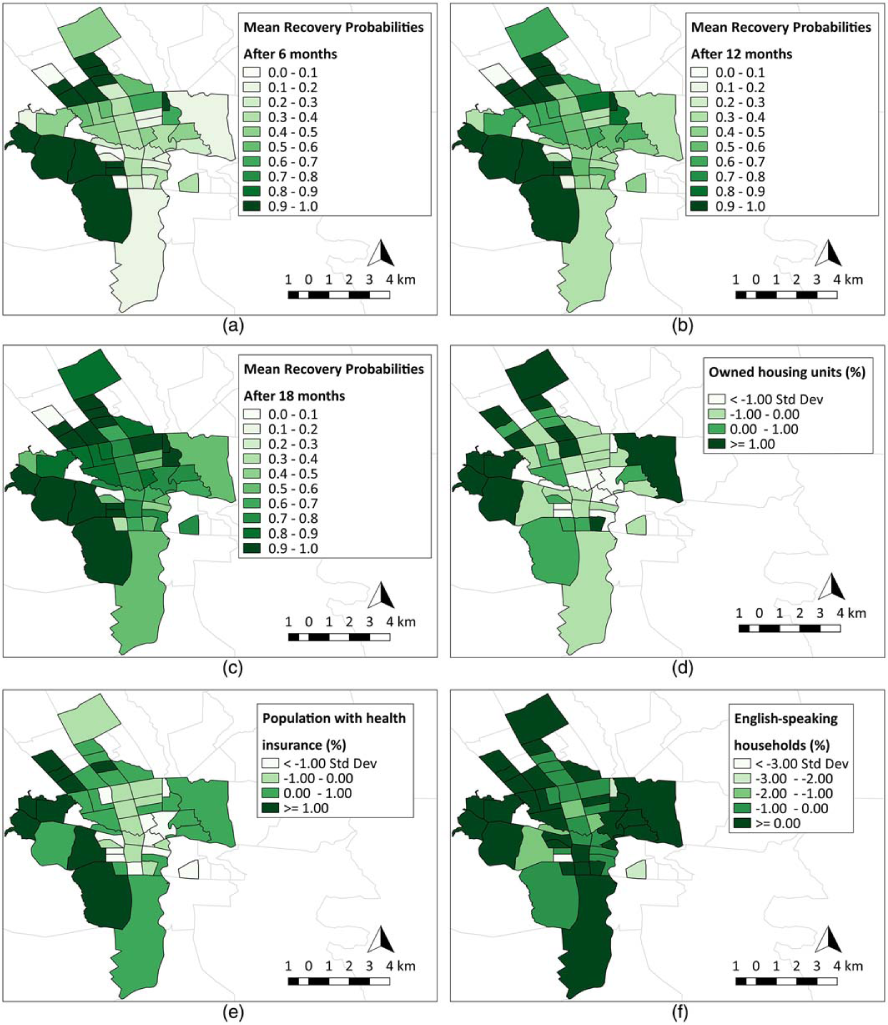
(a), (b), (c) Mean predicted recovery probabilities at 6, 12, and 18 months after the event, respectively; and (d), (e), (f) the spatial distribution of the percentage of homeownership, the percentage of population with health insurance, and the percentage of English-speaking households across the city of Napa, respectively.
In addition to the resilience parameters, there is a very significant degree of correlation between the damage indicator (MMI) and the recovery trajectory in the city of Napa. Higher MMI is associated with more extensive building damage, which obviously leads to longer recovery times. In this context, the date of construction of the building also plays a very significant role. Buildings constructed before 1950 are assumed to be of low quality and not seismically designed. As expected, more pre-code structures are located in the areas where the recovery is slower and the observed damage more extensive.
LIMITATIONS AND FUTURE IMPROVEMENTS
Being that this work is in its nascent stage, there is ample opportunity for future research and methodological developments. This methodology was developed using the city of Napa and the 2014 South Napa earthquake as a real-world case study. Therefore, it is expected to be applicable to communities with similar social, economic characteristics. In addition, this model would not be applicable in regions with very different building characteristics from the ones we assessed. In order to apply the proposed model in different regions, additional data collection and validation is necessary.
The selection of resilience variables and their potential to predict recovery outcomes was based in previous research demonstrating their influence on the recovery of different communities. Nonetheless, the methodology is amenable to the experimentation and/or the implementation of additional and/or different parameters as predictors of recovery, such as the earthquake insurance penetration rate, which can be a very significant fact in other regions with higher insurance penetration. In the case of the city of Napa, the access to earthquake insurance was verified to be virtually inexistent. For this reason, this variable was not considered in this study. However, the presence of earthquake insurance is of utmost importance in recovery because it constitutes the primary funding source for rebuilding when available (Comerio 1997).
Variables that represent post-earthquake action and decision making can additionally be used to potentially improve the proposed model. Being qualitative in nature, these variables were not included in this model. However, one of the main advantages of the proposed framework is its flexibility. In fact, the model and its predictions can be updated as many times as additional data is collected during the recovery assessment process. Therefore, these variables can be included, allowing decision makers to predict the impact of different actions on the future evolution of recovery.
Finally, the evaluation of building recovery was based on field surveys of the exteriors of individual buildings because building interior inspections were not possible in this study. Future research could complement this shortcoming, including alternative approaches such as the use of aerial photography and satellite imagery, U.S. mail records, and building permits and signoffs.
CONCLUSIONS
This paper presents a methodology that allows users to quantitatively predict the evolution of post-earthquake community recovery over time, as a function of a set of resilience variables and a damage indicator. Given the uncertainty associated with recovery and resilience, a probabilistic approach was applied in order to overcome limitations due to the limited data access in specific areas within the studied region. The methodology was developed and validated using the city of Napa and the recovery from the 2014 South Napa earthquake as a case study.
One of the main benefits of the proposed methodology is the potential to be applied in different areas immediately after an earthquake, allowing decision makers to prioritize their actions and resources in areas that, according to the model predictions, are expected to lag in recovery due to their reduced resilience. This is possible because the model allows the prediction of the recovery over time, solely based on a selected set of resilience indicators and the spatial distribution of the MMI, both commonly publically available and easy to obtain almost immediately after the event. The model provides an initial overview of the spatio-temporal evolution of recovery, which will allow stakeholders and policy makers to identify a priori critical areas that are more likely than others to experience greater difficulties in recovering and prioritize their actions accordingly, for example, informing on how to efficiently allocate available post-earthquake financial resources and make sure they reach the people in most need at all times.
In addition to its predictive capability, the proposed model allows users to identify the resilience parameters that most significantly contribute to the recovery trajectory of the affected region. This contributes to a better understanding of the complex nature of recovery processes and allows decision and policy makers to identify the strengths and weaknesses within their communities. Therefore, they could develop informed pre-disaster recovery plans that promote or address specific issues that facilitate recovery and reflect the actual needs of the population. In the case of the city of Napa, the resilience variables that more significantly affect the recovery trajectory are the: (a) time after the earthquake; (b) post-earthquake damage indicator (MMI); (c) age of building construction; (d) extent of homeownership; (e) employment status; (f) percentage of households (within a block group) that have any type of available income; (g) percentage of households that have a male householder; (h) percentage of population that have health insurance; and (i) the percentage of English-speaking households.
Footnotes
ACKNOWLEDGMENTS
This work was supported by the State of California, Alfred E. Alquist Seismic Safety Commission and is part of a collaborative effort between the Global Earthquake Model (GEM) and the University of California at Los Angeles (UCLA), Department of Civil and Environmental Engineering. The contribution of the second author was supported by the Faculty of Engineering of the University of Porto (Portugal). The authors would also like to thank the three unknown reviewers that substantially contributed to the improvement of this paper.