
Abstract
Seaports are important drivers of regional economies, and many face seismic risks. This study examines whether and how North American seaports consider, have engaged in, or have the capacity to effectively plan, manage, and mitigate seismic risks. Of particular interest is the way in which the evolving public–private governance arrangements in ports influence risk decision making. Results from a survey of North American seaports (N = 61) show that—contrary to expectations—port privatization influences seismic planning only indirectly through stakeholder influences on decisions, if at all, and ports identify optimizing economic development prospects as their primary strategic goal, rather than return on investment. Although seismic hazard is predictive of seismic planning, some higher-hazard ports report no plans to assess seismic vulnerability and report informal or no seismic mitigation plans. Further, higher-hazard ports are no more likely than lower-hazard ports to prioritize safety enhancements.
Introduction
Seaports (hereinafter “ports”) are key economic drivers for coastal regions and represent a critical link in global trade. U.S. foreign and domestic waterborne commerce each exceeded 1 billion tons of cargo in 2007, and U.S. container traffic accounted for 11% of the world total (US DOT 2007, 2009). An estimated 64% of the value of U.S. overseas trade traveled through U.S. ports, and another CDN$160 billion in trade traveled through Canadian ports (AAPA 2008, ACPA 2010). For this reason, the risks ports face and their capacity to manage risk are of societal concern, yet the ways in which ports plan, manage, and mitigate seismic risks remain open questions (National Research Council 2006). This study addresses this gap. First, we characterize the current status of North American seaports and critically assess the prior research that motivates our survey research.
Ports are no longer considered as isolated geographic entities but instead as critical links in global supply chains. Structural changes due to globalization, containerization, and privatization or devolution 1 present new challenges for port management (Robinson 2002, Helling and Poister 2000, Pallis et al. 2010). The diversity of stakeholders playing important roles in port decision making creates a complex and challenging environment in which even to gather data (Pallis et al. 2011).
North American ports have a wide variety of elements and functions. The largest are publicly governed. 2 Public ports may include the physical structures of bulk terminals for loading or off-loading grain, oil, or minerals; container terminals including gantry cranes and rail connections; and passenger terminals for cruise ships. Activities associated with these structures may be conducted by public employees (some of whom are unionized), private trucking companies, stevedoring companies operating the terminals, railroad companies, and shipping companies. In the United States, all these activities are commonly governed by elected port authorities whose purview may include an international airport or multiple ports (Sherman n.d., GAO 2007). In Canada, most ports have been recently (as of 1998) devolved from the federal government to regional or local control; however, the largest ports remain federally governed. Canadian ports can involve multifaceted elements and operations like U.S. ports but are limited to water transportation activities (i.e., no airports, bridges, or real estate dealings; Sherman n.d.).
Privatization of port operations has contributed to a diversification of governance configurations. The World Bank Port Reform Toolkit (2007) identifies four types: service ports, tool ports, landlord ports, and private ports, with service ports being those where a government entity owns all port land and assets and conducts all port business, including cargo transfer. The government becomes progressively less involved in operations and ownership for tool ports and landlord ports. Ports are thus public, mixed, or private (Brooks and Cullinane 2007, p. 429) with most ports reflecting “significant ‘mixed’ governance of port activities” (Brooks and Cullinane 2007, p. 433), and “very little convergence in governance structures” (Brooks and Cullinane 2007, p. 429). The World Bank–developed Port Reform Toolkit (2007) recommends privatization for reasons of economic efficiency.
Indeed, previous survey research indicates that economic goals such as maximizing return on investment and maximizing shareholder profit are among the primary strategic goals for ports, along with optimizing local or regional economic development (Baltazar and Brooks 2007). A corollary of this is that advancing technology and globalization have diminished the localized economic benefits of ports (Helling and Poister 2000). If such economic goals as return on investment are prioritized over such social goals as economic development, there may be ramifications for risk management priorities. Privatization and devolution create an uncertain decision-making environment that has the potential to change risk management burdens and outcomes (Bloomfield 2006, Terry 2005), especially if, as some suggest, private-sector interests are unwilling to take protective action for “public” risks such as earthquakes (e.g., May and Koski 2011). Decentralized decision making may lead to weaker risk planning and management due to the sheer complexity of partnership arrangements at ports, as well as the challenges of negotiating who pays. Port partnership arrangements involve multiple levels of government and private sector entities; for example, at a U.S. port, the Department of Homeland Security may be responsible for guarding against terrorism, while a private security firm is contracted by the port authority for other policing. Further, costs of preparing for low-probability, high-consequence risks can be high, and sometimes prohibitively so.
Ports are vulnerable to extreme risks, including natural disasters such as earthquakes, that can result in downtime and significant revenue losses (Pachakis and Kiremidjian 2004). The vital role of ports as transportation lifelines was demonstrated by the damage and closure of the Port-au-Prince seaport following the 2010 Haitian earthquake, necessitating the delivery of relief supplies by air or from across the island (U.S. Coast Guard 2010, Werner et al. 2011), and also by the damage at Concepción, Chile. The 1995 Mw 6.8 earthquake in Kobe, Japan, exemplifies the vulnerability of ports in developed contexts. Soil liquefaction led to the movement of quay walls and ground deformation, with related damage to cranes, bridges, railroads, and water and natural gas links. Estimates of direct damages to the port range between US$5.5 billion and US$10 billion, with much greater indirect damages. The disruption of port operations for the two years required to rebuild caused Kobe's world ranking among container ports to fall from 6th to 17th by 2000; by 2009, it was 46th (Werner et al. 1997, Chang 2000, AAPA 2009).
Many coastal North American ports are located in areas of high seismic hazard. Five of the ten highest-volume U.S. container ports are located on the West Coast in high-seismic-hazard areas (US DOT 2009). U.S. examples of seismic-induced port damages include the Mw 6.8 2001 Nisqually, Washington, earthquake, which caused an estimated $25 million in damage at the Port of Seattle seaport, and the Mw 6.7 1994 Northridge, California, and Mw 6.9 1989 Loma Prieta, California, earthquakes (Werner and ASCE 1998).
Despite these precedents, in the last decade, discussions of risks to ports have focused more on terrorism than on earthquakes (GAO 2007). The GAO (2007) attributes deficits in natural disaster planning to a lack of specific federal requirements, in contrast to the federal requirements and guidelines in place for security (especially related to terrorism) since 2002. The report identified a need for greater federal guidance in port disaster planning and recovery, stating “difficulties with personnel, communication, and coordination issues were greater than expected during recovery efforts” (p. 21) from natural disasters. Planning for natural disasters was independent of and less comprehensive than planning for security threats. The GAO recommended moving from a “separate” to an “all-hazards” planning approach and underlined the importance of stakeholder involvement and coordination (port agencies, operators, and tenants), as have others (Bostrom et al. 2006, Gregory et al. 2012). In a related vein, Knatz (2006) has called for national-level planning to mitigate disaster-induced supply chain disruption.
The prospect of devastating damage to port systems and wider-ranging ripple effects raises the question of how to reduce such risks and whether ports have the capacity and are prepared to do so. Seismic resilience can be bolstered numerous ways, including by risk sharing—through insurance or through arrangements, such as force majeure, 3 for example—or by engineering infrastructure to higher seismic standards. But, as noted above, whether and how ports consider, have engaged in, or have the capacity to engage in effective planning, management, and mitigation of seismic risks remain open questions (National Research Council 2006). Although the GAO (2007) suggests natural hazards planning has not been prioritized, ports engineers and managers should nevertheless be aware of their seismic risk due to seismic code requirements and should have planned accordingly.
Five hypotheses formalize our expectations based on the above:
H1: (a) No single governance structure characterizes a majority of ports. (b) No single risk decision-making structure characterizes a majority of ports. H2: Risk decision making in seaports is decentralized, with many different entities exercising varying levels of influence, depending on the type of decision being considered. H3: (a) The most common primary strategic goal is maximizing return on investment (ROI) and (b) ROI is more likely to be a goal at ports where private entities play a stronger role in governance and decision making. H4: Ports facing greater seismic hazards will have better seismic risk planning and management than those facing lower or no seismic hazard. H5: More decentralized ports and ports where private parties have a stronger influence on decision making will have weaker port seismic risk planning and management, regardless of the level of seismic hazard at the port and the perceived seismic risk at the port.
Methods
To address these questions, we surveyed port chief engineers or equivalent managers in the United States and Canada. Following Helling and Poister (2000) and Gregory et al. (2012), we asked about risk perception, decision making, risk assessment, management capacity at ports, and preparedness for potentially catastrophic events such as earthquakes. Surveys were pre-coded into five categories of seismic hazard (A = very low hazard, E = high hazard, described below) to achieve a comparative engineering-based measure of the seismic hazard faced by each port. This pre-coding enables us to take into account the level of seismic hazard in our examination of port risk assessment, management, and decision making while protecting confidentiality.
Survey Design
We developed comparable paper and Internet versions of our survey. Survey items were derived from our initial research with case study ports (Gregory et al. 2012) and discussions with project advisory board members, the Port Performance Research Network international survey of ports (reported in Baltazar and Brooks 2007, Brooks and Cullinane 2007), and prior research on subjective probability and risk assessment (Woloshin et al. 2000).
We assigned ports by their U.S. ZIP code or Canadian postal code into five seismic design categories (SDC)—A to E—of increasing seismic hazard based on the International Building Code. The SDC classification considers the location, structure use, and soil type to generate a performance-based measure of seismic hazard. Given the approximate latitude and longitude of each port based on postal code, we used web-based tools from the U.S. Geological Survey and Canadian Geological Survey to determine the seismic hazard based on ASCE (2005) and Halchuck and Adams (2008). The calculation of design spectral accelerations requires the selection of a site class to account for local soil conditions. In the absence of site-specific soil properties for each port, we assigned a “stiff soil profile” (Site Class D) to all port locations, which is the default site class. The assumption of “stiff” soils may not be appropriate for ports that may be located on marine or deltaic sediments at risk of liquefaction and subsidence in a seismic event, but the use of Site Class D does not significantly affect the relative number of ports assigned to each SDC. The determination of the SDC is also based on the occupancy category of the structure as defined in ASCE (2005). We chose Occupancy Category III, “Buildings and other structures with potential to cause a substantial economic impact and/or mass disruption of day-to-day civilian life in the event of failure,” to represent the functional importance of ports. We used this information to determine the SDC as described in Section 11.6 of ASCE (2005).
Sample Frame and Engineer Contact List
In the spring of 2009, we generated a contact list of all member ports from the 1993 and 2008 directories of the American Association of Port Authorities. Ports were contacted by phone and asked for the name, mailing address, and email address of the chief engineer or equivalent decision maker. We generated sufficient contact information for 21 of 22 Canadian and 100 of 110 U.S. ports. One Canadian port opted out of our survey. Five U.S. ports were dropped from the list because we learned that there was no decision maker equivalent to a chief engineer; surveys to an additional five ports without sufficient contact information were addressed generically to “chief engineer.” The final sample size was 126.
Survey Methodology
We followed Dillman's (2006) guidelines for a five-mailing survey. A cover letter notified respondents of the survey four days in advance of the first questionnaire. A token incentive and a stamped postcard to notify us that the survey had been returned anonymously accompanied the first questionnaire. Subsequent mailings included a reminder postcard after one week, another full survey after three weeks, and a reminder letter two months after the first questionnaire. Every mailing included a website URL for respondents who wished to complete the survey online. Email reminders were sent ten days and ten weeks after the initial questionnaire.
Results
We present our results as follows: (1) respondent characteristics; (2) port governance, including ownership, management, responsibility over operations, stakeholder influence, and level of privatization; (3) strategic mission; (4) risk perception and seismic design categories; and (5) seismic readiness at high-seismic-hazard ports.
Respondent Characteristics
We received 46 paper and 15 Internet survey responses, for a crude response rate of 48.4%. One mailing was returned as undeliverable for an overall response rate of 48.8%. This response rate compares favorably with the Port Performance Research Network 2005 survey, which obtained a 9% response rate from U.S. ports and a 36% response rate from Canadian ports for a combined North American response rate of 13.6% (Brooks and Cullinane 2007).
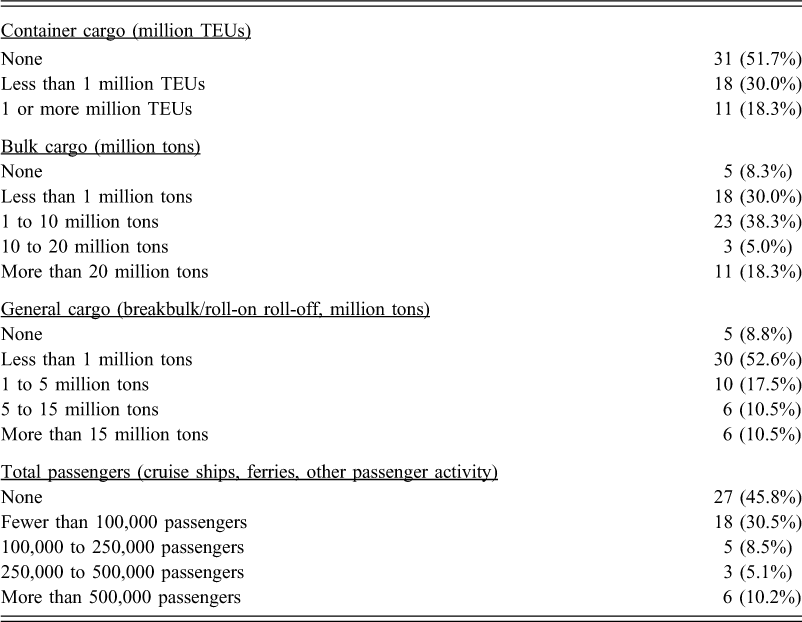
A plurality of respondents (45.9%) reported being chief engineers at their ports and a majority reported engineering as part of their job title. Respondents reported a mean 19 years of experience (median 16 years) working with ports and a mean of 9.2 years in their present position (median 7.5 years). Respondent ports conduct a variety of shipping operations (Table 1). A slight majority (51.7%, n = 31) did not ship container cargo in 2008. Nearly all ports dealt with bulk cargo, with only 8.3% (n = 5) not shipping bulk cargo. With regard to general cargo capacity including breakbulk and roll-on/roll-off cargo, a majority (52.6%, n = 30) dealt with less than 1 million tons of general cargo in 2008. Forty-six percent (n = 27) of respondent ports did not carry passenger traffic, and 30.5% (n = 18) transported fewer than 100,000 passengers in 2008.
Characteristics of responding ports
Seaport Ownership, Management, Responsibility, Stakeholder Influence, and Privatization
No single governance structure characterizes a majority of ports (supporting H1a). A majority (78.6%, n = 44) of ports responded that they were managed by a central government entity (compared with public–private partnership, 12.5%, n = 7, versus private sector entity, 8.9%, n = 5). However, in response to a separate, more specific governance question, a small plurality (n = 16) reported that a state or commonwealth port authority governed their port, comprising only 29.1% of the sample. The remaining categories are presented in Table 2. These responses contrast with Fawcett's (2007) summary of U.S. ports, wherein a majority (57 of 100) of ports reported being governed by special-purpose navigation districts in 2005 (compare also US DOT 2008, for 2006, in Table 2). Although Fawcett's (2007) data did not include Canadian ports, the discrepancy between our results and Fawcett's is too great to be explained by the small number of Canadian ports in our sample. One possibility is that the discrepancy could be a result of a survey response bias, such as an inadvertent effect of targeting chief engineers.
Port governance
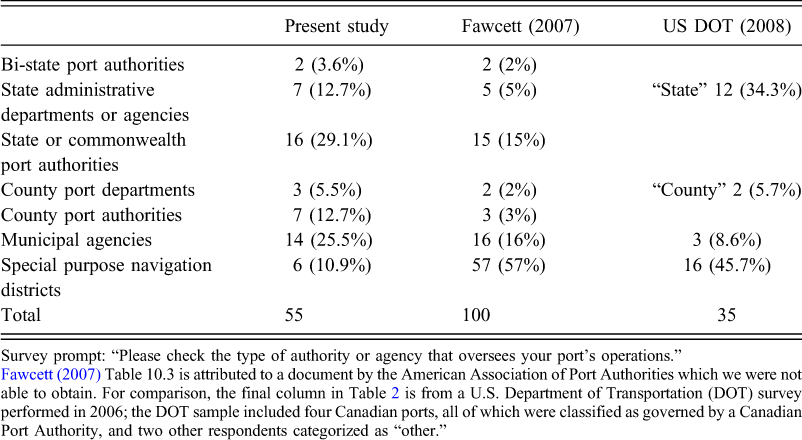
Survey prompt: “Please check the type of authority or agency that oversees your port's operations.”
The results also indicate great diversity in the operating status of responding ports. Almost half (46.6%; n = 27) reported serving as “landlord” ports, which are ports that lease the majority of facilities to others for operations (Fawcett 2007, after Hershman 1988). Twenty-one percent (n = 12) of respondents reported performing the actions associated with “operating” ports, which are those that manage day-to-day activities including ship scheduling and employment. A further 32.8% (n = 19) reported the functions of a “limited operating” port, which is between landlord and operating port types in degree of devolution.
Diverse stakeholders exercise differing levels of influence over ports (Figures 1a and 1b), with the influence of several on future construction differing significantly from their influence over current operations. The observed variance in influence on current port operations and future construction indicates significant diversity in decision-making structures. One exception to this diversity is the common influence of the port authority commission: 76.8%(43 of 56) of respondents rate its influence on current operations as “strong” (Figure 1). Port tenants, port operators, shippers, and local government are the next most influential, in both operations and future construction decisions. Although the pairwise correlations between respondents’ judgments of each stakeholder's influence on operations versus future construction are all positive (0.27 to 0.87) and significant (p < 0.05), there is considerable heterogeneity in the influence of half of the port stakeholders identified in Figure 1. The pairwise differences in influence between the two contexts are significantly different (p < 0.05) for seven of the stakeholders: federal government; industry/shippers; employee unions; ocean carriers; transportation, forwarding and booking; insurance providers; and retail trade. These stakeholders each play unique roles in risk management and also face demonstrably differing risks from seismic hazards in port systems.
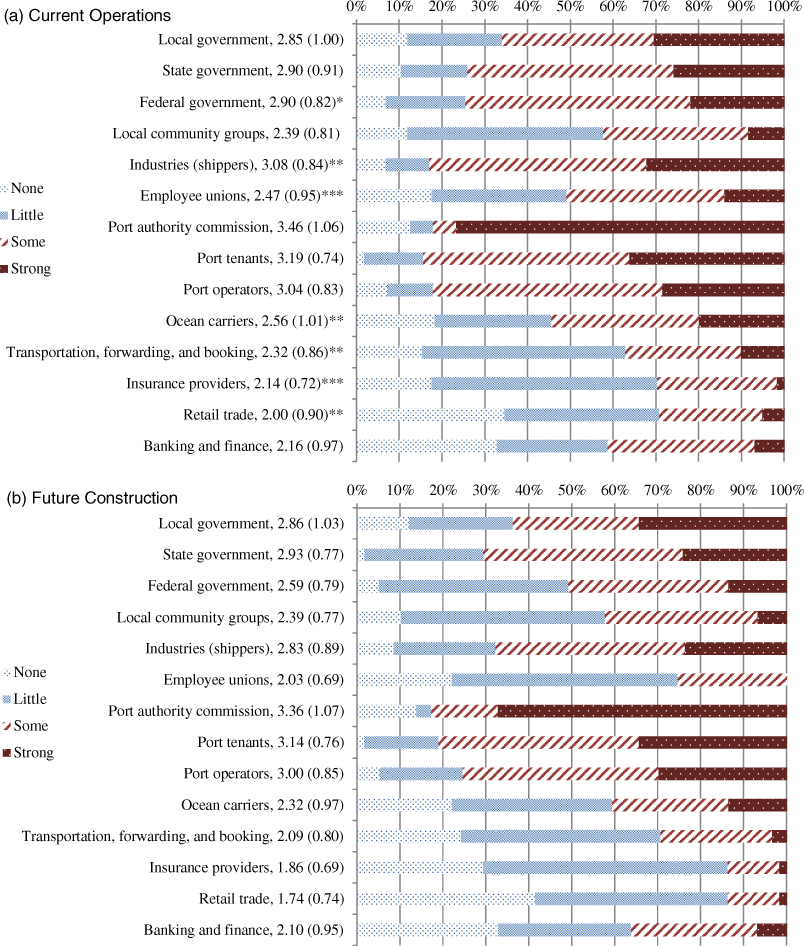
(a) Stakeholder influence on current operations with mean value (standard deviation) and (b) stakeholder influence on future construction with mean value (standard deviation). Scores are based on 1 = “none,” 2 = “little,” 3 = “some,” and 4 = “strong” level of influence.
That some stakeholders have more influence on operations than on future construction and that others have more influence on future construction than on operations suggest the potential for conflicting preferences on risk management decisions that require tradeoffs between the two.
Privatization and Decentralization
To further test whether risk decision making is decentralized in ports (H2), we consider reported management status in relation to stakeholder influence on current operations and future construction. The majority of ports (77%, n = 37) are managed by a central government, consistent with Fawcett's (2007) description of U.S. ports as publicly owned entities with some operations privatized. Ten percent (n = 5) of ports are managed by a private sector entity and 16% (n = 6) by a public–private partnership agreement, respectively.
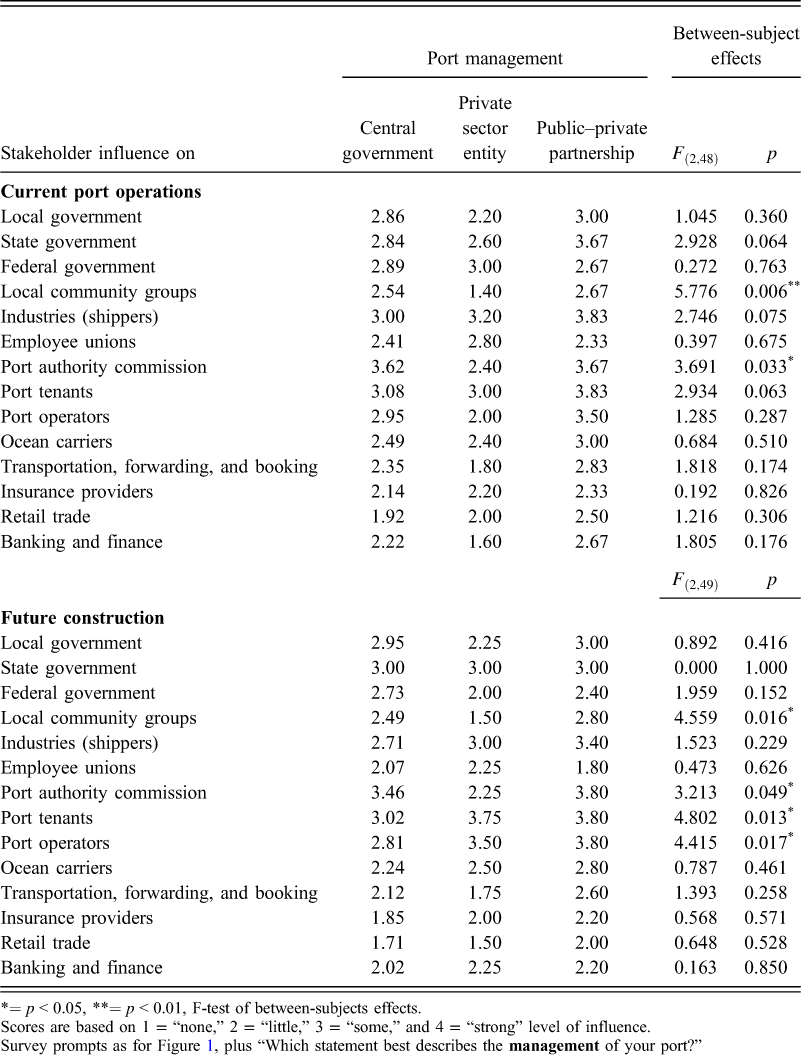
The influence of local community groups varies by management type, with private sector–managed ports reporting lower influence of local community groups than ports managed by central government or public–private partnerships, for both current operations (F(2,48) = 5.766, p = 0.006) and future construction (F(2,49) = 4.559, p = 0.016; Table 3).
Stakeholder influence by port management
= p < 0.05,
= p < 0.01, F-test of between-subjects effects.
Scores are based on 1 = “none,” 2 = “little,” 3 = “some,” and 4 = “strong” level of influence.
Survey prompts as for Figure
Finally, there are significant differences by port management in judged levels of influence of port tenants and port operators (Table 3, final column). Here, a different pattern emerges: Ports managed by private sector entities and public–private partnerships rated these stakeholder types more influential on future construction than did ports managed by a central government.
To further evaluate the role of privatization on profit maximization, we constructed a composite variable from 19 survey items related to private management, ownership, and the influence of private-sector entities. The items were positively correlated with few exceptions and the resultant privatization variable passed a joint skewness-kurtosis test of normality (joint P > χ2 = 0.899).
However, we found no relationship between the privatization score and the likelihood of selecting “Maximize profits for our shareholders” (P > |z| = 0.588), “Maximize return on investment for government” (P > |z| = 0.842), or both responses combined (P > |z| = 0.539).
Strategic Mission
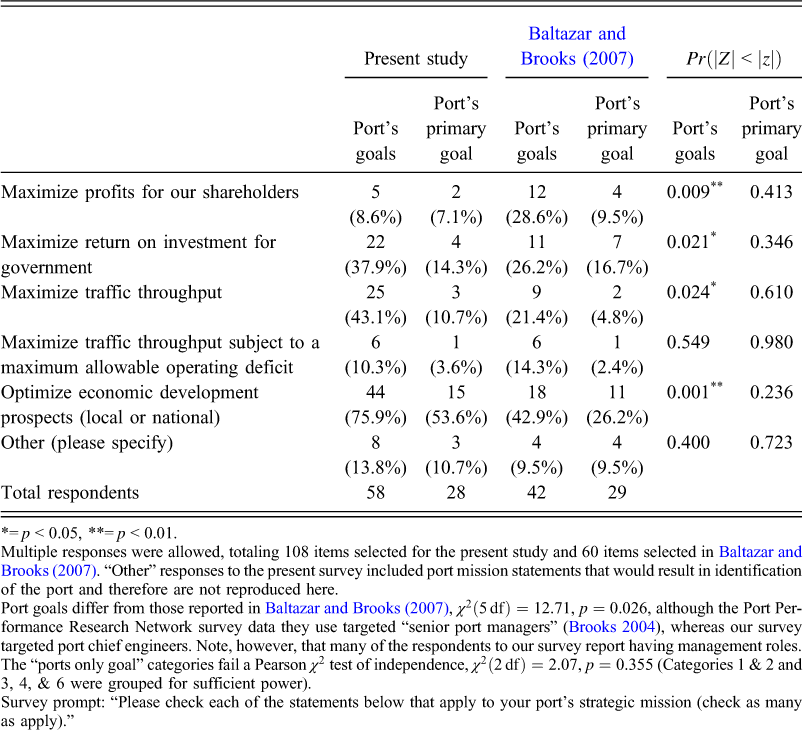
Contrary to our expectations (H3a), ROI is not the primary stated goal of most ports. As shown in Table 4, a majority (75.9%) of responding ports stated their primary goal was to “optimize economic development prospects (local or national).” This response shows an even greater emphasis on local or national economic development than found by Baltazar and Books (2007) or suggested by Helling and Poister (2000). The results demonstrate the public role in which North American ports see themselves, which corresponds with public interest in seismic risk management of ports. This may reflect the evolution of the roles of ports over the last decade or historical factors that have led to large U.S. seaports remaining publicly owned and governed, while devolution and privatization have gone farther elsewhere (Fawcett 2007).
Port's primary strategic purpose compared with
=p < 0.05,
=p < 0.01.
Multiple responses were allowed, totaling 108 items selected for the present study and 60 items selected in
Port goals differ from those reported in
Survey prompt: “Please check each of the statements below that apply to your port's strategic mission (check as many as apply).”
Seismic Design Category and Perceived Seismic Risk
Response rates by seismic design category are presented in Table 5. To test for response bias by level of seismic hazard, we compare the sample proportions (expected based on the initial mailing list) to the response proportions (observed) by seismic design category. The proportions did not differ significantly (χ2(4 df) = 1.4, p = 0.84).
Sampling and response rate by seismic design category
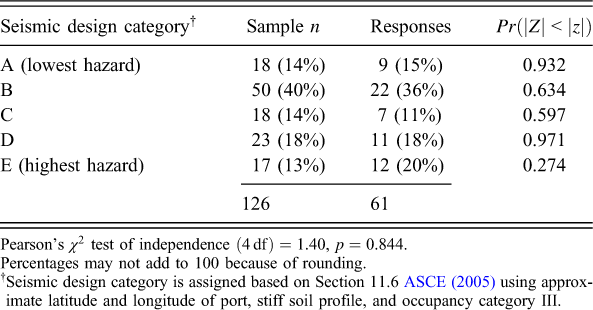
Pearson's χ2 test of independence (4df) = 1.40, p = 0.844. Percentages may not add to 100 because of rounding.
†Seismic design category is assigned based on Section 11.6
A principal concern in risk assessment is whether perceptions of seismic risk and planning are correlated with engineering-based assessments of seismic hazard. As anticipated, perceived probability of a disruptive earthquake is strongly positively correlated with seismic design categories (r = 0.68, p < 0.001 when SDC are coded as 1 to 5). To investigate further the extent to which these variables are related at respondent ports, we created a standardized score from two questions: one on the presence and formality of seismic mitigation plans and another on the frequency of seismic vulnerability assessments. We regressed this “seismic planning” score on dummy variables for the seismic design categories (with Category A as the leave-out category). We included controls in the form of dummy variables for port management and a question in which respondents estimated the probability of a “disruptive” earthquake in the next 50 years at the port.
In support of H4, we find engineering-based measures of seismic hazard to be predictive of seismic planning, controlling for management and subjective probability of disruptive seismic events (Table 6, Model 1): the higher the seismic design category, the more seismic planning. Subjective probabilities of seismic events do not predict seismic planning over and above the variance explained by seismic design categories, after controlling for management structure. Seismic planning appears to be primarily driven by engineering-based estimates of seismic hazard. Contrary to expectations (H5), privatization does not appear to influence seismic mitigation planning (r = 0.04, p = 0.78, and Table 6, Model 2).
Seismic planning as a function of seismic design category, management, and perceived seismic risk
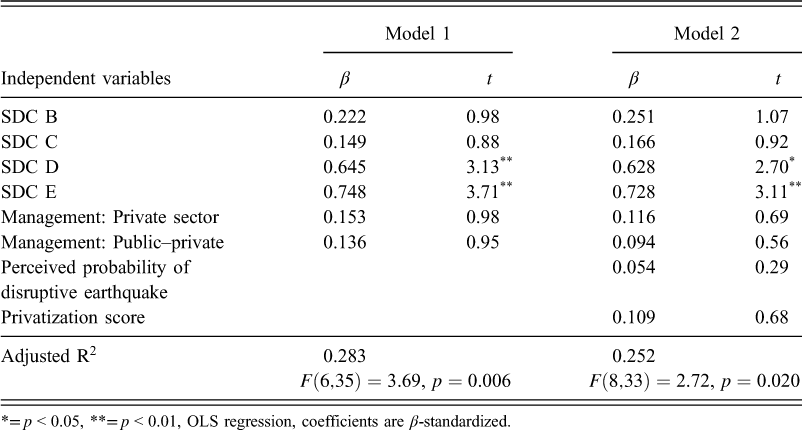
= p < 0.05,
= p < 0.01, OLS regression, coefficients are β–standardized.
Seismic Readiness at High-Hazard Ports
Finally, we assess the relative disaster readiness of ports in high seismic hazard areas. To increase the power of our analyses, we use a binary split of low- and high-hazard ports based on their SDC classification. Low-hazard ports include those with an SDC of A, B, or C. High-hazard ports are those with an SDC of D or E.
First we consider plans for recovery and emergency response. High-seismic-hazard ports appear no more likely than low-seismic-hazard ports to have formal response and recovery plans (Table 7). This could perhaps be due to the fact that low-seismic-hazard ports may face other hazards such as hurricanes.
Recovery plans in case of catastrophic events and emergency response plans
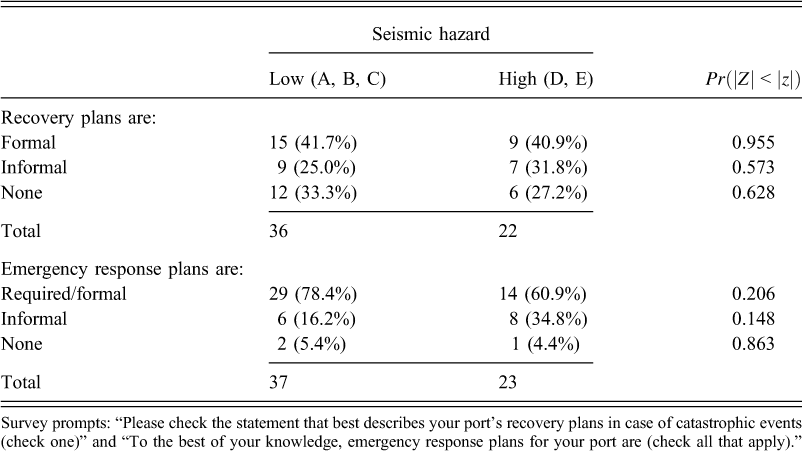
Survey prompts: “Please check the statement that best describes your port's recovery plans in case of catastrophic events (check one)” and “To the best of your knowledge, emergency response plans for your port are (check all that apply).”
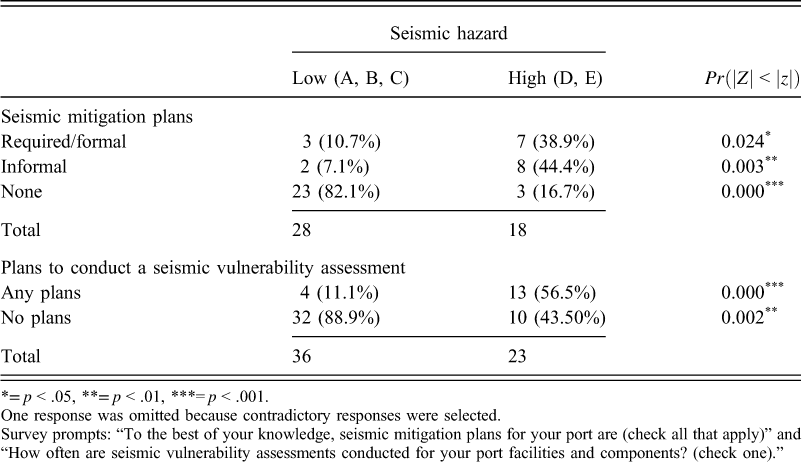
As expected, ports in high seismic risk areas are significantly more likely to have seismic mitigation plans and to conduct seismic vulnerability assessments (Table 8). However, despite the significant relationship between seismic mitigation plans and increased seismic hazard, a number of ports facing high seismic hazard reported having informal (n = 8, 44% of high SDC ports responding to this question) or no seismic mitigation plans (n = 3, 17%). Furthermore, nearly half of high-hazard ports (n = 10, 44%) reported having no plans to conduct a seismic vulnerability assessment. The survey did not ask about previous assessments, so it is possible that some of this number had recently completed a seismic vulnerability assessment.
Seismic mitigation plans and plans to conduct a seismic vulnerability assessment
= p < .05,
= p < .01,
= p < .001.
One response was omitted because contradictory responses were selected.
Survey prompts: “To the best of your knowledge, seismic mitigation plans for your port are (check all that apply)” and “How often are seismic vulnerability assessments conducted for your port facilities and components? (check one).”
Considering the possibility of extended operational interruption from a seismic event, it is important to know what capability ports have to take on cargo diverted from nearby ports (Table 9). A majority (n = 39, 66.1%) of respondents reported an ability to increase cargo-handling capacity by at least 50%. High- and low-seismic-risk ports did not differ in their ability to increase cargo handling. The stated extra capacity across numerous ports may be attributable to several factors, including diminished demand for global shipping at the onset of the 2008 recession.
Recovery support: projected ability to increase cargo handling capacity
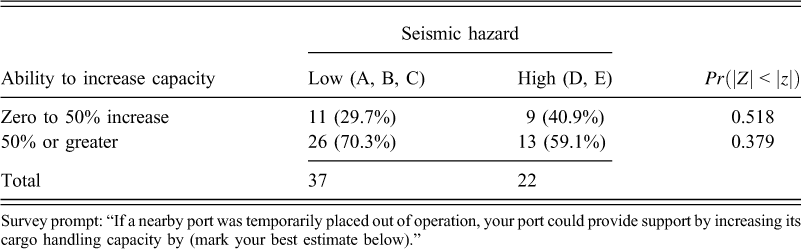
Survey prompt: “If a nearby port was temporarily placed out of operation, your port could provide support by increasing its cargo handling capacity by (mark your best estimate below).”
While ports report additional capacity, it is worth noting that there are a relatively small number of container terminals on the seismically active West Coast. As such, if an earthquake disrupted a larger container port, cascading effects could well overwhelm capacity. However, to preserve confidentiality, our survey did not request information that would identify the port's geographic location, for which reason our results do not allow full analysis of this specific issue.
Table 10 presents the responses regarding arrangements for contingency operations in case of earthquake damage. The ability of a ship to go to an alternate, undamaged terminal could have a major impact on post-earthquake throughput. This item assesses the nature of contractual agreements that would facilitate such arrangements and how common they are.
Arrangements for contingency operations in case of earthquake damage
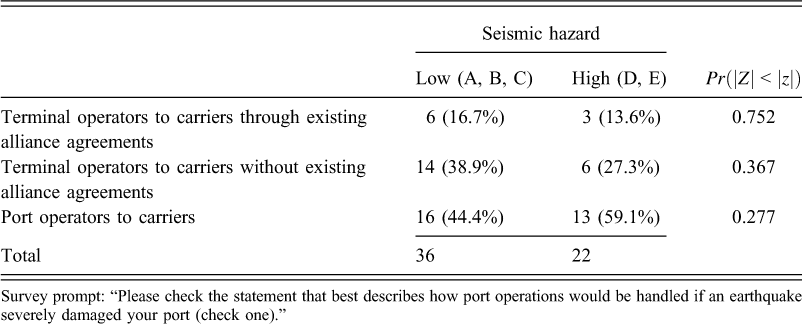
Survey prompt: “Please check the statement that best describes how port operations would be handled if an earthquake severely damaged your port (check one).”
Half of responding ports (50%, n = 29) give port operators the responsibility of arranging contingency operations with carriers. At the other half of responding ports, terminal operators are responsible for arranging contingency operations, with 35% (n = 20) doing so without existing alliance agreements and 16% (n = 9) doing so through existing alliance agreements.
As a final measure of seismic risk preparedness, respondents ranked their port's investment priorities for several types of infrastructure enhancement (Table 11). Ports facing high seismic risk are no more likely to prioritize safety enhancements than those in low seismic risk areas. This is despite some of the high-risk ports acknowledging less than comprehensive planning and preparedness for seismic hazards. The highest-ranked priority is facilities expansion, with 58% (n = 34) of ports rating it as a high priority, consistent with an economic-development focus.
Infrastructure enhancement priorities by SDC
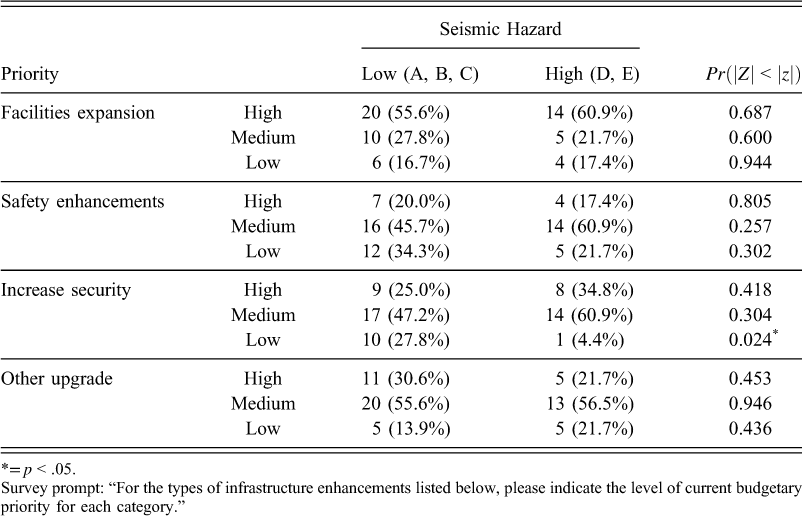
= p < .05.
Survey prompt: “For the types of infrastructure enhancements listed below, please indicate the level of current budgetary priority for each category.”
Conclusions
Effective risk governance is critical for sustainable public infrastructure and in public–private systems, such as port systems. Reassuringly, North American ports with higher seismic hazard tend to have better seismic risk planning and management; engineering-based measures of seismic hazard are predictive of seismic planning. However, not all are prepared for disruptive seismic events. Our survey findings reveal surprising weaknesses in seismic risk management in North American port systems, only partly explicable by the differences in risk governance structures explored in the study. No single governance structure characterizes a majority of seaports in the study, although risk decision making is decentralized as expected; seaports report a diversity of management and governance structures as well as varied operating status (supporting our first hypothesis). Interestingly, ports report a greater diversity of governance than found in an earlier study (Fawcett 2007, p. 220, Table 10.3).
Risk decision making in seaports is decentralized, with local governments, private entities, and other port stakeholders exercising varying levels of influence on current operations and future construction decisions (supporting our second hypothesis). Port authority commissions are ranked by far the most influential stakeholder in both current operations and decisions regarding future construction. Local community groups have less influence at private sector ports than at those managed by central governments or public–private partnerships, whereas port tenants, and port operators wield less influence at ports managed by central governments than at those managed privately or by public–private partnerships (see Table 3 for details). Nevertheless, the degree of privatization does not appear to influence seismic risk planning, contrary to expectations. A majority of respondents reported that their port's primary strategic goal is local or national economic development, and this proportion was higher than that found in prior findings (e.g., Baltazar and Brooks 2007). That we failed to find an association between degree of privatization and primary management goals may reflect complexities of management and governance configurations at North American seaports that our survey did not capture, or perhaps the history of public ownership of American tidelands and waterways.
In sum, our survey results provide an updated characterization of seaport governance, decision making, and risk management, and suggest three major observations:
First, risk management and governance configurations at North American seaports are highly variable, with many disparate influences on operations and planning. Respondents rated shippers, unions, ocean carriers, insurance providers, and retail trade as having significantly less influence on future construction than on current operations. As noted above, the influence of local community groups on current operations varies significantly depending on port management, as does the influence of port tenants and operators on future construction decisions. This highlights the significant challenge facing seismic risk management in ports, which often entails tradeoffs and investments in construction to mitigate risk.
Second, while subjective probabilities of disruptive seismic events and preparedness appear well calibrated in that they increase with increases in an engineering-based measure of seismic hazard, some higher-hazard ports report no plans to assess seismic vulnerability and have informal or no seismic mitigation plans. Of the high-seismic-hazard ports responding, a majority (61.1%, n = 11) report having only informal or no seismic mitigation plans. Ten of twenty-three (43.5%) report not having plans to conduct a seismic vulnerability assessment.
Finally, high-seismic-hazard ports were no more likely to prioritize safety enhancements, instead giving priority to facilities expansion. This reinforces the GAO's (2007) conclusion that ports have not prioritized all-hazards disaster planning strategies. That respondents reported an absence of seismic preparedness or mitigation plans at some high-hazard ports raises the question of why this is the case. Gregory et al. (2012) cast some light on this, but given the acknowledged economic importance of seaports, there is a clear need for additional examination of risk decision making, planning, and preparedness at high-hazard ports.
Footnotes
Acknowledgements
This material is based on work supported by the National Science Foundation under Grant No. CMS-0530478. Any opinions, findings, and conclusions or recommendations expressed in this material are those of the authors and do not necessarily reflect the views of the National Science Foundation. Partial support for this research came from a Eunice Kennedy Shriver National Institute of Child Health and Human Development research infrastructure grant, R24 HD042828, to the Center for Studies in Demography & Ecology at the University of Washington. Stu Werner made valuable contributions to the survey instrument design. We thank the anonymous reviewers who offered valuable insights to the revision of this paper.
1
Devolution refers to the transfer of regulatory authority from a central government to a subnational level, such as state, regional, or local government.
2
Some ports are completely private; these ports are not included in this study.
3
Force majeure arrangements are contractual clauses which release a contractor from liability if an event beyond the contractor's control prevents it from completing its obligation. Force majeure arrangements commonly cover so-called “Acts of God,” including earthquakes.