
Abstract
This work proposes a new precast segmental concrete bridge column. The lower region of the column is built using cast-in-place (CIP) construction. The height of the CIP region and level of post-tensioning force in the precast region are selected such that the ultimate condition of the column under seismic loading is governed by a conventional plastic hinge mechanism in the CIP region. A tall column was constructed and subjected to cyclic loading. Test results indicate that the column has excellent ductility and energy dissipation. A pushover analytical method was proposed and applied to the proposed column. This method captured joint opening through the joint rotation length and the amount of curvature exceeding the cracking curvature. Analytical results agree well with test results in predicting the envelope of hysteretic behavior, the increase in axial force in the precast region, and the contribution of precast and CIP regions to column displacement.
Introduction
Precast segmental concrete bridge columns have several advantages compared to conventional cast-in-place (CIP) bridge columns. These advantages include reducing traffic disruption, maintaining concrete quality, and avoiding potential column rebar cage collapse during construction. Despite these advantages, the use of segmental columns in regions with high seismic activity has been limited. A major concern was the seismic performance of such columns. Several studies have investigated the seismic behavior of segmental columns over the last decade (Arai et al. 2000, Hewes and Priestley 2002, Billington and Yoon 2004, Ou et al. 2007, Wang et al. 2008, Hoshikuma 2010, Ou et al. 20010a, Ou et al. 2010b, Sakai et al. 2010, Taira et al. 2010). Segmental columns in these studies are classified as columns with hysteretic behavior resembling that of conventional CIP columns, which is called emulative behavior, or as columns with non-emulative behavior. Non-emulative behavior is typically dominated by the opening of segmental joints, resulting in a rocking-like behavior. Supplemental energy dissipation is typically added to control the displacement response of non-emulative columns. Non-emulative behavior under a large earthquake has the advantage of small residual displacement. Because non-emulative behavior differs significantly from the hysteretic behavior of conventional CIP columns, most current seismic design codes, which are based on the hysteretic behavior of conventional CIP columns, are not applicable to non-emulative behavior.
To avoid this problem, engineers may adopt linear elastic design to prevent entering the nonlinear portion of hysteretic behavior. For instance, segmental columns used in the Chang-Shou Bridge (Figure 1a) and Yu-Le Bridge, both of which were constructed in 1987 in Taiwan, utilized this design concept. These two bridges were not damaged by the 1999 Chi-Chi Earthquake, which caused a peak ground acceleration of 0.3–0.4 g around the bridge sites. The performance objective adopted by engineers was no tensile stress under a design level of earthquake action. The disadvantage of linear elastic design is that a large cross-sectional area is needed to accommodate the post-tensioning force needed to achieve such a high performance objective.
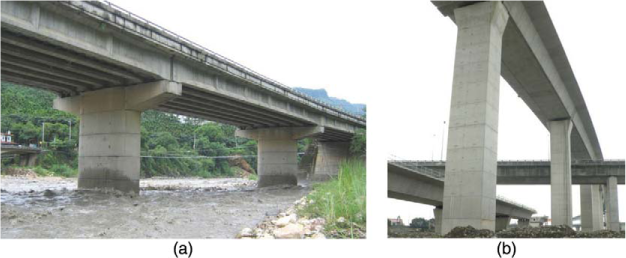
Segmental bridge columns in Taiwan: (a) Chang-Shou Bridge in Nan-Tou; (b) Taichung Metro-Area No. 4 Expressway.
Conversely, emulative behavior, which may have a large residual displacement after a design earthquake, permits direct use of current seismic design codes. For instance, response modification factors developed for conventional bridges can be adopted. This work proposes a new type of segmental column with emulative behavior to take this advantage. This segmental column is built using CIP construction for the column's plastic hinge region and by designing the strength of the precast region such that ultimate behavior is dominated by a conventional plastic hinge in the CIP region. The design details of the proposed column and pushover analysis method are verified by testing a large column specimen. The proposed segmental column was recently used for the new Taichung Metro-Area No. 4 Elevated Expressway (Figure 1b).
Specimen Design and Construction
Test Specimen
Figure 2 shows the design details of the column specimen tested. The scale factor is 0.29. The column consists of two parts. The lower part is CIP with the foundation. The longitudinal and transverse reinforcement ratios of this part are 1% and 1.6%, respectively. The upper part consists of 8 precast hollow segments and a solid block. The precast segments have a hollow cross section to reduce their weight when shipping and assembling. The longitudinal and transverse reinforcement ratios of the precast segments are 1% and 2.2%, respectively. The solid block is used for the actuator to apply lateral loading on the column. The segments and block are assembled using post-tensioning anchored by U-loops in the upper portion of the CIP region. Column height is 8.4 m. The column is slender and has an aspect ratio of 7.
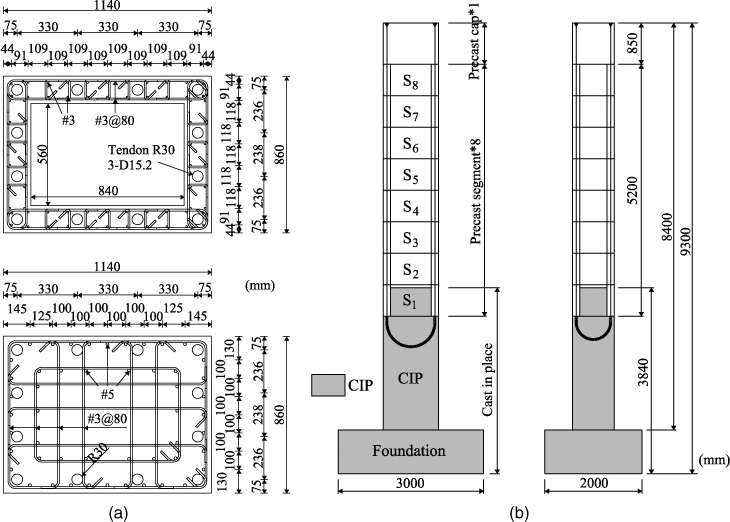
Column design: (a) Section view; (b) elevation view.
Design Concept
The design concept for the column is that the ultimate condition is dominated by the plastic hinge behavior of the CIP region rather than by significant nonlinear behavior of precast joints, normally accompanied by a large joint opening. This condition is achieved by capacity design for the flexural strength of the critical joint of the precast region. The height of the CIP region and post-tensioning force in the precast region are adjusted, such that when the CIP region base reaches the maximum probable moment strength, Mpr, the corresponding moment at the critical joint of the precast region is less than 90% of the nominal moment strength, Mn, of the joint. The joint between the CIP region and segment S1 (joint CIP-S1) is considered the critical joint in the column's design. The strengthening effect of the portion of the CIP region inserted into the hollow core of segment S1 is conservatively neglected. Although the ultimate condition is controlled by the CIP region, opening of joint CIP-S1 is not prevented. Post-tensioning tendons are designed to be unbonded from the concrete to reduce yielding and, hence, pre-stress loss due to joint opening.
The Mpr of the CIP region is calculated based on 1.25 fy, where fy is the specified yield strength of mild steel reinforcement (412 MPa). When calculating Mn of the critical joint of the precast region, the concrete tensile strength is assumed to be zero to account for the effect of joint opening. The effect of post-tensioning tendons is represented in the model using axial force, as unbonded tendons are used. The longitudinal mild steel reinforcement is not considered in the model since it is not continuous across the joint.
On the basis of the design concepts aforementioned, the height of the CIP region and post-tensioning force were selected as 2.35 m and 3,788 kN, respectively. Post-tensioning force is carried by 12 tendons, each consisting of three D15.2 seven-wire strands. Each strand has a nominal cross-sectional area of 140 mm2. Post-tensioning stress is 45% of tendon yield stress, 1,682MPa. The stress in each tendon was monitored by a load cell installed at the tendon anchorage, located at the top of the column. The objective of low initial pre-stress is the same as that for using unbonded tendons. Both measures are used to reduce tendon yielding and, hence, pre-stress loss. Thus, loss of flexural strength of the critical precast joint due to loss of pre-stress can be minimized. This is critical to ensuring that the ultimate state of the column is controlled by the CIP region.
The gravity load from the superstructure is 1,300 kN. Therefore, total axial force in the precast region is 5,088 kN, which is 0.29 Agfc′, where Ag is gross cross-sectional area, and fc′ is the specified concrete compressive strength (34 MPa). Because axial force in the middle and lower portions of the CIP region is only from the gravity load and the CIP region has a solid cross section, axial force is only 0.04 Agfc′. Since high axial force typically results in low ductility capacity and the ultimate state of the column is controlled by the CIP region rather than the precast region, high axial force in the precast region has little influence on column ductility. The Mpr at the base of the CIP region is calculated as 3,160 kN-m. The corresponding moment at joint CIP-S1 of the precast region is 2,229 kN-m, approximately 90% of the nominal moment capacity of the joint (2,451 kN-m). Table 1 lists the material properties. The concrete compressive strength is the average strength from precast and cast-in-place regions. The actual strengths will be used in pushover analysis presented in a later section.
Material properties
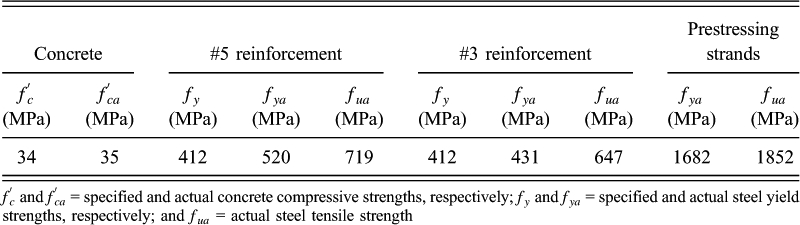
f' c and f' ca = specified and actual concrete compressive strengths, respectively; f y and f ya = specified and actual steel yield strengths, respectively; and f ua = actual steel tensile strength
Proposed Construction Method
Figure 3 conceptually illustrates the proposed construction procedure for the column. First, a rebar cage of the CIP region is formed. This cage provides mild steel reinforcement for the CIP region and uses U-loop steel ducts for post-tensioning tendons. The lower portion of the cage is then cast with the foundation (Figure 3a). After one day, a form system for the CIP column portion is constructed on top of the foundation (Figure 3b). Then, the first segment, segment S1, is placed above the rebar cage and supported by steel brackets seated on the top of the formwork. The upper portion of the rebar cage protrudes into the hollow core of segment S1. Finally, concrete is poured into the CIP region up to the hollow core of segment S1. Pouring concrete into the hollow core of segment S1 ensures a sealed connection between segment S1 and the CIP region.
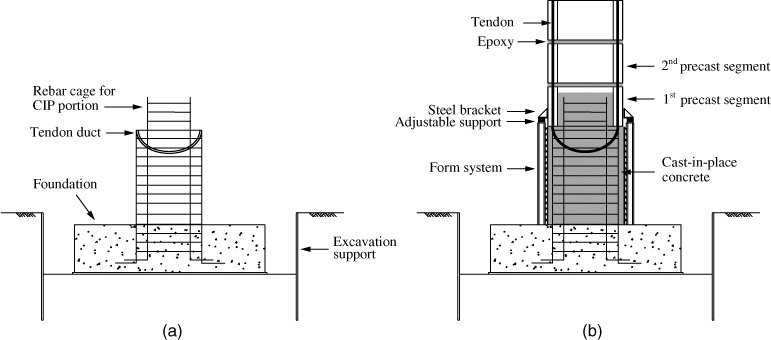
Joint construction: (a) Rebar cage for the CIP portion; (b) concreting of the CIP region and assembling of precast segments and tendons.
Test Setup and Loading Protocol
To apply gravity load, a reinforced concrete cap beam was placed on the column top. Figures 4a and 4b show two actuators placed vertically with one end fixed to the strong floor and the other end attached to the cap beam through long high-strength threaded steel bars. Each actuator applied a constant force of 650 kN to the cap beam throughout testing. Cyclic loading was applied by another actuator placed horizontally with one end fixed to the reaction wall and the other end fixed to the top solid block of the column. Cyclic loading comprised drift levels of 0.25%, 0.5%, 0.75%, 1%, 1.5%, 2%, 3%, 4%, 5%, and 5.6% as shown in Figure 4c. Each drift level was applied twice to determine strength and stiffness degradation. Because of column height and the limitations of the actuator stroke, 5.6% drift was the highest drift corresponding to actuator stroke capacity.
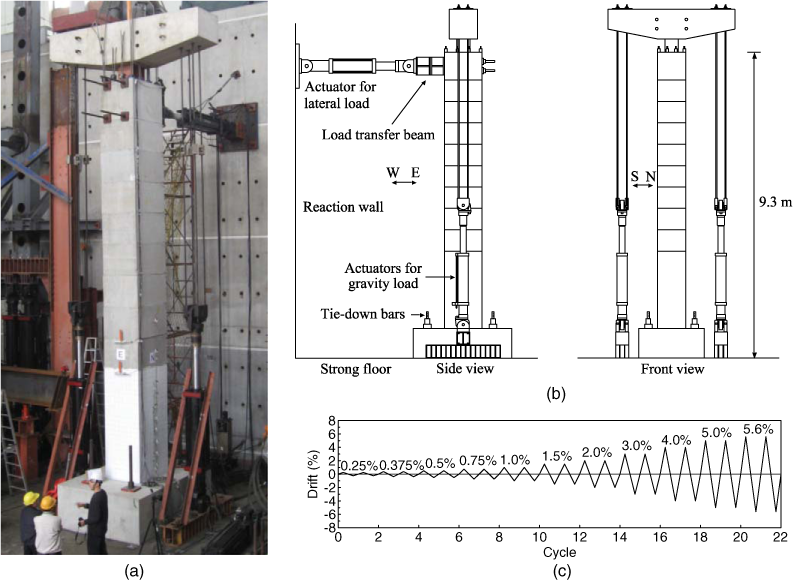
(a) Photo of test setup; (b) test setup; (c) loading history.
Test Results and Discussion
Figure 5 shows the hysteretic behavior of the column. Figure 6 shows the cracks. Concrete around the base of the CIP region started showing visible cracks at 0.5% drift. Cracks propagated gradually toward the column top as drift increased. At 3% drift, cracks stopped growing as the applied load is close to column peak strength. Significant cracks existed from the base of the CIP region extending upward approximately 1.5 m, which is approximately 64% of the CIP region or 1.3 of the section's depth (Figure 6a). The cracks are typical flexural cracks with horizontal cracking on all four column faces. Very few flexural-shear cracks existed. This was expected because the column is slender.
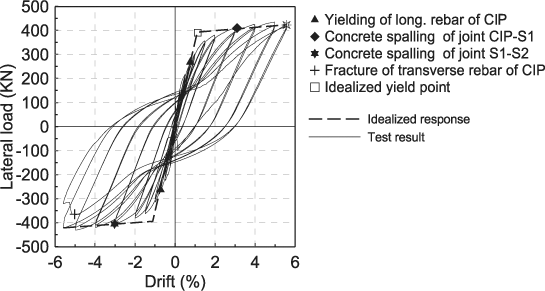
Hysteretic behavior.
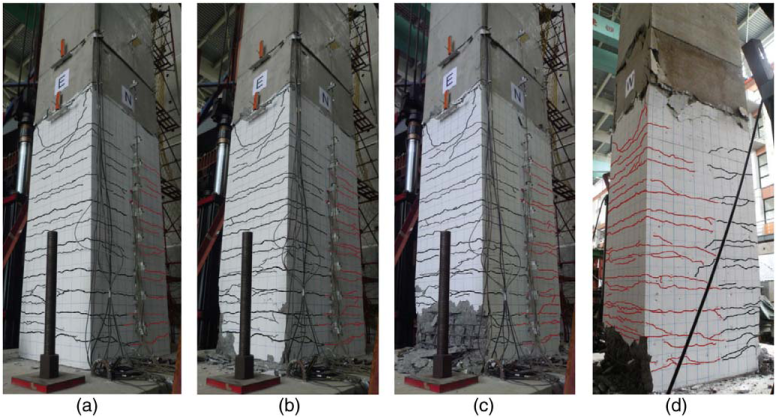
Progress of damage: (a) Cracks at the CIP region at 3% drift; (b) spalling of concrete around the CIP base at 5% drift; (c) fracture of the transverse reinforcement, subsequently buckling longitudinal reinforcement at 5.6% drift; (d) spalling of concrete around the corners of segment S1.
Concrete around the column base began spalling at 5% drift (Figure 6b). At 5.6% drift, the extent of spalling increased, exposing transverse reinforcement and longitudinal reinforcement. During the second cycle, the transverse reinforcement around the column base fractured. The longitudinal reinforcement buckled subsequently (Figure 6c), leading to a significant reduction in column lateral strength.
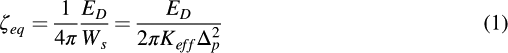
Joint CIP-S1 had a visible opening in the order of 2 mm at 2% drift. When the column failed at 5.6% drift, opening of the CIP-S1 joint increased to 5 mm, significantly larger than that of joint S1-S2 at 1 mm. As a result of joint CIP-S1 opening, which caused stress to concentrate in the compression region around the joint, spalling of the cover concrete increased gradually as drift increased. At 5.6% drift, concrete spalling extended up along the corners of segment S1 (Figure 6d). Although no reinforcement was exposed, extensive concrete spalling was observed. Figure 7 shows the curvature distribution along the CIP and segments S1 and S2. The lower 1.5 m portion of the CIP region had significant curvature deformation. Significant curvature deformation was also observed in the region around joint CIP-S1. With the curvature distribution illustrated in Figure 7, the column top displacement resulting from each segment of the curvature measurement was calculated using the second moment-area method. Figure 8 shows the displacement contributions of the CIP, CIP-S1, and S1-S2 regions relative to the total displacement contribution from these three regions. The displacement contributions from other precast regions were not measured. They were likely very small near the ultimate condition of the column compared to those from the three regions mentioned previously. From Figure 8, the CIP region occupied most of the column displacement at the ultimate condition, accounting for more than 80%. Joint CIP-S1 accounted for approximately 18% of total displacement, meaning that most deformation went to the CIP region to mobilize yielding of the mild steel reinforcement. This ensures good energy dissipation of the column, as evidenced by the fat loops of hysteretic behavior. Figure 9 shows the energy dissipation capability of the column in terms of equivalent viscous damping ratio ζeq as defined by Equation 1.
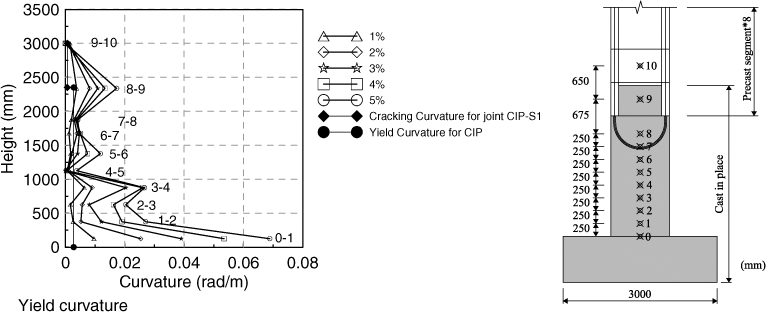
Curvature distribution.
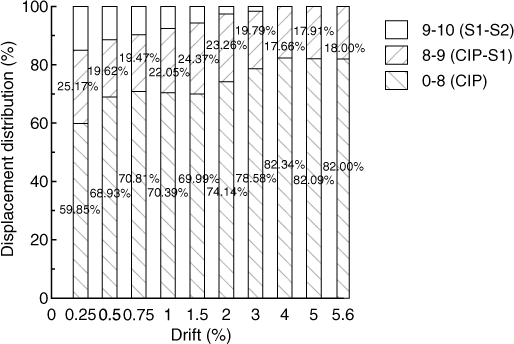
Displacement distribution.
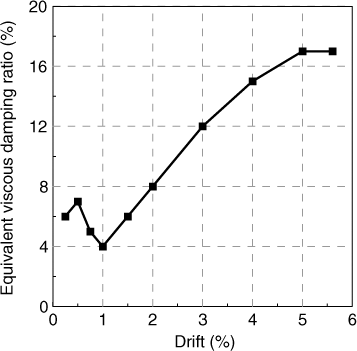
Equivalent viscous damping ratios.
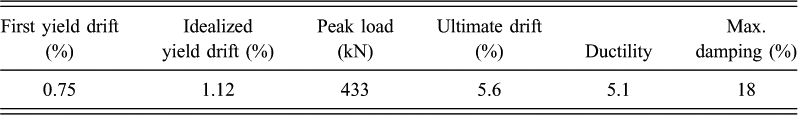
The envelope response of hysteretic behavior was idealized by a bilinear relationship with the first linear line passing through the first yield of the longitudinal mild steel reinforcement in the CIP region (determined by strain gauge reading); the second linear line is chosen, such that areas below actual and idealized responses are similar. Figure 5 shows the idealized response. The intersection point between the two linear lines of the idealized response is idealized yield point, which is at 1.12% drift. Column ductility, which is calculated by dividing ultimate drift of 5.6% by idealized drift, is 5.1, satisfying typical seismic code requirements for ductility such as the Caltrans Seismic Design Criteria (Caltrans 2006). Table 2 lists the characteristics of column hysteretic behavior.
Test results
Pushover Analysis
A pushover method is proposed and is capable of considering plastic deformation of the CIP region and opening of precast joints. This method helps designers determine whether the ultimate condition is controlled by the CIP region and assess the relative contributions of rotation of the precast joint and deformation of the CIP region to total column displacement. As the contribution to column displacement from the CIP region increases, energy dissipation capacity increases.
Plastic Rotation of Cip Region and Rotation of the Precast Joint
Estimations of the plastic rotation of the CIP region and the opening of the precast joint are critical to pushover analysis of the proposed column. Test results indicate that in the CIP region, plasticity spread over a certain length, resembling that for a conventional monolithic column. In the precast region, deformation was concentrated at the critical joint. Plastic rotation, θ
p
, in the CIP region is modeled using plastic hinge length, lp, as is commonly done in conventional monolithic column analysis. The following equations define plastic rotation (Paulay and Priestley 1992):


Moment-Curvature Analysis
In pushover analysis, one must first determine the capacity of critical sections of the column, that is, the section at the base of the CIP region and that at joint CIP-S1. The base section of the CIP region is analyzed under one axial load only, that is, gravity load. Joint CIP-S1 is analyzed under a range of axial loads based on the fact that post-tensioning force increases as the joint opens due to the use of unbonded tendons.
The compressive behavior of cover concrete and core concrete are modeled using Mander unconfined and confined models (Mander et al. 1988). Tensile strength of concrete is ignored. The longitudinal mild steel reinforcement in the CIP region is modeled using a typical stress-strain relationship with strain hardening. Strain hardening occurs when strain reaches 0.008. Ultimate strain of steel at the strain-hardening peak is 0.12. The longitudinal mild steel reinforcement in precast segments is not considered in analysis as it is not continuous across precast joints and most deformation in the precast portion is concentrated at the joint. The unbonded post-tensioning tendons are represented by axial force in analysis.
The cracking points in the CIP region and precast joint are defined when the section starts decompressing. The yield condition of the CIP region is defined when the maximum strain of the longitudinal mild steel reaches the yield point. The ultimate point of the CIP region is defined when the maximum strain in the confined concrete reaches ultimate strain, ∊cu, as defined by Equation 5 (Paulay and Priestley 1992) or when maximum strain in the longitudinal mild steel reinforcement reaches fracture strain. Fracture strain is selected as 0.06 to consider fatigue effects (Ou et al. 2010b).
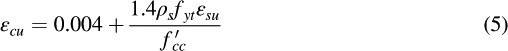
Figure 10 shows the moment-curvature relationships for the CIP region and for joint CIP-S1 under initial and final tendon forces, 3788 kN and 4115 kN, respectively. Final tendon force occurs when the ultimate condition at the base of the CIP region is reached. The moment-curvature curve of joint CIP-S1 has a clear and wide range of the descending branch before the section reaches the ultimate condition. This lack of strain-hardening behavior is due to a lack of mild steel reinforcement across the joint. Entering the descending branch will trigger a large joint opening, and decrease deformation and plasticity of the CIP region. This must be avoided. Figure 11 shows the curvature distribution along the column at cracking, yielding, and the ultimate conditions of the CIP region. A discontinuity exists between the CIP and precast region as the moment of inertia and axial force differ between these two regions (Figure 11a). At the yielding and ultimate conditions of the CIP region (Figures 11b and 11c), the curvature at joint CIP-S1 has exceeded the cracking curvature, indicating joint opening. Note that we assume the portion of the curvature in the precast region, which exceeds the cracking value, is concentrated at joint CIP-S1 (Figures 11b and 11c). Opening of joint S1–S2 is not considered, as it was insignificant in test results.
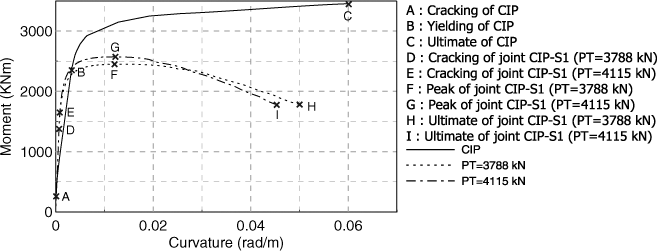
Moment-curvature relationships.
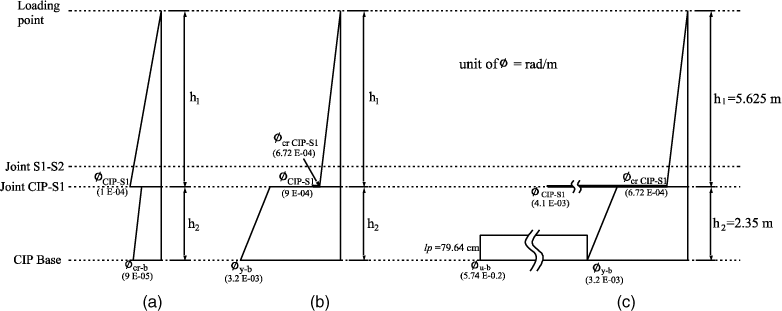
Curvature distribution: (a) Cracking of CIP; (b) yielding of CIP; (c) ultimate of CIP.
Member Analysis
In the beginning of each analytical stage (the first column in Table 3), a moment Mb is assumed to exist at the base of the CIP region and the corresponding curvature ϕb is determined from the moment-curvature relationship. Then, displacement at the loading point, Δ
total
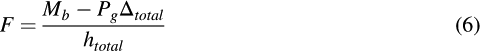
, is calculated by the second moment-area method while assuming linear variation of ϕb to zero from the base of the CIP region to the column top. The curvature distribution will be updated after the curvature at joint CIP-S1 is determined. Force at the loading point, F, and the corresponding sectional moment at joint CIP-S1, MCIP−
S
1, are calculated via Equations 6 and 7, respectively. Additional moment at joint CIP-S1 caused by change in tendon forces ΔMp due to joint opening is not considered during this calculation phase.

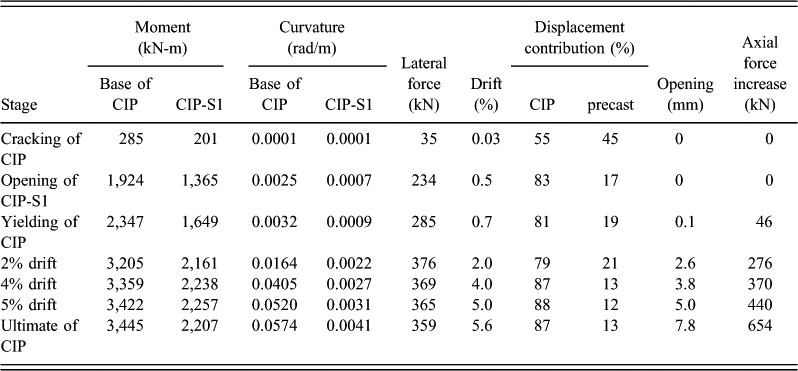
Analytical results
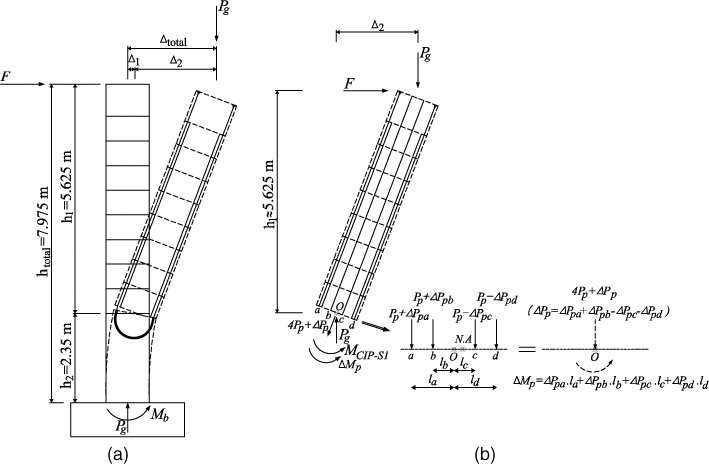
Free-body diagram: (a) For calculation of F; (b) for calculation of MS1− S 2.
When MCIP− S 1 is known, the corresponding curvature, ϕCIP− S 1, is interpolated from moment-curvature relationships obtained previously based on axial force at joint CIP-S1. The curvature distribution along the column is updated to the distribution pattern as shown in Figure 11. Joint rotation, θo, is then calculated by Equation 4. Change in tendon force on the tension side of the section is derived based on the amount of joint opening at the location of the tendon under consideration, while that on the compression side is calculated by assuming a linear distribution of joint rotation into the compression region. Through force and moment equilibriums, the increase in post-tensioning force, ΔPp, and increase in moment resistance, ΔMp, are derived (Figure 12b). Then, Δ total and Δ2 are recalculated with joint rotation and the updated curvature distribution using the second-moment area method. Finally, F and MCIP− S 1 are revised using Equations 6 and 7 with new values for Δ total , Δ2, and ΔMp. Iteration continues until the values of Δ total and ΔMp converge. Figure 13 shows a flowchart of member analysis.
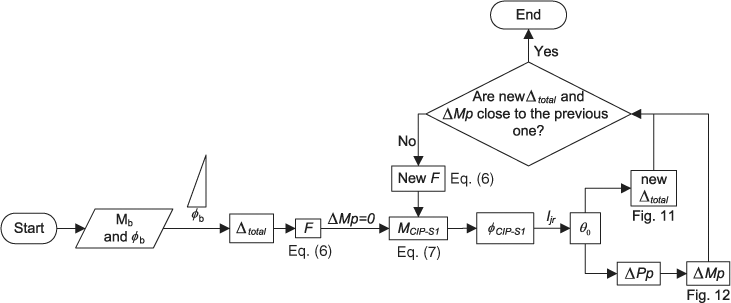
Flow-chart of pushover analysis.
Figure 14 shows the variation in axial force on the precast region. Test results indicate that initial axial force at the start of each drift loading in the precast region (denoted as the initial point in Figure 14) decreased gradually as the drift increased due to the loss of the post-tensioning force, likely due to tendons slipping at their anchorages. By adopting this initial axial force and a joint rotation length, ljr, of 3 m (approximately 0.53 of the height of the precast region or 2.6 of column depth), the analytical prediction for axial force at peak drift of each drift load (denoted as peak point in Figure 14) captures the overall behavior of experimental results. A comparison of analytical and experimental results indicates that axial force starts increasing once joint CIP-S1 opens up to the tendon location.
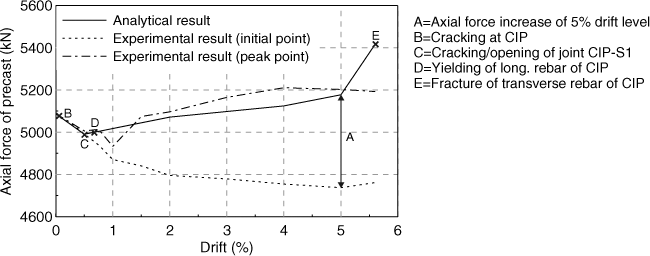
Variation in axial force on the precast region.
Table 3 lists analytical results for different stages in pushover analysis. Analysis was terminated when drift reached 5.6%, the ultimate drift of the column from test results. Analytical results indicate that maximum strain in the longitudinal reinforcement in the CIP region was 0.052. Maximum strain in confined concrete was roughly 0.01. According to test results, the ultimate condition was reached due to fracture of transverse reinforcement, which is used to define the ultimate condition of confined concrete in Equation 5. This finding suggests the ultimate strain of confined concrete was roughly 0.01. Curvature at joint CIP-S1 under the ultimate condition was around 0.004 rad/m, at which the moment-curvature relationship did not show significant softening (Figure 10). Consequently, analytical results show that roughly 87% of column displacement was from the CIP region (Table 3). This agrees well with the experimental observation (Figure 8). Figure 15 compares pushover analysis results and experimental hysteretic response. Note that the P-delta effect is included in this experimental hysteretic response. The pushover curve and the envelope of the experimental hysteretic response are in good agreement.
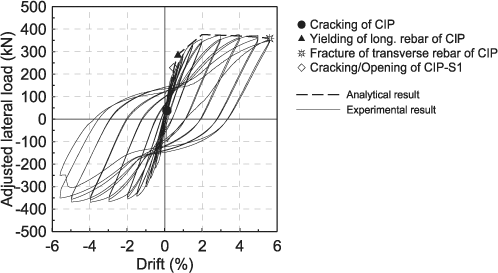
Comparison between the pushover curve and experimental hysteretic behavior.
Conclusions
A new precast segmental concrete bridge column is proposed for seismic regions. This column uses a CIP plastic hinge region to emulate the hysteretic behavior of a conventional monolithic bridge column. The major conclusions are summarized as follows.
The proposed column has excellent ductility and energy dissipation capacities, making it suitable for use in seismic regions. The ultimate condition of the column under seismic loading is governed by the plastic hinge mechanism of the CIP region. Failure mode is a typical flexural failure with fracture of the transverse reinforcement and subsequent buckling of longitudinal reinforcement at 5.6% drift. Although joint CIP-S1 exhibited a visible amount of opening and concrete spalling was observed at joint corners, the contribution of joint deformation to column displacement was not significant under the ultimate condition. A pushover analysis method was developed for the proposed column. This method considers joint opening when curvature at the critical joint exceeds cracking curvature. The amount of joint rotation is related to curvature at the joint section through the joint rotation length. Comparison of pushover analysis and test results demonstrates that the proposed analytical method can predict well the envelope response of the column, axial force variation in the precast region, and contributions of the CIP and precast regions to column displacement.
Footnotes
Acknowledgements
The authors thank the National Center for Research on Earthquake Engineering (NCREE), Taiwan Area National Expressway Engineering Bureau, and CECI Engineering Consultants for financially supporting this work. Professor Kuo-Chum Chang of NCREE is commended for his support to the work presented herein.