





Abstract
The data sets generated from E-Defense shake table experiments of a full-scale, five-story building tested with two innovative isolation systems and in the fixed-base configuration are available in the Network for Earthquake Engineering Simulation (NEES) Project Warehouse. The experiments included an integrated subassemblage of partition walls, suspended ceilings, and sprinkler piping on the fourth and fifth floors of the building; a full-story precast concrete cladding column cover; and enclosed areas staged with building contents. Totaling approximately 211 GB between three experiments, the data set includes isolator forces and displacements, floor accelerations, and story drifts, local accelerations, and relative displacements at strategic locations on the nonstructural components, as well as extensive videos and inspection photos. The project was a collaboration between U.S. researchers of the NEES Tools for Isolation and Protective Systems (TIPS) and NEES Nonstructural Grand Challenge projects and Japanese researchers from the National Research Institute of Earth Science and Disaster Prevention. Data set DOIs are 10.4231/D3X34MR7R, 10.4231/D3SB3WZ43, and 10.4231/D3NP1WJ3P.
Introduction
Base isolation is one of the most effective measures to protect building structures and their nonstructural components from earthquake ground motions. Development of modern seismic isolation techniques started in the 1960s in New Zealand (Skinner et al. 1993). Various forms of elastomeric bearings, such as natural rubber bearings, high damping rubber bearings, and lead-rubber bearings, have been commercially implemented since the 1980s. The friction pendulum bearing is a newer base isolation device that was first developed in the late 1980s (Zayas et al. 1987) and whose implementation to buildings started with a seismic retrofit project in 1994. Currently, a wide range of base isolation devices are commercially available and are being implemented in practice. However, wide acceptance of base isolation has not yet occurred, partly because their cost benefit is not well understood in the structural engineering community. Most system level testing of isolated buildings has been performed on reduced-scale bare-frame models that cannot simulate the effects of realistic floor system response or nonstructural components/contents. In addition, testing of isolated building models subjected to combined horizontal and vertical motions has been limited.
With the goal of promoting rapid adoption of base isolation systems in Japan and the United States, a full-scale, five-story, steel moment-frame building was subjected to a number of bidirectional and bidirectional-plus-vertical ground motions using the world's largest shake table. The test program was completed in August 2011 at the Hyogo Earthquake Engineering Research Center (E-Defense) of Japan's National Research Institute of Earth Science and Disaster Prevention (NIED). The project was jointly funded by the U.S. National Science Foundation (NSF) Network for Earthquake Engineering Simulation (NEES) research program and NIED. The testbed specimen was shaken with two seismic isolation systems and in the fixed-base configuration. In total, the building structure was subjected to 41 sinusoidal and earthquake simulations including 13 distinct earthquake records.
The primary objective of the test program was to demonstrate, at full scale, the effectiveness of base isolation to protect the building structure, the nonstructural components, and the contents in very rare earthquakes. The nonstructural components included an integrated system of interior walls, suspended ceilings, fire-sprinkler piping, and a precast concrete cladding column cover, all of which were assembled using U.S. construction techniques. These nonstructural components, as well as two enclosed areas staged with contents, were located on the fourth and fifth floors of the building.
The two isolation systems were (1) triple friction pendulum (TP) bearings and (2) a hybrid combination of lead-rubber (LR) bearings and cross linear (CL) bearings. Each isolation system design was developed by the project team in conjunction with the bearing supplier to meet distinct objectives, and the two systems were not developed with the objective of being compared. The recently developed TP bearings were selected for testing, because they provide a very large displacement capacity and can be designed under the Performance Based Earthquake Engineering (PBEE) paradigm to target various levels of protection under multiple earthquake scenarios (Fenz and Constantinou 2008, Morgan and Mahin 2011). Given the history of investigation of elastomeric bearings for nuclear applications, the hybrid isolation system evolved from the need to verify the stability and load-carrying capacity of elastomeric bearings at displacements representative of extended design basis ground motions. The isolation systems were strategically selected to accommodate a relatively lightweight (relative to typical bearing design) and asymmetric superstructure in order to demonstrate the general ability to extend seismic resiliency to challenging configurations.
The earthquake excitations were selected to excite the isolation devices close to their physical limit of travel, along with stability considerations specific to the hybrid system. A final objective was to determine the influence of vertical excitations on the performance of seismically isolated buildings. In all three support configurations, the building was subjected to a variety of XY (horizontal only) and three-dimensional (3-D) excitations, some with large vertical components.
The objective of this paper is to describe the experiments and the generated data sets and to highlight the potential for reuse of this data by the earthquake engineering community. The data sets generated from this investigation are permanently archived and publicly accessible in the NEES Project Warehouse under NEES TIPS/Project No. 571. The data and metadata corresponding to each building configuration have been archived as separate standalone experiments, as follows: Experiment 3 – TP bearing configuration (Ryan et al. 2013a), Experiment 4 – hybrid LR/CL bearing configuration (Ryan et al. 2013b), and Experiment 5 – fixed-base configuration (Ryan et al. 2013c). Each data set includes unprocessed and derived data, metadata pertinent to the experiment, and supporting documentation to assist with interpretation of the data. The other experiments archived under Project No. 571 are independent of the full scale test program and thus are not described here.
Experimental Setup and Metadata
The testbed specimen was a five-story, two-bay-by-two-bay steel moment frame building (Figure 1a) constructed for a previous test program, which had been designed and detailed according to Japanese code and design practice (Kasai et al. 2010). The building specimen was approximately 16 m (52.5 ft) tall and 10 by 12 m (32.8 by 39.3 ft) in plan with an asymmetric bay configuration in the long direction (Figures 1b and 1c). All primary beam-column connections were fully welded, restrained moment connections. The floor system consisted of reinforced concrete slabs cast on corrugated metal decking in floors two to five and cast on a flat steel deck on the roof. The concrete slabs were connected to primary beams by shear studs to provide composite behavior. For the NEES/E-Defense program, steel plates weighing 535 kN (120 kips) were placed on the roof in an irregular configuration to enhance the asymmetry of the building specimen. Including the additional roof mass and the participating mass at the base level, the superstructure weighed about 5,300 kN (1,200 kips). The natural period of the building in the fixed-base configuration was about 0.68 sec, determined by system identification from white noise shaking.
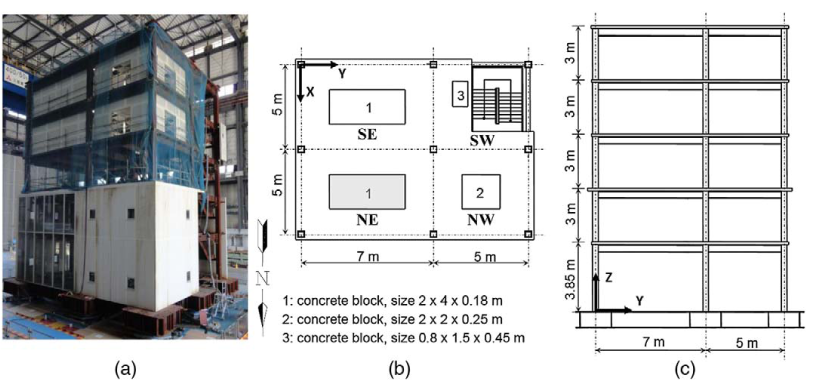
(a) Five-story steel moment frame specimen, (b) typical plan view from floors two to five, and (c) elevation view.
Isolation Systems
The design of the two isolation systems was influenced by the building's light weight and asymmetry. The TP isolation system incorporated nine identical TP bearings (Figure 2a), one beneath each column, as shown in the plan layout in Figure 3. The properties of these isolators were chosen to accommodate the largest near-fault ground motions that could be replicated by the E-Defense shake table. The bearings were 1.4 m (4.6 ft) in diameter, with a displacement capacity of 1.13 m (3.7 ft) at a base shear coefficient V/W = 0.275, where V = isolator shear force and W = axial force due to building self-weight. Although the target peak displacement of the TP bearings was about 1 m (3.3 ft), a peak displacement of about 0.7 m (2.3 ft) was observed during testing.
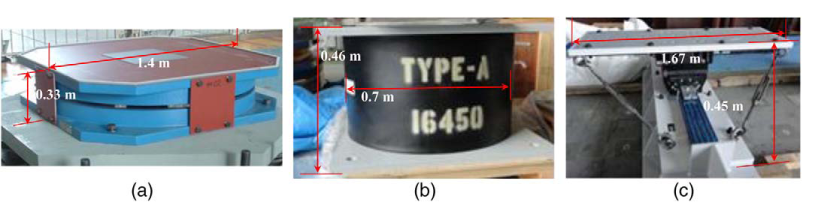
(a) TP bearing, (b) LR bearing, and (c) CL bearing.
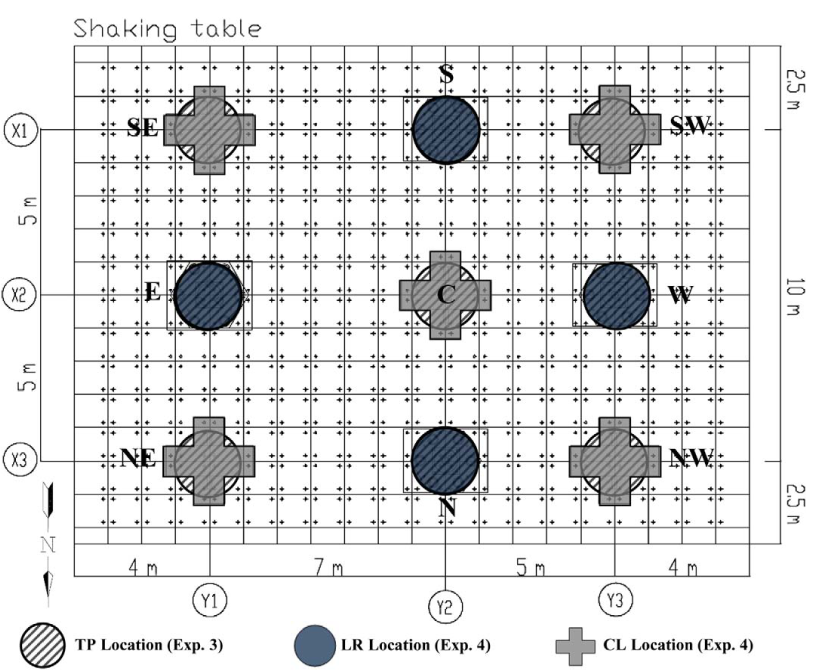
Isolation system layout for the TP bearing and the LR/CL bearing experiments.
The second isolation system, featuring 4 LR bearings (Figure 2b), was designed to accommodate the extended design basis (DB) shaking at a representative nuclear power plant site with soft soil in the eastern United States. For nuclear plant design, the DB earthquake shaking is associated with a mean annual frequency of exceedance (MAFE) of no less than 1 × 10⁻⁴ (return period of 10,000 years) while the extended DB is associated with a MAFE of 1 × 10⁻⁵ (a return period of 100,000 years). To provide the desired isolation period shift and accommodate the overturning moments, the LR bearings were supplemented with 5 CL bearings (Figure 2c). The LR bearings were each 0.7 m (2.3 ft) in diameter with a 102 mm (4 in.) lead core and a shape factor S = 29. The CL bearings are essentially low friction sliders that share the vertical load with the LR bearings without increasing the stiffness or base shear of the isolation system. Furthermore, the CL bearings enhanced the system stability by allowing a redistribution of axial forces between LR and CL bearings while also providing tension resistance. The placement of the LR and CL bearings is indicated in Figure 3.
Each TP and LR bearing was supported on an array of load cells assembled between two custom-made steel plates. These load cell assemblies, isolators, and finally the testbed building were bolted to the shake table and to each other in sequence. The CL bearings were constructed on built-up I beams and therefore bolted directly to the shake table. The testbed building was constructed on column base spreader assemblies (Figure 1a) and bolted directly to the shake table for the fixed-base configuration.
Nonstructural Components
A partition-ceiling-sprinkler piping subassembly was designed and installed in a nearly identical configuration over the fourth and fifth floors of the building specimen, which were expected to experience the maximum floor accelerations (Soroushian et al. 2012). Each floor subassembly included approximately 90 m (300 ft) of partition walls, 83.6 m2 (900 ft2) of suspended ceiling with lay-in tiles, and fire sprinkler piping with a riser pipe, a main run, and three sprinkler branch lines that included drops. The suspended ceiling system was designed per ASTM E580/E580M-11ae1 standards (ASTM 2011). The grid was constructed using an exposed tee system with main runners and cross tees supported by suspension wires. The main runners and cross tees were attached to the wall molding using seismic clips with different attachment details on opposing boundaries. The piping system included one 76 mm (3 in.) diameter riser pipe, one 64 mm (2.5 in.) diameter main run, and three (North-South) 32 mm (1.25 in.) and 25 mm (1 in.) diameter branch lines per floor. The branch lines incorporated straight drops, armover drops, and flexible hose drops. The piping system was supported by sway bracing at the ends of the main run and diagonal splay wires at the ends of the branch lines. The partition wall details were selected based on the most commonly used commercial and institutional partition walls. Full connection detailing was provided for fourth floor partitions while slip track connection detailing (which allows vertical movement of the top track relative to the studs and gypsum board) was provided for fifth floor partitions. Full height partitions were approximately 2.7 m (9 ft) tall. Further details of the nonstructural components can be found in Soroushian et al. (2012).
Two areas enclosed by self-standing partial height partition walls were used to stage a hospital-themed and an office-themed room with a variety of furniture and other loose items (Figure 4). Both the hospital room at the fourth floor and the office room at the fifth floor were built on top of the concrete weight block highlighted and designated as “1” on Figure 1b.
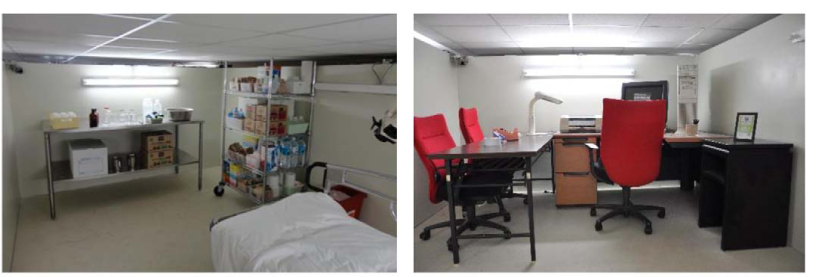
(a) Hospital room (fourth floor) and (b) office room (fifth floor).
Two full-story precast concrete column cover panels were fabricated and tested to evaluate the effectiveness of slotted steel connections to allow inter-story drift. The return cover 3-D shaped panel and flat panel were installed at the southwest corner between the fourth and fifth floors. The cladding panels, designed according to U.S. practice, represent one type of standard façade that is designed to accommodate drift through racking of individual panels. A vertical seismic joint was installed between the two panels. Further details describing the design and testing of the cladding panels can be found in McMullin et al. (2012).
Accessing Metadata
Metadata conveying the details of the experimental setup can be accessed directly in the NEES Project Warehouse, Project No. 571, under the “Experiments” tab of each experiment, as shown in Figure 5. The experimental report summarizes the test setup, instrumentation, test schedule, data organization, and derived responses and should be consulted first by anyone contemplating reuse of the data. The “Drawings” subfolder (see Figure 5), also filed under “Documentation,” includes selected drawings of the specimen and bearing setup (as applicable), sensor layout, and the global coordinate system. Complete design and construction drawings are saved as pdf documents within the “Documentation” section, as indicated in Figure 5. Other experimental setup metadata under “Documentation” include applicable drawings and specifications for the testbed specimen (modified for each test configuration), isolation bearings, connection assembly, partition-ceiling-piping subassem-blies, and cladding panel subassemblies. A description of the testing facility is included, since it is not part of the NEES network of experimental facilities. Relevant published papers and reports will be maintained in a “Papers” subfolder of each experiment, under “Documentation” (Figure 5).
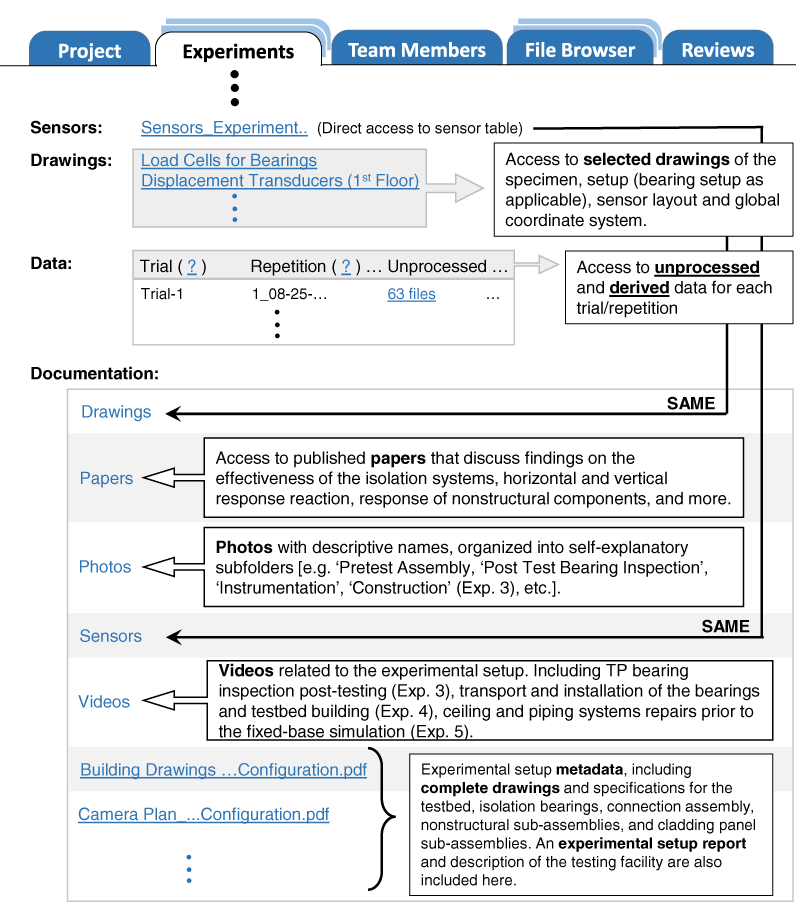
Organization of experiment-specific data and metadata within the project.
Photos with descriptive names have been organized into self-explanatory subfolders within the “Documentation/Photos” folder of each experiment (see Figure 5). Examples of photo subfolders include “Pretest Assembly” and “Post Test Bearing Inspection.” For Experiment 3, a “Construction” subfolder documents the construction and assembly process preceding the formal start of the series of experiments by about two months and is organized by date. Select videos related to the experimental setup are found in the “Documentation/Videos/Movies” folder of each experiment (Figure 5). These videos include inspection of the TP bearings following their removal from the shake table (Exp. 3), scenes from transport and installation of the bearings and testbed building (Exp. 4), and documentation of repairs to the ceiling and piping systems preceding the simulation of the fixed-base configuration (Exp. 5).
Instrumentation and Data Collection
The response of the structure and nonstructural components was measured with 642, 482, and 387 channels of instrumentation for Experiment 3, Experiment 4, and Experiment 5, respectively. Base displacements, from which isolator lateral deformations were computed, were recorded using DTP-D-5KS wire potentiometers with a stroke limit of ±2.5 m for both isolation configurations. Vertical isolator displacements were measured by laser transducers in three corner bearings for Experiment 3 (TP bearing configuration) only. Forces in two lateral directions and the vertical direction were recorded by seven or nine tri-directional load cells, contained within the load cell assemblies described earlier, for each TP and LR bearing. Forces in the CL bearings (Exp. 4) were not measured.
For all three configurations, X- and Y-direction story drifts were recorded at two locations (SE and NW quadrant of Figure 1b) on every floor by laser displacement transducers attached to a rigid vertical truss and directed to a reflecting plate hung from the beam of the floor above. Floor accelerations were recorded at each level by 3-D accelerometers attached at the SE, NE, and NW columns. Moreover, vertical slab vibrations were recorded in several of the floors. Strain gages were attached to the NE corner column throughout the height of the building. Accelerometers and displacement transducers were strategically located to measure responses of the nonstructural components including accelerations of the ceiling grid members, ceiling panels, and ceiling braces; accelerations of the piping system and sprinkler heads; accelerations at the tops of partition walls; partition wall drifts; and relative displacements between the ceiling grid and the partition walls. Video cameras were placed to record movement of the following: the whole building from various viewpoints, the isolators (as applicable), the nonstructural components, and the staged contents. These videos have been archived for every trial and repetition, as noted in the following section, “Unprocessed Data.”
Aside from the metadata previously noted, also included in the “Documentation” folder (Figure 5) are instrumentation drawings for the structure, the partition-ceiling-piping subas-semblies, and the cladding panel subassemblies (each in a separate file) and a camera plan. Several of the cameras were fixed at permanent locations in the E-Defense laboratory and are not shown in the camera plan. In addition, photos of each installed sensor have been archived in the experiment “Photos/Instrumentation” subfolder, also under “Documentation” (Figure 5).
A sensor table can be accessed from both the “Experiments” tab, under “Sensors,” and the “Documentation/Sensors” subfolder (Figure 5), and it lists all the sensors and data channels used in the experiment. The data were routed simultaneously through a series of junction boxes that collected data from up to 64 channels, and the organization of data reflects this format. For each channel, the sensor table includes channel number, channel name, sensor label, sensor type, global coordinates, measurement unit, orientation, and instrument serial number. The naming convention for the channel name and channel number is described in Figure 6. The global coordinate system used for the location of each sensor reported in the sensor table is defined at the base of the southeast column, as shown in Figures 1b and 1c. A supplementary drawing showing the coordinate system can be found in the experiment “Document/Drawings” subfolder.
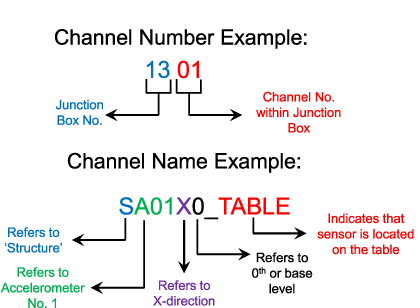
Channel number and name examples found in the experiment sensor table.
Supplementary non-NEES compliant sensor tables, prepared and used by the project team during the test program, have been archived in each experiment “Documentation” folder under the name of “Channels_Summary_(Experiment).xls.” These tables (spreadsheets) are an additional resource to understand the data organization. Each spreadsheet contains three individual sheets: “Table of Instruments” (summary of instruments used), “Sensor List” (alternative sensor table), and “Data Acquisition Chart.” Importantly, the “Data Acquisition Chart” sequentially lists the channels in each junction box by channel name. This quick reference chart is the most convenient way to identify the channels that are located in a particular unprocessed data file.
Unprocessed Data
The unprocessed data is located at the trial/repetition level of each experiment and can be found in the “Unprocessed Data” subfolder, under “Data” as shown in Figure 5. For each trial/repetition, the unprocessed data includes sensor data, videos, and photos if applicable. For each repetition, the sensor data is organized into files corresponding to junction boxes, and each file contains data for up to 64 channels. The last two digits of the file name that precede. csv refer to the junction box number. The data were recorded at a sampling rate of 1000 Hz and output directly in engineering units. The first column of each data file stores the time, followed by data for junction box channels 1 to 64 in columns 2 to 65. There are 11, 10, and 9 junction box files for Experiment 3 (TP bearing configuration), Experiment 4 (hybrid LR/CL bearing configuration), and Experiment 5 (fixed-base configuration), respectively. The videos are found in the “Unprocessed Data/Videos/Movies” subfolder and correspond to the individual cameras named in the camera plan, where SC, NC, and EC indicate cameras recording the responses of the structural system, the partition-ceiling-piping subassemblies, and the corner cladding panel subassembly, respectively.
The simulation plan varied significantly for each experiment according to the independent objectives. All experiments included bidirectional as well as 3-D recorded motions. The record selection for Experiment 3 (TP bearing configuration) was dominated by strong near-fault records, such as 1994 Northridge at Rinaldi Rec. Sta. (RRS) and Sylmar Sta. and 1995 Kobe at Takatori Sta. For Experiment 4 (hybrid LR/CL bearing configuration), the ground motions were dominated by simulated motions (seeded from recorded motions) that were developed to represent the site spectra at selected nuclear sites and scaled up to meet the target displacement of the isolation system. Sine wave excitations were applied to both isolation configurations for bearing characterization. With limited tests available for Experiment 5 (fixed-base configuration), the records were selected to allow direct response comparisons with the isolation configurations. Three records were repeated in each configuration (1987 Superstition Hills at Westmorland, 2011 Tohoku at Iwanuma Sta., and 1994 Northridge at RRS), although the latter two records were applied at lower scale factors in Experiment 5 to minimize the risk of structural yielding. Unidirectional and 3-D white noise excitations were applied throughout Experiment 5 for system identification.
The RRS record induced the largest recorded horizontal accelerations at the table level for each experiment, which were about 1.2g for both Experiments 3 and 4, and 0.4g for Experiment 5. However, the motions that induced the largest displacement demands in the isolators were 1978 Tabas at Tabas Station for Experiment 3 (0.7 m or 28 in.) and the simulation at the Diablo Canyon site for Experiment 4 (0.55 m or 22 in.).
In a given experiment, any change in target motion or scale factor is characterized as a new trial, whereas a repeated test with the same target motion is characterized as a repetition. In summary, the data are stored in 21 trials for Experiment 3, 13 trials for Experiment 4, and 9 trials for Experiment 5. An overview of the trials and repetitions is given in Table 1. A comprehensive test log indicating the chronological sequence of applied motions, which is not necessarily reflected in the organization of trials and repetitions, is included in each Experimental Report and in Ryan et al. (2013d).
Overview of the test program for each experiment as organized under the unprocessed data
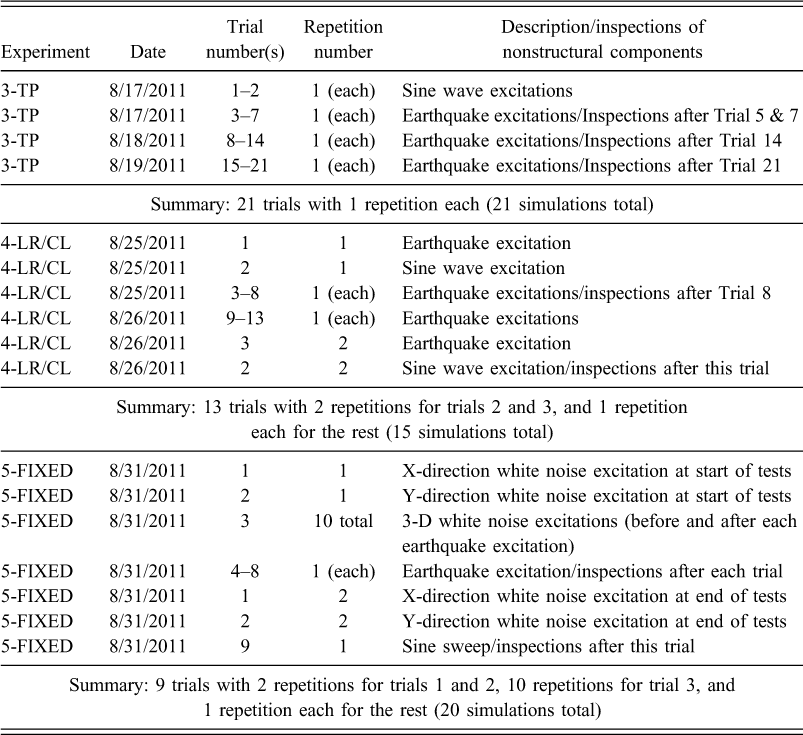
The nonstructural components and contents of the fourth and fifth floor were inspected after select trial/repetition sequences. Specifically, for Experiment 3 (TP bearings), the floors were inspected after Trial 5 and at the end of every test day (trials 7, 14, 21). For Experiment 4 (hybrid isolation), the floors were inspected at the end of the two test days (Trial 8/Rep. 1 and Trial 2/Rep. 2). For Experiment 5 (fixed-base), the floors were inspected after each earthquake trial/repetition (Trials 4–8) (See Table 1). Technically, these inspections took place after the follow-up 3-D white noise excitation, but the inspection photos have been associated with the preceding earthquake motion for which the shaking was stronger. All descriptively named inspection photos are located under the respective trial/repetition in the “Unprocessed Data/Photos” subfolder, subcategorized into “Ceilings,” “Contents,” “Partition Walls 4” (fourth floor), “Partition Walls 5” (fifth floor), and “Piping.” With the exception of Experiment 3/Trial 5, after each inspection the following repairs were made as needed: contents were reset, dislodged and fallen ceiling panels were reset, deformed/buckled ceiling grid members were replaced, pipes were reinforced with ropes at the locations of broken pipe hangers. Additional measures were taken prior to the start of Experiment 5 to strengthen the ceiling system and reinforce the piping, which are described in several video clips located in the “Documentation/Videos/Movies” folder of Experiment 5. Despite these measures, cumulative damage to the nonstructural systems throughout the experiment sequence should be considered when evaluating the nonstructural response.
Derived Data
Relevant responses have been derived from multiple channels of the unprocessed data for each trial/repetition, except for the nonearthquake excitations of the fixed-base configuration (Exp. 5/Trials 1–3, 9). The derived responses, which can be found under “Data/Derived Data” at each experiment trial/repetition level in the “Experiments” tab (Figure 5), include bearing displacements and forces (Exp. 3 and 4 only), floor accelerations and story drifts at the geometric center of the building, and moments and axial forces in the northeast (NE) corner column (see Figure 1b). To derive the responses, all recorded data were filtered using a low-pass Butterworth filter with a cut-off frequency of 25 Hz. These derived responses were not zeroed after every trial and thus reflect accumulation of forces or displacements over the course of the experiment.
The horizontal displacements in each isolator were computed from the measured displacements in the wire pots, accounting for geometric effects as a result of the large displacement demand in the bearings. The X- and Y-components of displacement were determined by subtracting the original coordinates of the isolators (from the beginning of the experiment) from the displaced coordinates. Vertical isolator displacements were only measured at the NE, NW, and SE located TP bearings (see Figure 3). For each bearing, two laser transducers were attached to frames that extended off the side of the building on either side of the bearing, and the total vertical displacement was computed as the average of the two channels. The laser transducers measured the total vertical movement, which is a combination of (a) movement along the curved surface of the bearing, (b) compression related displacement, and (c) uplift. The X-, Y-, and Z-displacements for each isolator are stored in files named “DIsoX.csv,” where X is the corresponding location of the isolator (e.g., NE). If the vertical displacement was not measured, this component is stored as a column of zeros.
For each TP and LR bearing (Exp. 3 and 4), the X-, Y-, and Z-components of the recorded dynamic force from all load cells, which were zeroed prior to the start of each experiment, were summed to derive the corresponding dynamic reaction at the location of the load cells. This reaction was then modified by the inertia forces of the connection plate, recorded by accelerometers, and the bottom bearing plate, to derive the dynamic reaction at the isolator level. The dynamic reactions in the Z-direction were added to the static weights, determined by different methods for Experiments 3 and 4. These derived X-, Y-, and Z-reactions for each isolator are stored in files named “RIsoX.csv,” where X is the corresponding location of the isolator (Table 2). Using the derived horizontal displacements and reaction forces discussed above, the force versus displacement or hysteresis loops from one of the trials is plotted for each LR bearing in the X-direction (Figure 7). The same derived data could be used to plot these bearing force-displacement relations in the Y-direction.
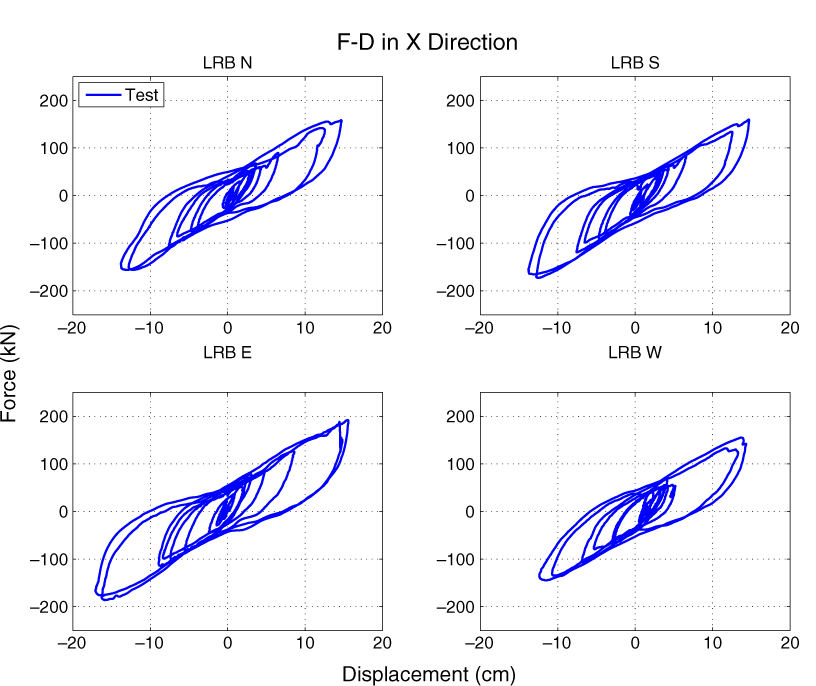
Sample force-displacement or hysteresis in x-direction for each LR bearing for a simulated earthquake.
Derived data files channel names

Column moments and internal forces in the NE column were derived from the strain gage data. Assuming linear-elastic response, these forces were obtained from the axial strains recorded at various section locations and then extrapolated to the column ends. For each trial/repetition, these forces are stored in a file named “ColumnEndForce.csv.” The channels within this file are listed in Table 2.
Floor accelerations at the geometric center of the building plan were derived for every floor level. The horizontal accelerations were determined by appropriate weighting of the measured accelerations at the SE, NW, and NE corners of the floor near the columns (see Figure 1b). The vertical acceleration was computed by averaging the vertical acceleration recorded at these three corners, which represents the acceleration propagated through the columns and not in the middle of the floors. Accelerations at the geometric center of the shake table were computed as the average of accelerations measured by four tri-directional accelerometers installed at the SE, NE, NW, and SW corners of the shake table. For each trial/repetition, the derived accelerations are stored in a file named “FloorAcc.csv” (Table 2).
Story drifts at the geometric center of the building plan were derived for every story. The story drifts in the X- and Y-directions were interpolated from measured story drifts at locations SE and NW from the geometric center (refer to Figure 1b). For every trial/repetition, the derived drifts are stored in a file named “FloorDrift.csv” (Table 2).
A more detailed explanation of the algorithms used to derive each response is included in Chapter 3 of the Experimental Report in the “Documentation” folder of each experiment. Published paper drafts that provide a more thorough explanation of our interpretation of the results are also included in this folder. These papers discuss findings on the effectiveness of the isolation systems, horizontal and vertical response interaction, response of nonstruc-tural components, and more.
Potential for Data Reuse and Concluding Remarks
The comprehensive data set (about 211 GB) from the three experiment configurations that allows for direct comparison of the seismic response of a conventional lateral system to seismic protective systems at a realistic scale and large seismic intensity has many opportunities for data reuse. First, researchers have access to extensive system-level dynamic data with which to develop and calibrate new component models. Examples include models for bearing response (force versus displacement), seismic-induced floor vibration, and various parts of the nonstructural components (e.g., the partition walls, ceilings, and piping alone or interacting together). This usage also extends to the structural system, which responded essentially in the linear elastic range but was influenced by the energy dissipation properties of the nonstructural components as well as the structural materials. Second, engineers may wish to compare the dynamic bearing data to the cyclic data generated during prototype and production tests or assess the suitability of modeling assumptions and reliability of software programs to estimate bearing and structural responses for design. Finally, the data set allows for easy visualization of protective system response for educational purposes.
In considering the potential for data reuse, note that the data set is unique with respect to its scale, integration of floor system effects, and nonstructural component/content response. Of the handful of full-scale multistory building strong motion experiments conducted at E-Defense and elsewhere, this one, to our knowledge, incorporated the greatest variety of strong, multicomponent (3-D) earthquake records. This combination of factors means that a compelling story buried in the data is still being unearthed. By archiving and thoroughly documenting the data from these experiments in a reliable and reputable database (NEEShub), we have developed a resource that can pay dividends well beyond its initial use by the project team.
Footnotes
Acknowledgements
The authors acknowledge several individuals that contributed directly to the generation and archiving of the described data sets: Eiji Sato and Tomohiro Sasaki of E-Defense, Taichiro Okazaki of Hokkaido University, Nhan Dao of Ho Chi Minh City University of Architecture, and Siavash Soroushian and Camila Coria of University of Nevada, Reno. Funding for the experiments described in this paper was provided by the National Science Foundation through Grants No. CMMI-1113275 and CMMI-0721399, U.S. Nuclear Regulatory Commission through Contract NRC-HQ-11-C-04-0067, and National Institute of Earth Science and Disaster. Products were donated by Earthquake Protection Systems, Dynamic Isolation Systems, THK, Aseismic Devices Company, Hilti, USG Building Systems, Cemco Steel, Victaulic, and Tolco. The authors are grateful for this support.