
Abstract
This paper describes four data sets of cyclic simple shear (CSS) tests under modulated harmonic and transient loadings. The CSS tests were performed on reconstituted Nevada Sand specimens prepared by the wet sedimentation method at target relative densities of 40% and 70%. The data sets are freely available through the George E. Brown, Jr. Network for Earthquake Engineering Simulation data repository (NEEShub.org; database DOIs: 10.4231/D3W66991S, 10.4231/D30Z70X6F, 10.4231/D34Q7QR0T, 10.4231/D3RJ48W0Z). This paper describes the experimental apparatus, documentation of the specimen preparation procedures, loading histories, and summarizes the available CSS test data. The database includes 106 CSS tests and provides valuable information that can systematically illustrate the response of sand subjected to transient loadings before and after initiation of liquefaction; such a public database had been virtually non-existent until now.
Introduction
Soil liquefaction is a major urban seismic risk that has been the focus of extensive research over the past 50 years following the devastating earthquakes of 1964 in Alaska and Niigata, Japan. During a seismic event, seismic waves produce excess pore water pressure in saturated sandy soils. At level sites, seismic waves are frequently idealized as vertically propagating shear waves. Liquefaction is triggered when the generated excess pore pressure approaches or equals the initial vertical effective stress. The most common liquefaction evaluation procedure, the simplified method of Seed and Idriss (1971), was developed over 40 years ago and, while having undergone multiple modifications, the basic framework remains the same. The procedure adopts a deterministic approach to evaluate the liquefaction potential of a given site by comparing soil resistance (capacity) to seismic loading (demand), and characterizes liquefaction potential with a factor of safety (FS). While major refinements have made on the capacity side of the evaluation, the demand side has received much less attention. The loading produced by a complicated transient ground motion is still commonly characterized by a single point (the peak ground acceleration, PGA) that is modified to account for the duration of the event using a simple approximation based on earthquake magnitude, that is, the magnitude scaling factor (MSF).
Seismic records from the past have shown that earthquake loading histories encompass a wide range of amplitudes, frequency contents, and durations. Since PGA and MSF provide very simple representations of those characteristics, other ground motion intensity measures (IMs) have been investigated with the goal of providing a more accurate evaluation of liquefaction potential. These include Arias Intensity (Kayen and Mitchell 1997), CAV5 (Kramer and Mitchell 2006), and normalized energy demand (Green 2001). The parameters PGA and MSF can be combined into a magnitude-corrected peak acceleration, PGA M = PGA/MSF. In the past decade, the development of modern performance-based earthquake engineering (PBEE), which requires probabilistic characterization of earthquake loading and liquefaction resistance, has highlighted the importance of uncertainty in liquefaction hazard evaluation (Kramer and Mayfield 2007, Franke and Kramer 2014). Increased uncertainty in a liquefaction evaluation under the PBEE framework will decrease the factor of safety at a given hazard level. Therefore, using a more accurate IM to characterize earthquake loading will lead to higher factors of safety at the same hazard level (or return period). Numerical analyses (Kramer and Mitchell 2006, Abegg 2010) have showed that certain IMs can be more effective in predicting liquefaction potential (excess pore pressure generation) and its effects, but experimental validation using realistic ground motion records is still missing. With the advancement in testing equipment, there is an opportunity (and a need) for establishing an experimental program that focus on the characterization of sand response under realistic earthquake loading.
Overview of the Project
In view of the problems mentioned above, a research project “NEESR-CR: Evolutionary Intensity Measures for More Accurate and Informative Liquefaction Hazard Evaluation” was funded by the U.S. National Science Foundation (NSF) with the goal of improving liquefaction evaluation procedures. The project sought to identify time-varying IMs that could effectively predict pore pressure generation, or shear strain development, and lead to explicit estimation of timing of liquefaction under a design ground motion. The timing of liquefaction is a potentially important factor for evaluating the effects of liquefaction, and is not considered in the current stress-based procedure. For this study, liquefaction initiation is defined as lose of effective stresses when excess pore pressure ratio, r u (ratio of excess pore pressure to vertical effective stress at the end of consolidation) is equal to one. The research project generated a large amount of experimental data using centrifuge model testing (Experiments 1 to 6) and cyclic simple shear (CSS) testing (Experiments 7 to 10) with realistic, transient loading time histories. These experiments provide information of the soil response, including excess pore pressure generation and permanent deformation, under realistic seismic loading scenarios. The database is very useful for identifying the optimal ground motion IMs for better seismic loading characterization. The experimental database described here is also valuable for calibration and validation of constitutive models and numerical analyses.
This paper describes only the CSS data sets generated in the aforementioned NSF project. The CSS tests were conducted at The University of Texas at Austin, utilizing a modified GCTS manufactured CSS apparatus. In total, 106 final tests (excluding all fine-tuning tests) were conducted on reconstituted Nevada sand specimens at two different density ranges averaging 45% and 80%. All test specimens were reconstituted by a water sedimentation method (Kwan 2015), and subjected to two main types of undrained loadings: (1) modulated sinusoid with a tapered-up or tapered-down shape stress histories, and (2) scaled ground motion histories.
Although presenting analyses conducted on these CSS tests is not the focus of this paper, the authors note that the database has been analyzed for the identification of optimal IMs by evaluating their effectiveness predicting various engineering demand parameters such as excess pore pressure and shear strain (Kwan 2015). The authors believe that the data sets will further support the development of improved and more informative procedures for evaluation of liquefaction potential and the effects of liquefaction. Therefore, the purpose of this paper is to provide documentation of data for other researchers to advance understanding of soil liquefaction.
Experiment Setup
The transient loading CSS testing program was conducted using the University of Texas Cyclic Simple Shear (UTCSS) Apparatus (Figure 1). The apparatus was originally manufactured by the Geotechnical Consulting and Testing System (GCTS), and has been modified for the specific requirements of this project. Since the tests were performed under true undrained conditions (rather than constant volume), it was important to maintain a constant total vertical stress during the consolidation and shearing stage that is not affected by vertical rocking. Therefore, the vertical hydraulic actuator was replaced by a pneumatic piston in order to provide a more stable vertical stress, particularly during the shearing stage. The UTCSS setup consists of two vertical LVDTs (Figure 2): one at the vertical actuator (sensor #2), and a second one at the edge of the platen along (sensor #8). The two sensors are aligned with the direction of shaking and therefore, the difference in their output is a direct measure of the difference in vertical displacement between the center and edge of the top platen. For this project, the amount of rocking is calculated using the following equation:

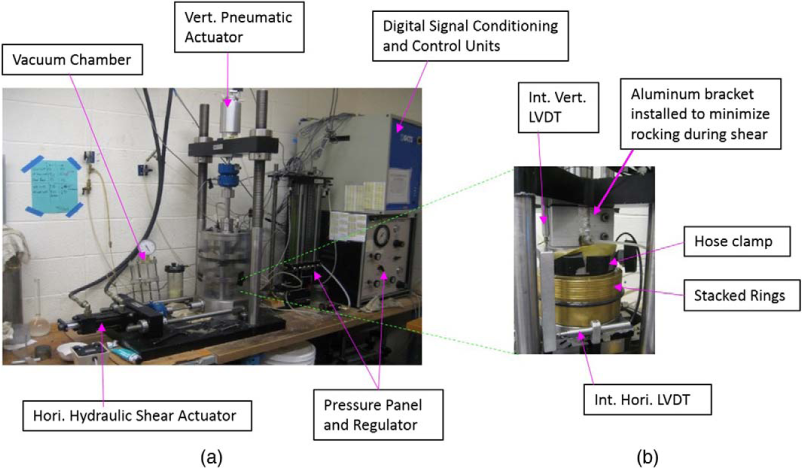
The overall setup of (a) the UT modified GCTS CSS apparatus; (b) instrumentation and testing setup on the soil specimen.
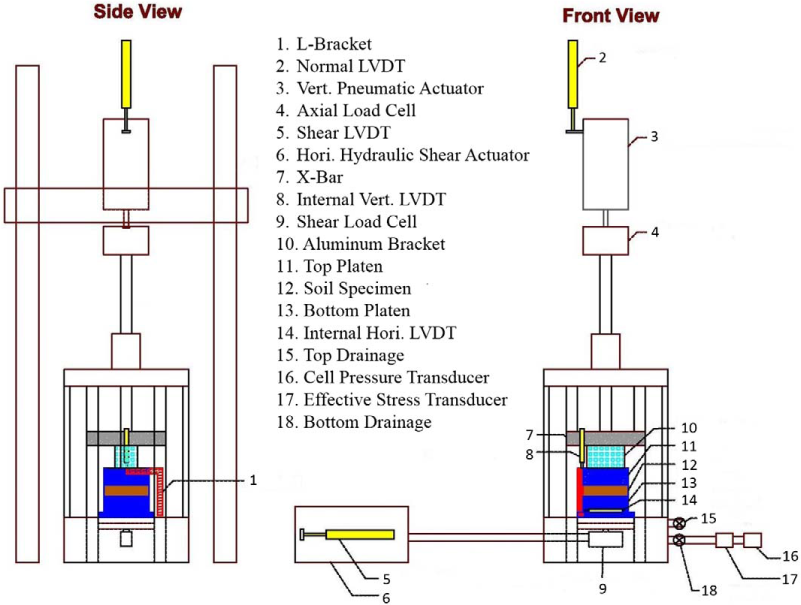
UT CSS sensor configuration and instrumentation list (Kwan 2015).
The one-dimensional horizontal cyclic actuator used a closed loop, electro-hydraulically actuated, servo valve (up to 20 Hz) at the bottom of specimen that could be operated under either load or displacement control. The apparatus was also designed to impose a chamber pressure, allowing back-pressure saturation prior to consolidation. Lateral confinement of the specimen was provided by an unreinforced membrane immediately inside a set of stacked rings. Kwan (2015) provides more detailed documentation of the UT CSS apparatus.
Figure 2 illustrates the sensors configuration used in the UT CSS apparatus. The system uses two load cells (vertical and horizontal), four linear variable differential transformers (LVDTs) and two pressure transducers. The horizontal load cell is set up underneath the shear roller assembly in-line with the horizontal actuator and the vertical axial load cell is located outside the cell in-line with the vertical air piston and normal load assembly. Two LVDTs are assembled outside the cell in-line with the horizontal actuator and vertical air piston to measure horizontal and vertical displacements, respectively. Two additional smaller, but higher resolution, LVDTs are set up internally on the specimen (Figure 1) for more accurate measurements. The internal horizontal LVDT measures the relative movement between the bottom and top platens. This measurement is a better representation of shear deformation; it is recommended for the calculations of shear strain. The second internal LVDT is set up in the vertical direction at the front edge of the specimen. The range and sensitivity of each sensor are documented in Kwan (2015).
Test Material
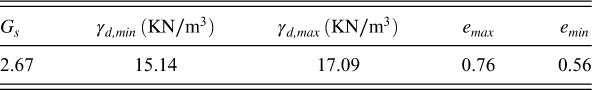
All CSS tests were performed on Nevada Sand, a uniform angular sand with a mean grain size of about 0.2 mm. This sand has been widely used for many centrifuge research projects including the tests performed in conjunction with this study. The sand properties are presented in Table 1 and particle size gradations are shown in Figure 3, for both washed and unwashed states. The minimum and maximum densities of the sand were determined by ASTM D4254 (Method A) and ASTM D4253 (Method 1A), respectively. Since water sedimentation was used for specimen reconstitution, a small amount of fines (less than 5%) were separated before and after deposition (Figure 3), changing the USCS classification from SP-SM to SP. However, the effect of fines segregation is considered negligible. De-aired filtered water was used for all specimen preparation stages.
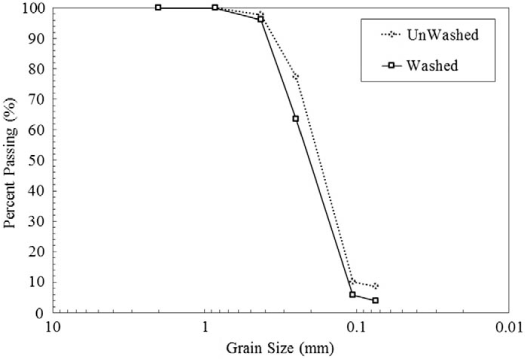
Grain size distribution for Nevada sand before and after water sedimentation with about 5% fine separation. USCS classification before pluviation: SP-SM; after pluviation: SP (Kwan 2015).
Properties of tested Nevada Sand
Specimen Preparation
Creating uniform and homogeneous CSS specimens was important for this project since multiple ‘identical’ specimens were needed to be tested under different irregular loadings. Having identical specimens allows isolation of the effects of the loading on the soil response. A system of stacked rings was used for this project as the means of providing horizontal confinement to achieve K0 consolidation while allowing for shearing deformations. Lubrication oil was applied between the rings and latex membrane in order to minimize vertical and horizontal friction during consolidation and shearing. Previous studies (Baxter et al. 2010, Kwan and El Mohtar 2014) show that using stacked rings gives similar stress-strain responses in soils to those obtained from NGI type wire-reinforced membranes. To aid the specimen reconstitution process, a custom-made aluminum split mold similar to the one documented in Ishihara and Yamazaki (1980) was designed and manufactured. The split mold surrounds the rings and membrane at once; the traditional split molds surrounds the unreinforced membrane alone (the stacked rings are typically slid around the membrane after the removal of the split mold). Once the vacuum was applied to the new split mold, the membrane was pulled against the rings, eliminating any gaps between the two prior to specimen reconstitution. De-aired water was then flushed into the inside of the stacked rings through the bottom drainage line to ensure saturation of the lines and porous stones, and the sand is then syphoned under the water using the wet sedimentation method.
The wet sedimentation method consisted of mixing a designated amount of sand with water and boiling them in a volumetric flask to remove any entrapped air and help reconstitute saturated specimens. After the sand cooled off, it was syphoned into the water inside the membrane according to either the loose specimen or dense specimen preparation procedures (both procedures are briefly discussed below, and more information can be found in Appendix B of Kwan 2015). After the specimen preparation procedures, the sand specimen was back pressure saturated (until an appropriate B-value is achieved) and consolidated to an effective stress of 100 kPa.
Loose Specimen Preparation
Wet sedimentation (pluviation under water) has been identified as the most appropriate method for simulating the natural sedimentation process of a clean sand deposit (Vaid 1999, Wood et al. 2008). As a result of experiments with different methods in existing literature, a loose specimen preparation method modified after Kammerer et al. (2002) was developed. In order to create a loose structure, a screen was placed at the bottom of the split mold under the water prior to placement of the sand. After syphoning the saturated sand, the screen was pulled up slowly raining the sand particles through the screen opening with zero drop height (Figure 4). The screen opening size was 0.85 mm, slightly greater than the largest grain size of tested soil (Figure 3). The soil specimen was reconstituted directly on the UTCSS apparatus to eliminate the possibility of disturbance when it was moved.
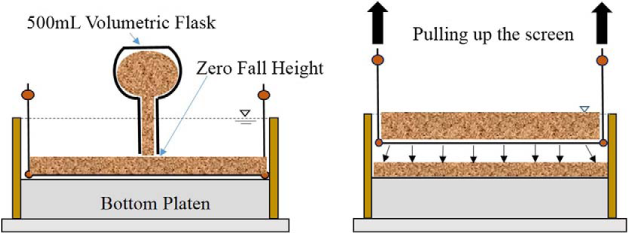
Illustration of loose specimen preparation procedure, wet sedimentation with a screen procedure (Kwan 2015).
Dense Specimen Preparation
Experimental investigations of liquefaction of dense sand have received less attention compared to loose sand; therefore, limited information is available on CSS dense specimen reconstitution procedures. Densification of sand is usually achieved by some forms of vibration, which vary from one type of testing/apparatus to another. Providing uniform vibration throughout the volume of the soil specimen is the key to achieve homogenous specimens. Kwan (2015) documented a method for reconstituting dense Nevada Sand specimens (average D r = 80%), which required two layers of pluviation. After syphoning half of the designated soil mass (following the procedure used for the loose specimen, except without the use of a screen), vertical vibration was applied to the sand surface using an inverted small vibratory table through a custom-made plate (which contains small holes for drainage as shown in Figure 5). The same procedure was repeated for the second layer. The two-layer approach resulted in more reproducible specimens based on results from harmonic cyclic simple shear testing (Kwan 2015).
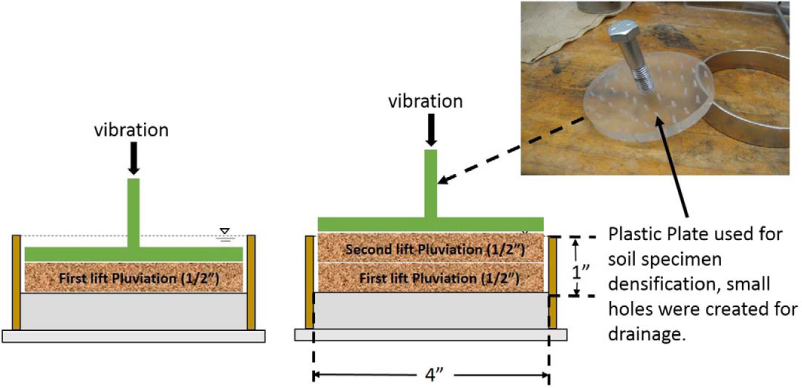
Illustration of dense specimen preparation. Specimens reconstituted in two layers, and vertical vibration applied from the sand surface (Kwan 2015).
Database Organization
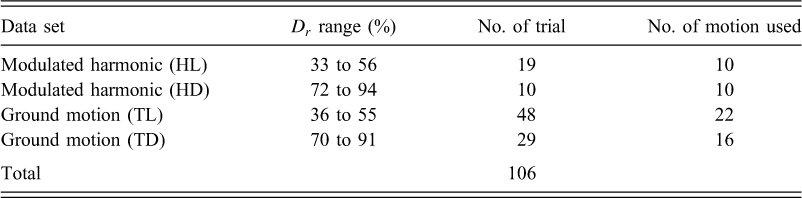
The CSS transient loading database is divided into four data sets (H = harmonic, T = transient, L = loose, and D = dense): (1) HL - modulated harmonic loading on loose specimens, (2) HD - modulated harmonic loading on dense specimens, (3) TL - transient loading on loose specimens, and (4) TD - transient loading on dense specimens. Table 2 summarizes the number of tests included in each data set. The average relative densities for the loose and dense specimens are about 45% and 80%, respectively. In total, there were 19 different modulated harmonic loadings, and 22 different transient loadings used in this study. Within a dataset, each test was performed on a new reconstituted specimen. Unlike centrifuge testing, in which it is common to apply multiple loading events to the same soil model, each CSS specimen in these experiments was loaded once under the specified loading motion. For data sets of TL and TD, each of the 22 transient loading histories was applied to the test specimen. Some of the specimens sheared under transient loading did not reach liquefaction initiation near the end of the applied shear stress time history (either reaching liquefaction initiation too early or no triggers of liquefaction). For such cases, a new specimen was reconstituted and tested (i.e. no pre-shearing effect) under the same transient shear stress time history but with adjusted amplitude(s). If liquefaction was initiated before the near-end of applied loading, the test was repeated with a smaller amplitude of the same motion. If the applied loading did not trigger liquefaction, the test was repeated with a larger amplitude. The amplitude adjustments were based on trial-and-error; therefore, some transient loading histories were repeated more than one time, until liquefaction was triggered near the end of applied transient history.
Summary of CSS tests per experiment
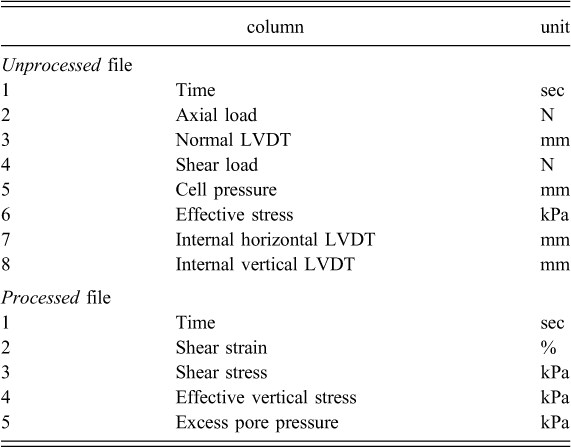
For each trial, there are two types of files available on NEEShub: an Unprocessed data file in .txt format and a Processed data file in .cvs format. The Unprocessed files document the direct measurements from the CSS apparatus sensors, and the Processed files provide data that is calculated using test specific details and corrected for testing conditions, such as calculating shear stresses using horizontal load cell output, area of specimen and vertical assembly friction correction. Table 3 summarizes the information that is provided in the two types of files. Moreover, the height, diameter and mass of the soil specimen for each trial are provided in a summary file, “SummaryOfInputMotion” on NEEShub. The information provided in the Processed files is ready for researchers to plot the CSS test results in the form of stress-strain curves and stress paths.
Summary table of unprocessed and derived files column
Css Tests under Modulated Harmonic Loadings
While the modulated sinusoid motions present a simplified loading time histories than the realistic ground motions, these tests are useful for demonstrating that the soil response under transient loading is more complex than under uniform cyclic loading. These modulated harmonic loadings systematically illustrate some basic trends for soil responses under non-uniform loading which might not be easy to identify under more complex transient loading. The modulated sinusoid motions consist of harmonic and tapered components. The tapered-up motions consist of ten cycles with increasing amplitudes, followed by ten cycles of uniform amplitude (Figure 6). The tapered-down motions consist of ten cycles of uniform amplitude followed by ten cycles of decreasing amplitude (Figure 7). The baseline loading for these tests was 20 cycles of constant-amplitude harmonic loading. The rates of increase and decrease in the tapered portions of the loading histories were generated by multiplying the base loading by a modulating function of the form as indicated by the following equation:

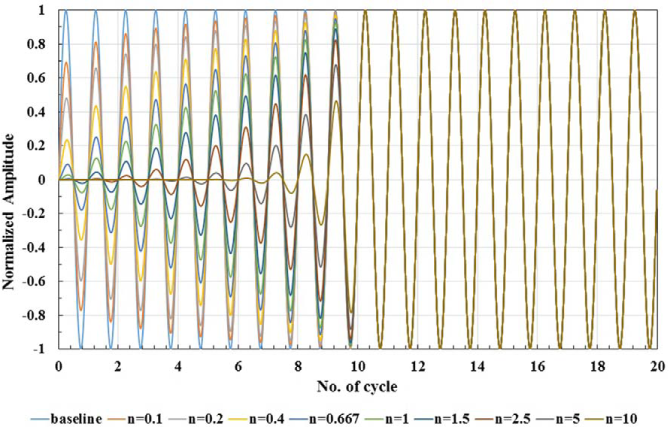
Input taper up motions at different rates of increase (Kwan 2015).
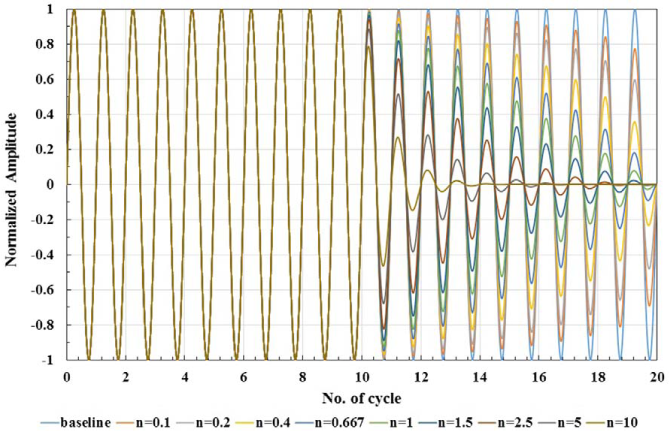
Input taper down motions at different rates of decrease (Kwan 2015).
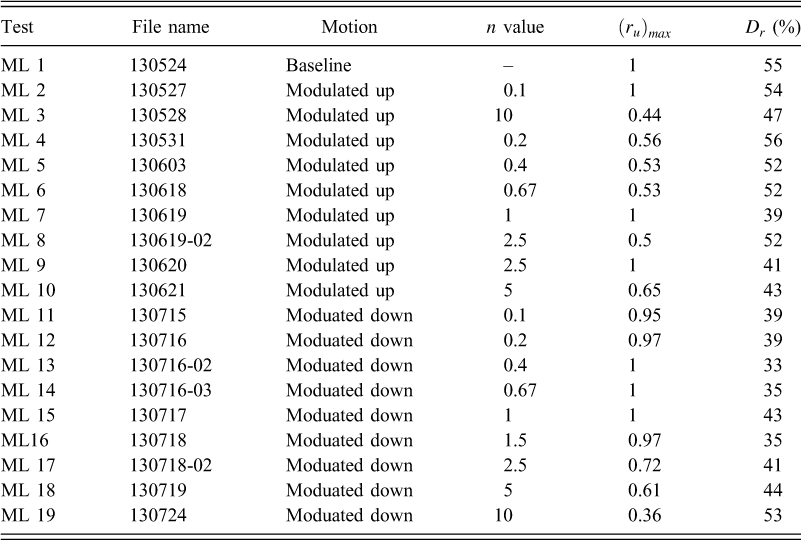
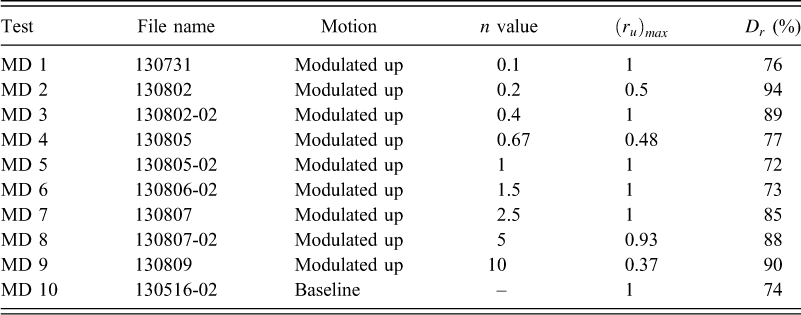
Data sets of HL and HD on NEEShub.org present the results of tests that used modulated harmonic loading. HL (Kwan et al. 2014a) includes 19 loose CSS tests under taper up or down loadings. HD (Kwan et al. 2014b) has 10 dense CSS tests using tapered-up loading. Tables 4 and 5 summarize the trials under Modulated Harmonic loading, and Figures 8 and 9 illustrate typical tapered-up and tapered-down loading results.
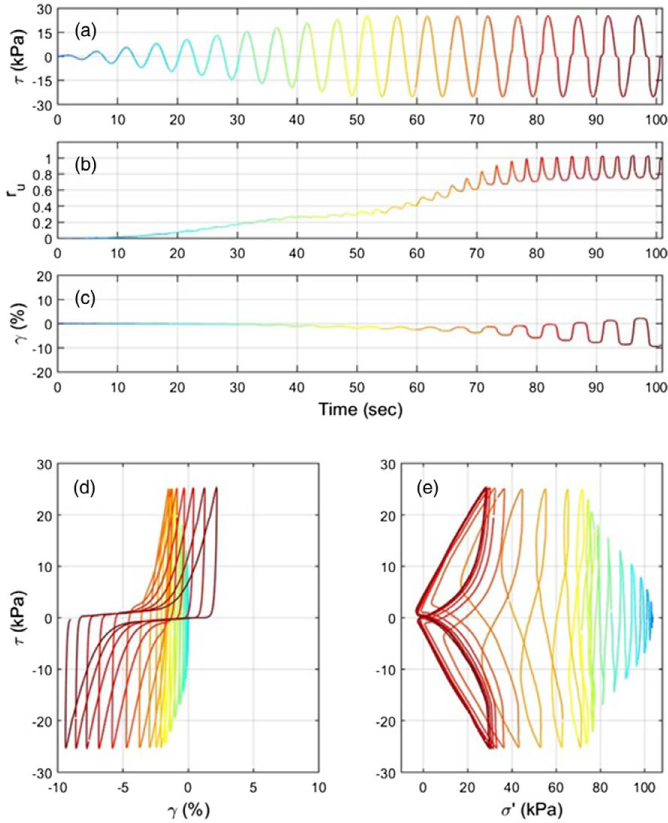
A sample CSS test of Tapered-Up loading (Test MD 5), (a) shear stress vs. time, (b) excess pore pressure vs. time, (c) shear stress vs. time, (d) stress-strain, and (e) stress path.
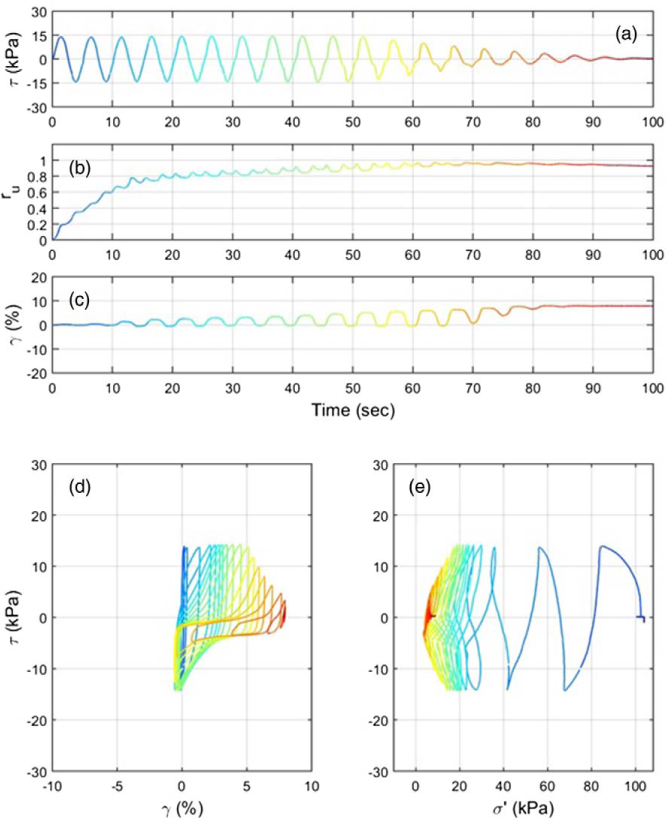
A sample CSS test of taper down loading (Test ML 16), (a) shear stress vs. time, (b) excess pore pressure vs. time, (c) shear stress vs. time, (d) stress-strain, and (e) stress path.
Summary of CSS tests under modulated harmonic loading (loose)
Summary of CSS tests under modulated harmonic loading (dense)
Css Tests under Ground Motion Loadings
A total of 22 transient shear stress loading histories were used in this study. The loading histories were obtained from recorded ground motions selected for their temporal characteristics as well as their amplitudes, frequency contents, and durations. As stated previously, the CSS testing described in this paper was conducted as part of a larger NSF study that also involved centrifuge testing. As such, the transient loading histories used in the CSS experiments were derived in a manner that allowed the CSS response to be compared to the experimental results from the parallel centrifuge study (Sideras 2017).
The centrifuge experiments investigated the free-field response of a 6-m-thick deposit of saturated sand overlying a one-meter-thick layer of cemented sand. The input acceleration time histories were applied below the cemented sand layer, at the base of the model. A total of six centrifuge experiments were conducted using a variety of input acceleration time histories and variable relative densities of the upper, 6-m-thick, sand deposit. To estimate the shear stress loading an element of liquefiable soil would be subjected to in free-field conditions (as approximated in the centrifuge), the selected acceleration time histories were applied at the base of a one-dimensional, equivalent linear model representing the average properties of the soil profile used in the six centrifuge experiments. The computed shear stress history at a depth of 5.5 m was extracted for use as the CSS shear stress loading history. This depth corresponds to that at which the peak pore pressure response was observed in numerical analyses.
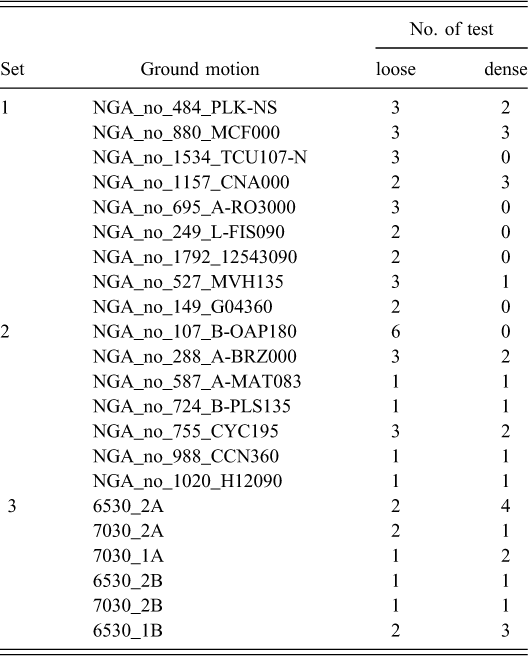
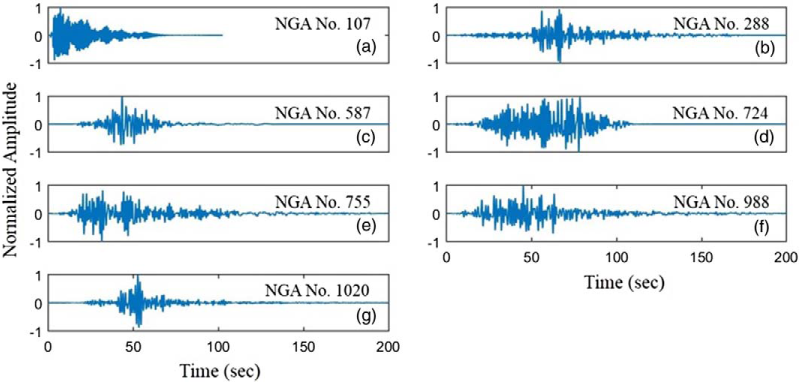
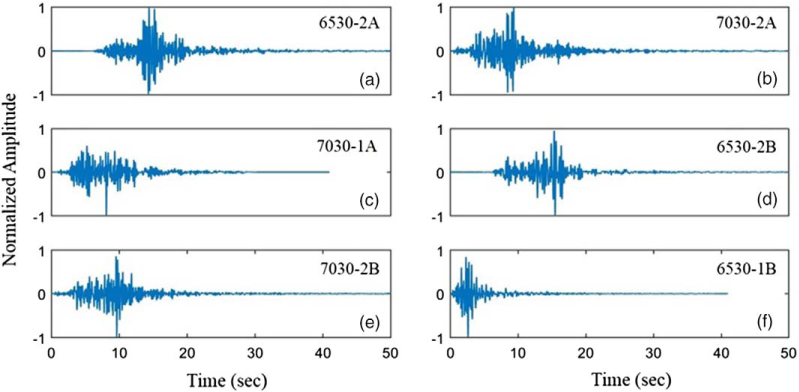
Table 6 summarizes the selected ground motions, and Figures 10 to 12 show the 22 ground motions. The motions used to develop the loading histories have very different time-domain characteristics, from short to long duration, low to high frequency content, and one dominant pulse to a few dominant ones. The 22 transient ground motions were selected from the PEER NGA strong motion database using three sets of selection criteria as described below.
Summary table of input motions
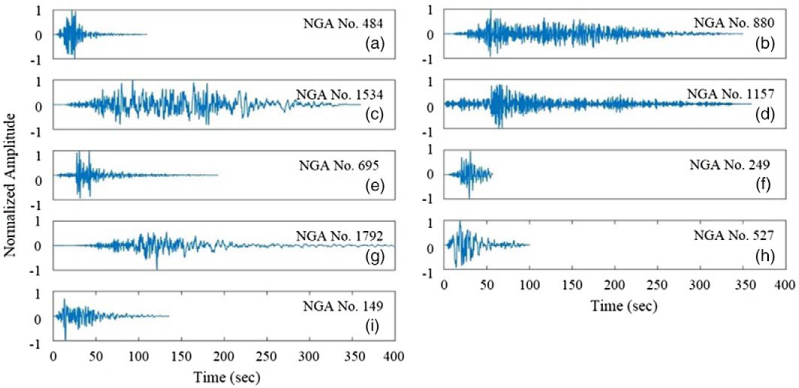
Set 1 of laboratory loading time histories. Selection based on IM behavior (Kwan 2015).
Set 2 of laboratory loading time histories. Selection based on energy buildup rates (Kwan 2015).
Set 3 of laboratory loading time histories. Selection of motions was based on the results of ProShake analyses of the 7-m idealized sand profile to investigate the differences between shear stress response from the equivalent linear analyses and input acceleration time histories (Sideras 2017).
Set 1 ground motions were selected for investigating the predictive capabilities of various earthquake intensity measures (IMs) including both cumulative and peak parameters (Abegg 2010). Figure 10 illustrates the nine motions in Set 1, with their peak shear stress amplitudes normalized to unity. This set of ground motions includes loadings that can yield very high (NGA No. 880, 1534, and 1157) and very low cumulative IM values (NGA No. 484, 695, and 249). Similarly, Set 1 motions include motions dominated by a single high amplitude pulse, such as NGA No. 1792 and No. 149, and motions that feature multiple pulses with amplitudes near that of the peak pulse (e.g., NGA No. 1534 and 695).
Set 2 consists of seven ground motions (Figure 11) that were selected to investigate how the order of the shear stress pulses affects pore pressure generation. The loading histories in Set 2 have different patterns of IM amplitude. Some (e.g., No. 107) have very high amplitudes in the early portion of the loading and others (e.g., No. 724) have higher amplitudes in the latter portion.
Set 3 consists of six loading histories (Figure 12) that were selected specifically based on the results of ProShake analyses of the 7-m idealized sand profile. Due to the frequency-domain characteristics of the selected motions and the dynamic properties of the idealized soil profile, it was observed that the shear-stress response at the critical depth of 5.5 m closely resembled the input base acceleration time histories. To investigate if the responses observed in the CSS testing and the companion centrifuge experiments were influenced by the relationship between the base acceleration time histories and the shear-stress response, an additional set of 6 motions were selected where the observed shear stress response from the equivalent linear analyses differed significantly from the input acceleration time histories.
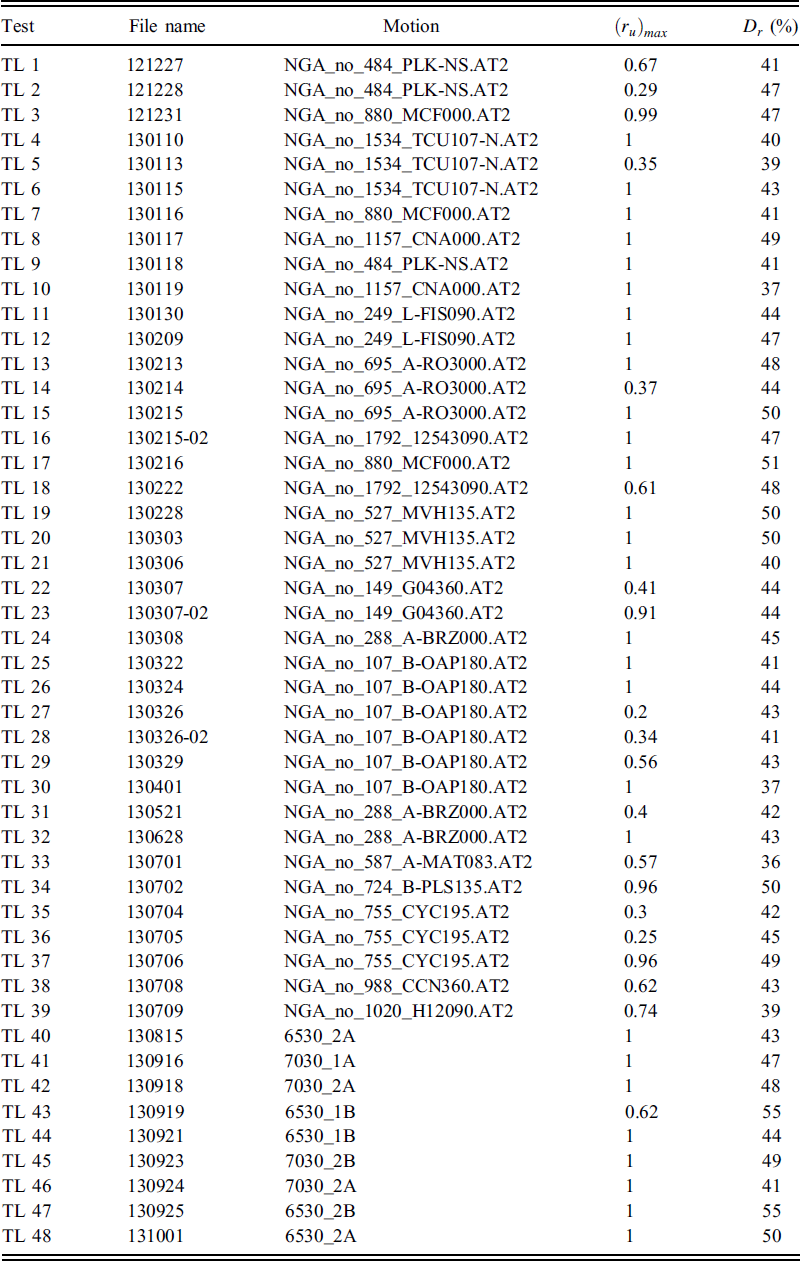
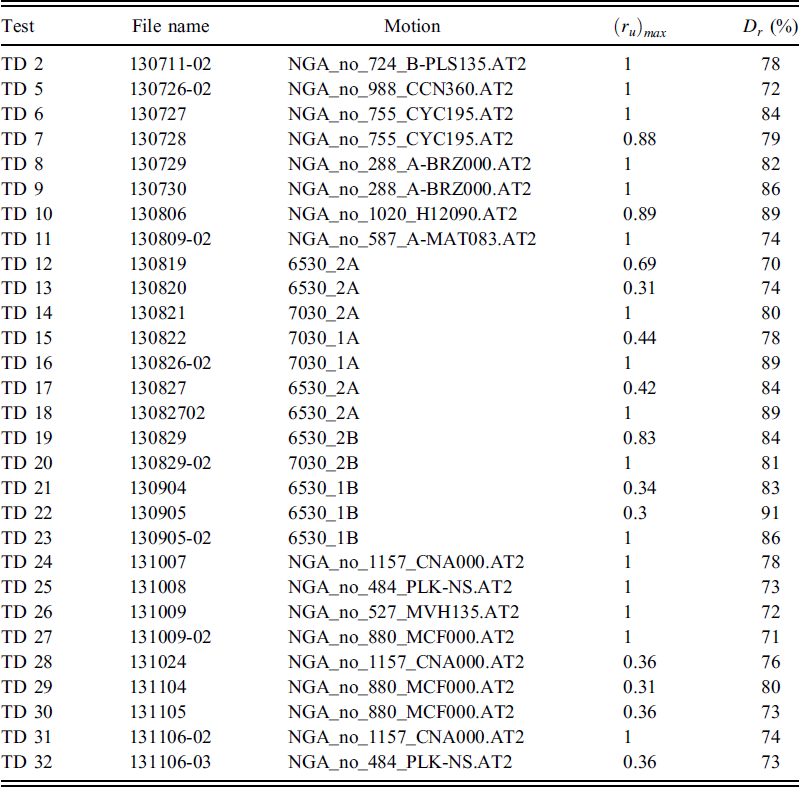
A total of 77 CSS tests were performed using 22 transient loading histories. Two datasets are available on NEEShub: Data set TL for the 48 tests performed on loose specimens (Kwan et al. 2014c); and TD for the 29 tests performed on dense specimens (Kwan et al. 2014d). Tables 7 and 8 summarize the available tests TL and TD, respectively. At the shearing stage of each test, a scaling factor was estimated and applied to adjust the shear stress amplitude, such that liquefaction was triggered towards the end of the loading. This scaling factor was mainly selected based on trial-and-error and results from previous tests. Some scaling factors were overestimated; therefore, liquefaction was triggered in the early part of the applied motions. Other scaling factors were underestimated resulting in low r u values even after the completion of the ground motion.
CSS tests on loose specimens subjected to transient loading
CSS tests on dense specimens subjected transient loading
Two examples of these results are presented in Figure 13. For the transient loadings, the excess pore pressure (Figure 13c) can build up relatively quick (TL30) or relatively slow (TL32). The rate of excess pore pressure generation is highly dependent on the location of the ground motion dominant peaks, earlier stages or towards the end of loading.
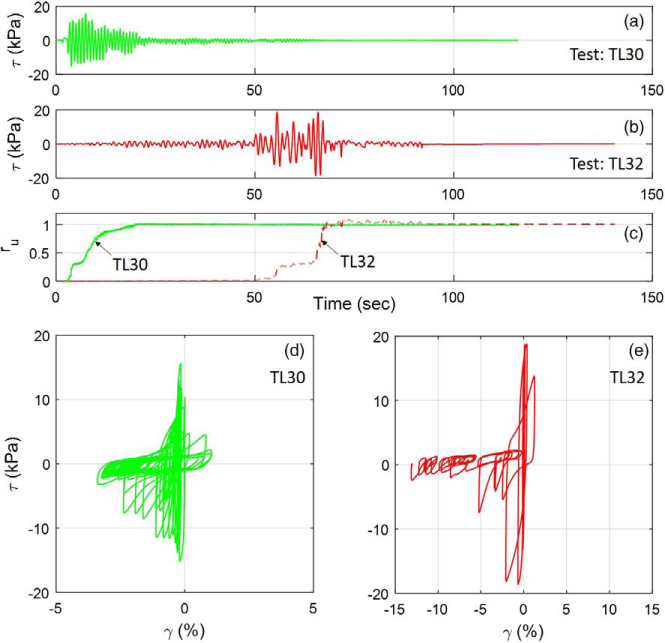
Two CSS test results (TL 30 and TL 32) under different ground motion loadings (dominant peaks at the earlier vs. the end of stages).
Summary
A total of 106 undrained Cyclic Simple Shear Tests under modulated harmonic (29 tests) and transient loadings (77 tests) were performed as part of this NSF funded NEES research project, “NEESR-CR: Evolutionary Intensity Measures for More Accurate and Informative Liquefaction Hazard Evaluation” (Grant No. 0936408). The soil response in the form of shear stress, shear strain, and excess pore pressure generation before and after liquefaction initiation were recorded. 44 tests were loaded beyond initiation of liquefaction to provide insight into the behavior of liquefied soil. The 106 CSS tests are grouped in four different data sets (HL, HD, TL, and TD) and available freely from NEEShub, both in the formats of Unprocessed and Processed. The derived files contain data columns of time, shear strain, shear stress, vertical effective stress, and excess pore pressure. This kind of systematical data, providing information of soil response before and after the triggering of liquefaction in a publically available database, is virtually non-existent before this investigation.
As yet, the primary use of these data sets is to identify the better performer(s) among different popular Intensity Measures (Kwan 2015). The goal of using better IMs is to reduce uncertainties in liquefaction hazard evaluation. Kwan (2015) utilized 28 CSS tests (15 from TL and 13 from TD) to investigate the performance of four popular IMs (I a , CAV5, NED, and PGA m ). The 28 tests were selected based on two criteria: (1) no repetition of loading motion at the same density range, and (2) liquefaction is triggered near the end of applied loading. In addition to the initiation of liquefaction, the provided data could also be utilized to evaluate IMs that can efficiently predict the effects of soil liquefaction such as induced lateral deformation (Abegg 2010, Kwan 2015).
The CSS test data generated in these datasets is expected to provide a resource for constitutive modelers and numerical analysts. Many plasticity models for sand have been developed and calibrated against laboratory harmonic cyclic test data. However, actual grounds motion have unique time domain characteristics (including various duration and frequency content) which makes the soil response to transient loading much more difficult to model compared to those loaded under harmonic loading. These datasets provide information for numerical modelers to further calibrate the stress-strain and excess pore pressure behavior under irregular loadings. Moreover, the behavior of liquefied soils (after liquefaction initiation) is challenging to model, and these datasets provide soil response data during the stage when the sand had been fully softened. It is hoped that the data curation will provide researchers with the information to advance the practice of geotechnical earthquake engineering.
Footnotes
Acknowledgments
This work was supported by the National Science Foundation, NEES Research program, under Grant No. 0936408, and the Department of Civil, Architectural and Environmental Engineering at The University of Texas at Austin. This support is gratefully acknowledged.