
Abstract
The displacement coefficient method proposed in FEMA 440 was evaluated using response statistics from a comprehensive set of nonlinear simulations of multi degree of freedom systems under both far-fault and near-fault ground motions. The study finds that it is practically difficult to achieve high relative strength factors (R values equal to or greater than 6.0) for very stiff systems thereby dictating the need to define R-dependent demand coefficients. The approximate expressions proposed in FEMA 440 for the C2 coefficient is shown to underestimate the displacement demand of stiffness-degrading short period systems. Additional nonlinear simulations were performed to investigate the combined effect of strength degradation and P-Delta effects on the displacement demands of MDOF systems. A new expression for the modification factor that reflect combined P-Delta and degrading effects for the estimation of displacement demands is proposed.
Introduction
The design of new buildings or the evaluation of existing buildings is often carried out using linear and nonlinear static procedures together with some approximate methods to determine deformation demands. Considerable research has been conducted to develop consistent and reliable methods for the estimation of inelastic displacement demands (Gulkan and Sozen 1974, Freeman et al. 1975, Kowalsky 1994, Gupta and Krawinkler 2000 Ruiz-Garcia and Miranda 2003, Akkar and Miranda 2005, among others). Most, if not all, of these studies are based on the evaluation of equivalent single degree of freedom (SDOF) systems. Miranda and Ruiz-Garcia (2002) provide an excellent summary of these methods and have evaluated their ability to estimate peak inelastic displacement demands of SDOF systems. In the literature, the term “inelastic displacement” refers to the peak displacement demand of a nonlinear oscillator which includes both the elastic and inelastic components and, as such, may be misleading. However, for the sake of being consistent with the literature, “inelastic displacement” will be used in this paper to designate the peak displacement of a nonlinear oscillator. Two of the most comprehensive documents on performance evaluation of structures (ATC-40 1996, FEMA 356 2000) also employ approximate methods based on equivalent SDOF systems to estimate displacement demands in multi degree of freedom (MDOF) structures. More recently, FEMA 440 (ATC 2005) prepared by the Applied Technology Council within the framework of the ATC-55 project evaluated the performance of current procedures and suggested certain improvements. Akkar and Metin (2007) evaluated the improved capacity spectrum method (CSM) and improved displacement coefficient method (DCM) of FEMA 440 (ATC 2005) by conducting numerous nonlinear response history analyses on SDOF and MDOF systems under near-fault ground motions with pulse. They have reported that both methods produced reasonably good deformation demands on the median for near-fault records. Akkar and Metin (2007) also indicated that the error statistics conditional to the relative strength (R) showed that DCM is biased towards conservative estimations for increasing R values.
The main objective of this study is to gain further insight into the coefficient method of displacement modification in FEMA 356 2000 together with the improvements proposed in FEMA 440 (ATC 2005) (referred to henceforth as the “improved displacement coefficient method”) such that displacement estimates for buildings that are prone to the effects of combined strength degradation and P-Delta effects are better estimated. As a secondary objective, the effectiveness of improved DCM in estimating the displacement demands of elastic-perfectly plastic and stiffness degrading systems are evaluated. The inelastic demands computed from nonlinear response history analyses of MDOF systems under an ensemble of near-fault and far-fault ground motions are used to propose approximate expressions to reflect combined effects of strength degradation and P-Delta effects.
Summary of the Displacement Coefficient Method
The determination of the target displacement using DCM is summarized in
FEMA 356 (2000)
. A detailed review and evaluation of the method followed by recommendations for improvement are presented in FEMA 440 (ATC 2005). According to the displacement coefficient method, the target displacement, δt, which corresponds to the roof displacement of a MDOF system can be estimated as:
Note that C1 is computed as C1 =1+ (R–1)/(aTe2) for periods between 0.2 and 1.0 seconds, where R is the ratio of the elastic strength demand to the strength capacity, R=[Sa / (Vy/ W)]Cm. Vy is the yield strength of the building computed typically from a push-over analysis, W is the effective seismic weight, Cm is the effective mass factor and a is a parameter representing the site class (ATC 2005). For Te greater than 1.0, C1 is taken to be equal to 1.0 and for Te smaller than 0.2 seconds the value computed for Te =0.2 seconds should be used. In FEMA 356 (2000), approximate values for the C2 coefficient were proposed based on expert opinion. FEMA 440 (2005) proposes an improved relationship based on a series of studies on SDOF systems. Accordingly, C2 can be computed as: C2 =1+ (1/800) ((R–1) /T)2. However, C2 was meant to account for stiffness degradation only and effects of strength degradation is addressed by limiting the maximum value of R to prevent dynamic instability which occurs as a result of combined effects of P-Delta and strength degradation. Finally, in FEMA 356, C3 is computed as: C3 =1.0+ |α|(R–1)1.5/Te where α is the post-yield stiffness of the system. C3 is taken as 1.0 if α is positive. In the improved displacement coefficient method summarized in FEMA 440, it is suggested that the coefficient C3 be eliminated from the Equation 1 and replaced with a limit on minimum strength (maximum R) required to avoid dynamic instability.
Frame Structures and Ground Motions Used in this Study
Three reinforced concrete (RC) structures with three, six, and nine stories designed to satisfy the requirements of the International Building Code (ICC 2000) were utilized in the simulations. The plan view of the prototype building is shown in Figure 1 together with the elevation view of a typical exterior frame, which was used in the nonlinear analyses. The perimeter frames were designed to carry the entire seismic load whereas frames B, C, and D were designed to carry gravity loads only.
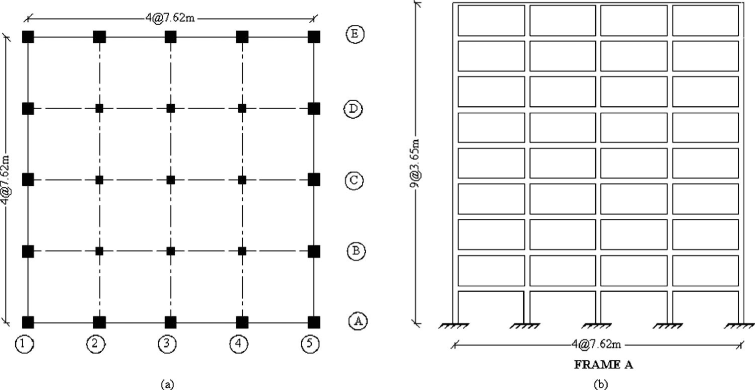
(a) Plan view of the prototype building and (b) elevation view of typical exterior frame.
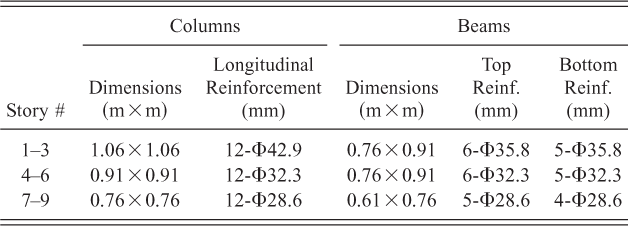
The frames were assumed to be located at a site in northern California with design spectral accelerations (SDS) =1.2 g and (S1.0) =0.55 g. The design spectrum was developed as per the recommendations of IBC (2000) for site class C. Table 1 summarizes the dimensions and longitudinal reinforcement of the nine-story exterior moment resisting frame. The fundamental periods were computed as 0.52, 0.87 and 1.12 seconds for three-, six-, and nine-story buildings, respectively. Three generic frames were developed from each of the designed frames by varying the floor masses to generate a reasonable period range for low and mid-rise frame structures. Accordingly, a total of nine frames with periods of 0.25, 0.35, 0.5 (three-story), 0.6, 0.7, 0.8 (six-story), 1.0, 1.2, and 1.5 (nine-story) seconds were generated.
Dimensions and reinforcement data of members of exterior frame of the 9 story building
In all, four different degrading force-deformation relationships were used as shown in Figure 2: the first represents the response of a stiffness-degrading system with a post-yield stiffness of 0.25%; the other three force-deformation models represent structural elements with different strength degradation levels, namely, low-degrading, moderately-degrading, and highly-degrading components. In addition to these four degrading models, elastic and elastic-perfectly-plastic (EPP) models of all the generic frames were also developed and analyzed.
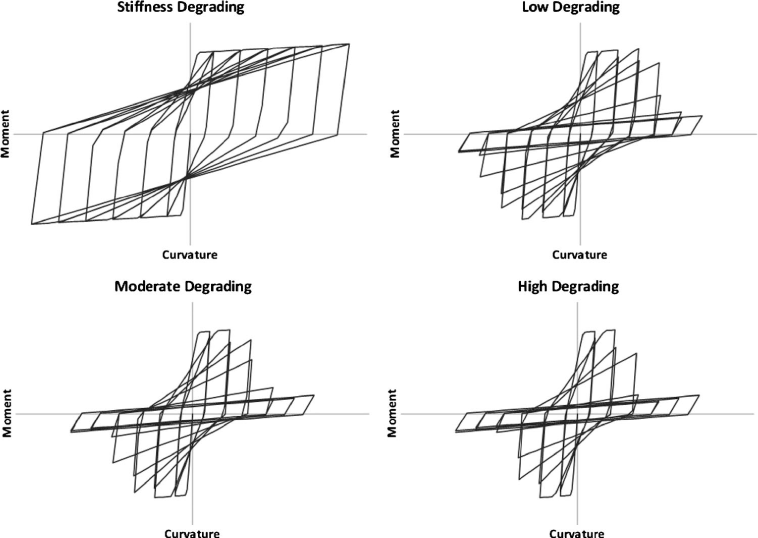
Force-deformation relationships used to consider stiffness and strength degradation (Low-degrading: α=0.015, β=0.01; Moderate-degrading: α=0.025, β=0.02; Highly-degrading: α=0.035, β=0.03.
Degrading systems were modeled using the Hysteresis material in the OpenSEES (2007) analysis platform. Strength and stiffness degradation due to both ductility and energy dissipation were specified in the model. In OpenSEES, α is the parameter used in the Hysteresis material to represent the damage due to ductility whereas the parameter β is used to symbolize damage due to energy dissipation. The values selected for these parameters and the resulting force-deformation behavior is presented in Figure 2. The significant parameters in the force-deformation relationship such as the initial stiffness, yield moment and yield curvature were determined through classical section analyses. In these analyses, reinforcing steel was modeled using a bilinear curve (yield strength, fy =413 MPa) with 2% strain hardening. The characteristic strength of unconfined concrete was assumed as 25 MPa with an ultimate strain of 0.006. The properties of confined concrete were calculated using the model proposed by Mander et al. (1988). The initial stiffness of each element was computed as the secant stiffness of the moment-curvature curve between the origin and 70% of the yield moment capacity. As Figure 2 indicates, the force-deformation models used in the nonlinear analyses incorporates primarily degradation due to cyclic loading and not in-cycle strength degradation. The base shear capacity (V/W where W is the total seismic weight) of the three, six, and nine stories were computed as 0.46, 0.32, and 0.27, respectively.
A total of 60 ground motions were used to assess the displacement demands of the selected MDOF systems. All ground motions were recorded on firm soils (shear wave velocity between 180 and 750 m/s). Of these, 30 are considered to be far-fault motions recorded further than 20 km away from the causative fault while the remaining 30 are near-fault motions recorded within 20 km of the fault. Details of the ground motions used in the study are listed in Table 2. 5% damped elastic spectra of the unscaled ground motions are presented in Figure 3 along with the IBC-2000 design spectrum used in the frame design.
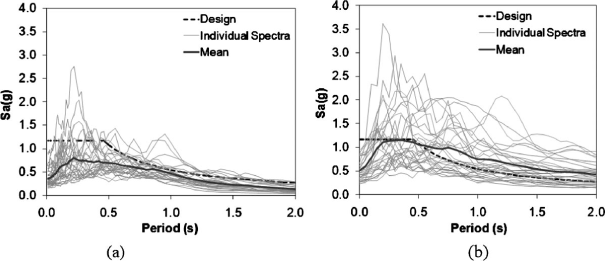
5% damped elastic response spectra of the (a) far-fault (b) near-fault ground motions used in this study together with the design spectrum.
List of far-fault and near-fault ground motions used in the study a
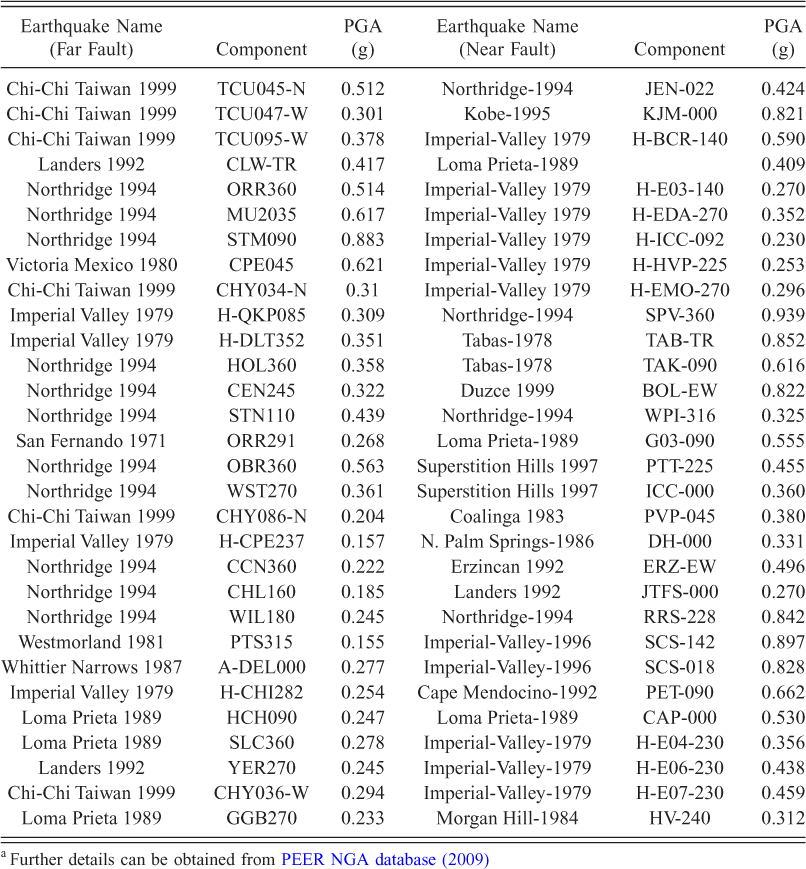
Further details can be obtained from
A Closer Look at the R FACTOR
The relative strength (R) factor, defined as the ratio of elastic strength demand to calculated yield strength coefficient and computed as R=[Sa / (Vy / W)]Cm, has been used by various researchers to define the inelastic demands on structures. For example, Ruiz-Garcia and Miranda (2003) reported that the mean ratio of the inelastic to elastic displacement demand of SDOF systems is very high for short period structures with high R values.
The figures given in FEMA 440 (ATC 2005) also indicate that, for short period structures, the C1 value strongly depends on the R value for all site classes and can be very high for short period, high relative strength structures. All these results are based on parametric studies carried out on SDOF systems where the relative strength of the system can be adjusted. To investigate the range of the R values used in previous studies as well as those in FEMA 440, a series of pushover analyses were carried out on typical three-story reinforced concrete (RC) frames. Since the period of the system depends primarily on mass and stiffness, the weight and dimensions of the structural elements were kept constant and the column reinforcement ratios of the structures were modified to change the yield strength of the structure. To represent extremely weak structures, the reinforcement ratio in the columns was decreased to 0.6%, which is less than the minimum requirements of ACI-318 (2005).
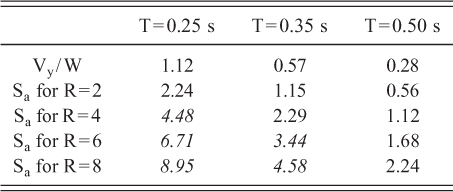
During the modification of the column reinforcement ratios, the strong column/weak beam philosophy, which requires the columns at a joint to be at least 20% stronger than the adjoining beams has been considered. The yield strength coefficient (Vy / W) was computed to be 1.12, 0.57, and 0.28 for the three-story frames with fundamental periods of 0.25, 0.35, and 0.5 seconds, respectively. Table 3 shows the Sa values required for the three-story RC frame with a column reinforcement of 0.6% to reach R values of 2, 4, 6, and 8. The values given in Table 3 indicate that, for very short period structures, unrealistically high Sa values are required to attain large R values. In other words, it is very unlikely, if at all possible, to design and construct frame systems with short fundamental periods and high relative strengths (R), since strength and stiffness are highly interrelated. Keeping in mind that the RC frame used in these analyses is the weakest configuration for the given weight and stiffness; the results suggest that a maximum limit should be imposed on the R value for short period structures. Consequently, for the simulations reported in this paper, the maximum R values for periods of 0.25 and 0.35 seconds were limited to 2 and 4, respectively, while the entire range (from R=2 to R=8) were considered for periods equal to or higher than 0.5 seconds.
S a values required to attain different R values for a weak RC frame
It should be noted that the buildings summarized in this section of the article were only used to demonstrate the difficulty to achieve high R factors for very stiff systems. Neither the buildings summarized in this part nor the data presented in Table 3 were used in the evaluation and enhancement of the displacement coefficient method. The buildings summarized in the section “Frame Structures and Ground Motions Used in this Study” were exclusively used for that purpose in the remainder of this article.
Evaluation of C1 COEFFICIENT
C1 is the ratio of the displacement demand of the EPP SDOF to the elastic spectral displacement. Within the context of the displacement coefficient method, it can be shown that, for an elastic-perfectly-plastic system, where C2 can be assumed to be 1.0, Equation 1 becomes δEPP = CoC1Sd where δEPP is the roof drift demand of the elastic-perfectly-plastic MDOF and Sd is the elastic spectral displacement. In this expression, the product of Co and Sd is the roof drift demand of the elastic system. As such, C1 can also be interpreted as the ratio of the roof drift (RD) demand of the EPP system to that of the elastic system. Throughout this paper the latter definition has been used for C1 coefficient, i.e., C1 = RDEPP / RDelastic.
Figure 4 displays the mean error value for the C1 coefficient obtained from 30 simulations. In this article, error is defined as the ratio of the response predicted by the displacement coefficient method of FEMA 440 to the observed response. As such, error values greater than 1.0 represent the cases where the DCM produces conservative estimates. Similarly, DCM underestimates the observed response quantity if the error term is less than 1.0. The value of the constant “a” in the approximate expression for C1 co-efficient was taken as 90 for ground motions recorded on site class “C” and 60 for site class “D” ground motions (Table 2), respectively as per the recommendations of FEMA 440 (ATC 2005). Figure 4a shows that, for far-fault ground motions, the approximate equation for C1 given in FEMA 440 provides conservative estimates for all periods and R values. Each ground motion was scaled to reach a target Sa value for each building with a constant Vy / W value such that the target R = Sa / (Vy / W) is achieved. The mean error for the C1 coefficient for near-fault ground motions are shown in Figure 4b. The empirical expression given in FEMA 440 for C1 coefficient was observed to provide conservative estimates for systems with Te >0.8.
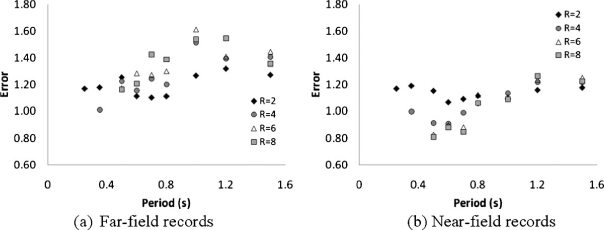
Mean error for the C1 coefficient for (a) far-fault and (b) near-fault ground motions.
However, for Te <0.8, it provides slightly unconservative estimates particularly for R values greater than 4. Despite this shortcoming, considering the fact that only 20% of the ground motions used in the development of the empirical equations were near-fault ground motions (ATC 2005) which do not recognize important features of near-fault motions such as pulse period and peak ground velocity, it can be concluded that the approximate equation given in FEMA 440 for the C1 coefficient yields satisfactory estimates.
Behavior of Mdof Systems under the Combined Effect of Strength Degradation and P-Delta Effects
In FEMA 356 (2000) two separate modification factors were proposed for strength and stiffness degradation and P-Delta effects, C2 and C3. However, stiffness and particularly strength degradation and P-Delta effects are strongly interrelated. FEMA 356 addresses this issue by limiting the C3 coefficient to 1.0 for systems with a positive post-yield stiffness. FEMA 440 deals with this issue by stating that the negative post-yield stiffness in a pushover curve of a realistic structural system has three components: cyclic strength degradation, in-cycle strength degradation, and P-Delta effects. To prevent dynamic instability due to the combined effects of strength degradation and P-Delta effects, FEMA 440 suggests a limit on the strength of the system, eliminates the C3 coefficient used in FEMA 356 and proposes a new expression for C2 which accounts for stiffness degradation only. To evaluate the effectiveness of the approximate equation of FEMA 440 (ATC-2005), a series of nonlinear response history analyses were carried out on generic frames with stiffness degrading and EPP behavior and the mean error obtained for the approximate expression for C2 depicted in Figure 5. Note that in this study C2 = RDRdegrading / RDREPP; RDR: roof drift ratio.
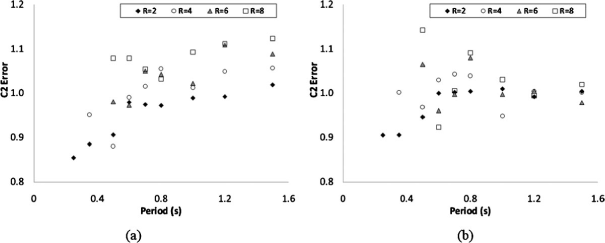
Mean error for the C2 coefficient for (a) far-fault and (b) near-fault ground motions.
For fundamental periods greater than 0.8 seconds, the approximate expression of FEMA 440, on average, provides conservative estimates for the C2 coefficient, particularly for far-fault ground motions. The mean errors decrease below 1.0 for lower period systems indicating that the RDRdegrading / RDREPP ratio may be underestimated for these systems. The lowest mean error value observed was 0.86 for a system with a period of 0.25 seconds and R=2 under far-fault motions; i.e., the RDRdegrading / RDREPP ratio was underestimated by 14% on average by the equation given in FEMA 440 (ATC 2005). It should be noted that mean errors for both ground motion ensembles are in the range of ±15%, which is very reasonable considering the fact that the approximate equation in FEMA 440 for stiffness degrading systems was derived from studies of SDOF systems that cannot consider MDOF effects.
Although limiting the strength of the system to avoid strength degradation seems reasonable and applicable for new buildings, the displacement coefficient method along with the acceptance criteria given in FEMA 356 is widely used in the assessment of existing structures where the strength of the system is fixed. Hence, limiting the R value to prevent the dynamic instability limits the use of the displacement coefficient method to generally well-detailed buildings. To eliminate this limitation so that the engineers can use the method for existing nonductile buildings with R values larger than the specified limit, nonlinear response history analyses were carried out on RC frames with different levels of strength degradation. Approximate expressions for the ratio of displacement demand of inelastic systems with strength and/or stiffness degradation to that of elastic-perfectly-plastic systems, C2 = RDRdegrading / RDREPP, to be used in displacement demand estimation of existing buildings were established. P-Delta effects were considered in all the analyses. Hence, C2 coefficient defined within the scope of this study considers the combined effect of cyclic strength degradation (and not in-cycle degradation) and P-Delta effects.
Figure 6 and Figure 7 present the mean ratio (solid points) of the RDR demand of the degrading systems to that of EPP systems for far-fault and near-fault ground motions, respectively. Shown also in these graphs are the mean+standard deviation (84th percentile) values (hollow points) of the C2 coefficient obtained from nonlinear RHA. Finally, regression analyses of the mean data for different R values using least squares curve fitting were carried out and these are also included in the plots. As Figures 6 and 7 illustrate, C2 depends primarily on the degradation level and fundamental period. It may be argued that C2 is generally independent of R though the effect of R for low-degrading systems is slightly different from high-degrading systems. It is also observed that C2 tends to saturate as the level of relative strength increases regardless of the hysteretic behavior, which is consistent with results from results of SDOF systems reported in FEMA 440. It must also be emphasized that the deformation capacity of moderate and highly degrading systems is rather limited since strength degradation due to both ductility and energy dissipation occur rapidly (see Figure 2). Hence, they are more vulnerable to dynamic instability than low to moderately degrading systems. C2 is therefore governed by the displacement capacity in the case of moderate and high-degrading systems. Additionally, since more degradation results in increased demands, there exists the potential to underestimate deformation demands in degrading nonductile structures. This has major consequences in performance-based design and evaluation objectives such as Immediate Occupancy, Life Safety, and Collapse Prevention limit states that are fairly close to each other for nonductile elements (ATC-40 1996 and FEMA 356 2000).
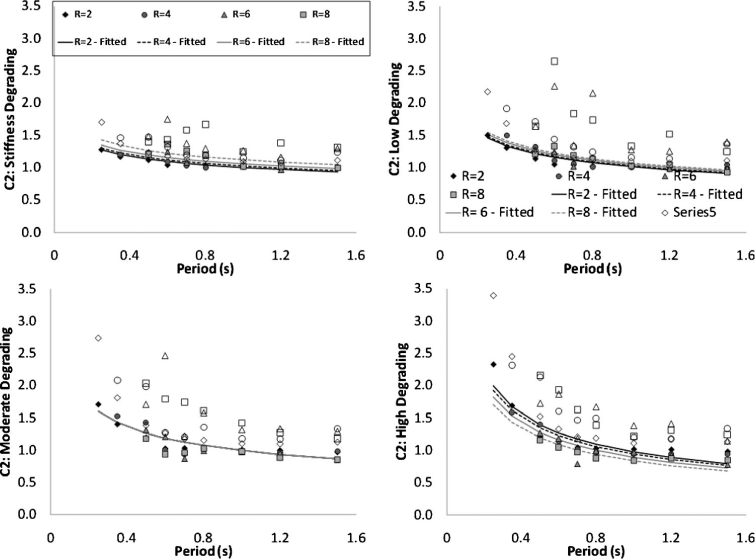
Ratio of roof displacement demands of degrading systems to that of EPP systems for far-fault ground motions.
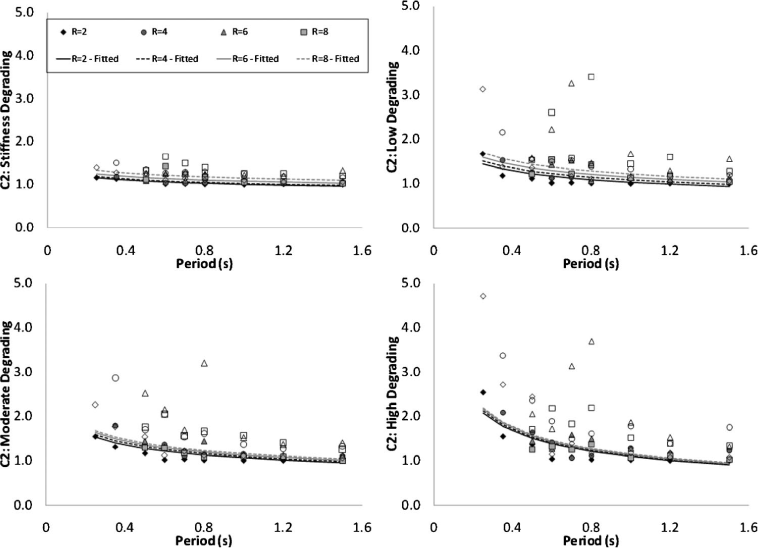
Ratio of roof displacement demands of degrading systems to that of EPP systems for near-fault ground motions.
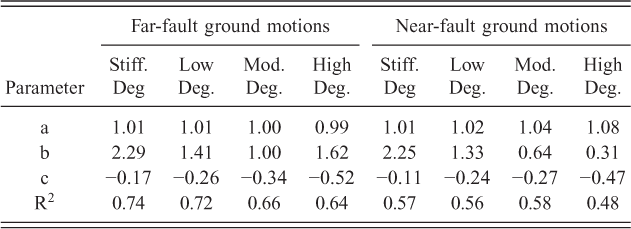
Hence, based on data generated from the present study, a new equation is being pro-posed for the C2 parameter to estimate the mean values summarized in Figure 6 and Figure 7. The most appropriate form of C2 (yielding the lowest R2 value) was determined to be:
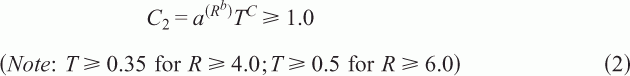
Values of mean equation parameters for approximate expressions for C2 coefficient
A New Target Displacement Parameter
Both the capacity spectrum method of ATC-40 and the coefficient method of displacement modification of FEMA 356 and FEMA 440 aim to estimate the maximum roof displacement demand of the structure for a design seismic event. The building is then pushed to this predetermined “target displacement” level and the local demands such as interstory drift ratios, plastic rotation demands for ductile members along with the force demands for brittle members are determined. These local demands are then used to assess the performance of the elements and the structural system. This approach inherently assumes that the maximum interstory displacements in all of the stories occur at the same time so that their sum adds up to the roof displacement demand. Gupta and Krawinkler (2000) states that this assumption is valid only if the higher mode effects on the dynamic behavior of the structure are negligible. They also suggest that, if the push-over is to capture all maximum story drifts over the height of the structure, then the target displacement should be amplified by the ratio of the sum of maximum story displacements to maximum roof displacement. Since the maximum interstory drift ratio of a story is strongly correlated to the damage of that story, the displacement profile obtained by adding the maximum interstory drift of each story is also expected to be better correlated to the damage distribution within a building than the displacement profile at the instant of maximum roof drift. Hence, capturing the displacement profile at the peak IDR should be the target of a pushover analysis. To address this issue, a new displacement demand parameter termed cumulative interstory drift ratio (C-IDR) is introduced and defined as the ratio of the sum of the maximum interstory drift demand of each story to the total height of the structure:
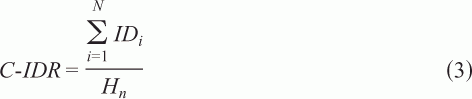
In Equation 3, Hn is the building height and N is the number of story levels. Such a parameter indirectly accounts for higher mode effects and is expected to yield better estimates of local demands. If the maximum interstory drift demand in each story occurs at the same time (single-mode participation), the cumulative interstory drift ratio demand of a structure will be equal to the roof drift ratio (RDR) demand. The ratio of C-IDR/RDR becomes larger than 1.0 for structures in which higher modes influence the response. It is proposed to use C-IDR as a target displacement measure in pushover analysis of structures instead of the conventional roof displacement. In order for C-IDR to replace RDR, approximate expressions that relate the conventional roof drift ratio to cumulative interstory drift ratio are necessary. For this purpose, a new coefficient is de-fined as follows:

A series of nonlinear dynamic analysis was carried out to develop approximate expressions for the C3 coefficient. In addition to the hysteretic models given in Figure 2, two additional relationships namely elastic-perfectly-plastic and bilinear with 2% strain hardening were also used to model the constitutive relationship of plastic hinge zones to evaluate the effect of modeling assumptions on the C3 coefficient. Figure 8 depicts the variation of mean values of C3 with fundamental period for different inelasticity levels and force-deformation relationships for far-fault ground motions. Figure 8 implies that the C-IDR/RDR ratio tends to increase with an increase in the fundamental period of the structure, which indicates that higher mode effects, which typically increase with the number of stories, are better represented in the proposed C3 coefficient. It can also be stated that the level of inelasticity and the force-deformation relation, which typically influence the roof drift demand, have little or no influence on the C-IDR/RDR ratio of the structures for far-fault ground motions.
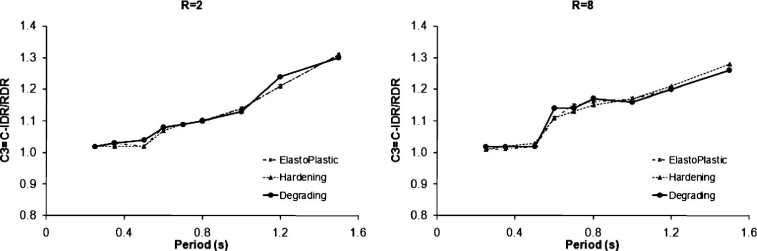
C-IDR/RDR vs. period relationship for various hysteretic models for far-fault ground motions.
Similar results were also observed for near-fault ground motions; i.e., the level of inelasticity and the force-deformation relationship do not significantly affect C-IDR/ RDR ratio for near-fault ground motions.
To incorporate the level of higher mode effects, a parameter previously introduced by Luco (2002) in the definition of an intensity parameter that takes the effect of second mode into account is used. This parameter is defined as the ratio of the product of the absolute value of the second mode participation factor (PF2) and the spectral acceleration at the second elastic mode period (Sa2) to a similar product for the first mode [(|PF2|Sa2) /(|PF1|Sa1)]. This dimensionless parameter is believed to represent higher mode effects since it takes both the dynamic properties of the structure and the amplitude of the ground motion that is associated with the second mode into account. Figure 9 shows the variation of C-IDR/RDR ratio as a function of this new parameter for both far-fault and near-fault ground motions. The data points in Figure 9 were not classified according to the inelasticity level or the constitutive model type since it was previously shown that these parameters do not significantly affect the C-IDR/RDR ratio.
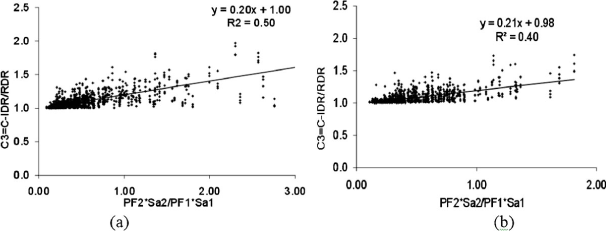
Variation of C-IDR/RDR with |PF2|Sa2/|PF1|Sa1 for (a) far-fault (b) near-fault ground motions.
From Figure 9, C-IDR/RDR ratio can be expressed as a function of this new parameter for both far-fault and near-fault ground motions as follows:

Concluding Remarks
The displacement coefficient method in FEMA 440 2005 was evaluated through nonlinear simulations of multi-story RC frames designed according to IBC (2000). The improved C1 coefficient proposed in FEMA 440 2005 was observed to provide reasonable estimates for inelastic displacement demands for both far-fault records and near-fault records. In an effort to extend the displacement coefficient method to existing buildings with nonductile details, nonlinear simulations were carried out on a range of buildings under the combined effects of strength deterioration, stiffness degradation and P-Delta effects. Findings from the study indicate that degrading effects are more pronounced for short period systems for all levels of degradation and diminishes only for systems with periods greater than 1.0 second and low relative strength (on the order of 2.0). A new approximate expression is proposed to relate displacement demands of degrading systems to that of the nondegrading systems for far-fault and near-fault ground motions.
It was shown that using the roof drift ratio as the target displacement parameter may result in underestimation of the maximum interstory drift ratios particularly for buildings where higher mode effects are more pronounced. Accordingly, a new parameter (C-IDR) defined as the ratio of the sum of the maximum interstory drift demand in each story to the total building height was introduced. A new factor, C3 defined as the ratio of C-IDR to RDR, was proposed based on a series of nonlinear analyses of generic multi-story frames. Approximate expressions for C3 were also provided. Additional studies are needed in the future to improve the approximate expressions proposed. Using C-IDR as the target displacement in pushover analysis is expected to result in better local demand (interstory drift ratio, plastic rotation, etc.) estimates since it indirectly accounts for higher mode effects by considering peak demands in all story levels.