





Abstract
The safety of building structures and contents, as well as the comfort of occupants, under such strong forces as earthquakes and typhoons remain major engineering concerns. In order to improve our understanding of building structural responses, records of a structural array in the 30-story PS Building in Taipei from the M7.6 Chi-Chi earthquake and Typhoon Aere are analyzed. In addition, wind data measured at the Taipei Meteorological Station are also used. First, the field measurement data clearly demonstrate that serviceability of the PS Building met the criteria for occupant comfort during Typhoon Aere. Secondly, several structural vibration parameters of this highrise building, including the transfer functions, natural frequencies, damping ratios and mode shapes, excited by the Chi-Chi earthquake, Typhoon Aere, and ambient vibrations are also determined and compared. The results show the frequency of the first mode for the longitudinal components is approximately 8.6% lower for the earthquake than the ambient vibrations. The transverse mode frequencies behave similarly. In contrast, frequency changes from the typhoon to ambient vibrations are in the third decimal (1.3% and 0.9% lower in the longitudinal and transverse directions, respectively), indicating little nonlinearity. The damping ratios of the PS Building apparently increase with vibration amplitudes. Finally, results of a spectral ratio analysis of the Chi-Chi earthquake data do not indicate significant SSI effects in the longitudinal and transverse directions.
Introduction
Taiwan is located in the Circum-Pacific seismic belt; safeguarding life and property from the destructive effects of earthquakes is a major concern of the people there. Because the most widespread damaging effects of earthquakes are caused by strong ground shaking, effective reduction of life and property losses from strong earthquakes requires the conscientious application of earthquake-resistant building codes and the implementation of appropriate retrofit measures. Ideally, the implementation of these mitigation measures should be based on instrumental recordings of strong earthquakes, for such data are crucial to improving earthquake-resistant design of buildings. Since 1992, the Central Weather Bureau (CWB) of Taiwan has installed 60 digital strong-motion array systems in buildings and other structures for engineering and scientific purposes, as part of its Taiwan Strong Motion Instrumentation Program (TSMIP). It is remarkable that these digital strong-motion arrays have the capability to record building responses not only due to strong motions but also weak ambient vibrations, owing to a flexible gain selection of the amplifier-filter unit at 1, 10, or 100.
In addition to earthquakes, tropical cyclones, commonly known as typhoons, are another kind of frequent and violent natural disaster plaguing Taiwan. The country has experienced 198 typhoons in past 43 years, averaging more than four typhoons per year (Wang et al. 2005). In 2001 alone, typhoons caused 583 deaths and tremendous damage in Taiwan, including more than US $400 million in agricultural losses, and nearly paralyzed the Taipei Rapid Transit System. Thus, the safety of building structures and contents, as well as the comfort of occupants under such strong external forces as earthquakes and typhoons remains a major engineering concern in Taiwan.
Full-scale monitoring can provide valuable data for a realistic evaluation of the dynamic behaviors of tall buildings under typhoon and earthquake excitations. Full-scale measurements under typhoon conditions have become increasingly available in the literature (Li et al. 1998, 2000, 2003, 2004, 2005, 2007; Xu et al. 2001). Analyses of records obtained in buildings during strong earthquakes and ambient vibrations from building have shown the natural frequencies and damping ratio may vary with increasing amplitude of shaking (ATC 2005, Clinton and Heaton 2003, Foutch 1978, Kohler et al. 2005, Li and Mau 1997, Li et al. 2003, Skolnik et al. 2006, Trifunac 1972, Yu et al. 2008). At present, reliable field measurements of both wind and earthquake effects on tall buildings are still limited. In particular, concurrent field measurements of wind and structural responses of tall buildings under both typhoon and earthquake conditions were rarely conducted in the past (Li et al. 2005).
Improved understanding of the effects of climate change and its implication for wind engineering problems is needed to anticipate the future trends of a changing climate. Special considerations are needed to deal with a variety of severe storms and typhoon. (Davenport 2002) Hence, full-scale measurements should be focused on not only the structural responses, but also the sway accelerations affecting the comfort of occupants, i.e., the serviceability of tall buildings. The present study aims to fill a need for more empirical data for evaluating the serviceability and structural response of tall buildings under both strong typhoon and earthquake conditions.
Typhoon Aere, which was the seventeenth typhoon in 2004 that occurred over the western North Pacific, passed by northern Taiwan on 24 August 2004. Wind data measured at the Taipei Meteorological Station and the structural array data recorded in the 30-story PS Building in Taipei are analyzed in this paper to demonstrate that the structural performance of the PS Building met the criteria for serviceability during Typhoon Aere. In the meantime, several vibration parameters of this highrise building, including its transfer functions, natural frequencies, damping ratios and mode shapes of vibration, excited by the typhoon, ambient vibrations and the M7.6 Chi-Chi earthquake, are also determined and compared.
Instrumentation
In order to determine the variations of floor acceleration response as a function of wind speed, the wind data measured at Taipei Meteorological Station (TAP) and the structural array data recorded at the PS Building, located about 3.4 km from TAP, are analyzed in this paper.
The CWB strong-motion structural array uses central recording. Accelerometers are placed at various selected locations in the building and cables are used to bring analog signals from the sensors to a central signal conditioning box. Digitization and recording are then performed at the central site. The main advantage of this configuration is that it is based on well proven technology (Teng, 1992). Specifically, the CWB digital strong-motion structural array has the following features:
Each strong-motion array consists of four components: (i) the accelerometers, (ii) signal cables, (iii) a signal conditioning box, and (iv) a data acquisition/analysis system. Each array supports 32 channels. The accelerometers can respond accurately in the frequency range from DC to 50 Hz in order to record faithfully the motion caused by large earthquakes. In order to record a wide magnitude range of earthquakes, the strong-motion array has a 96 dB dynamic range and at least a 2 g maximum recording capacity. At the central site, a signal-conditioning box is used to condition the analog signals, provides accurate time signals and to provide the electric power required by the accelerometers.
The PS Building, as shown in Figure 1, is located in Taipei, the capital city of Taiwan. It is a tall steel building in one of the most active typhoon regions of the world. The building has 30 stories with a total height of 103.85 m at the roof, as shown in Figure 2. A typical floor plan of the PS Building has a rectangular shape, with a length of 35.4 m in the EW (i.e., x–x or longitudinal) direction and a width of 26.8 m in the NS (i.e., y–y or transverse) direction. The transverse direction of the building deviates from the true north-south axis only by 8° clockwise. The aspect ratio between the height and transverse width is about 4, which has not exceeded the criteria in the current design codes and standards in Taiwan. The fundamental frequency is under 1 Hz (i.e., 0.397 Hz, as determined for the transverse component in the following analysis), suggesting that the PS Building is a flexible structure.
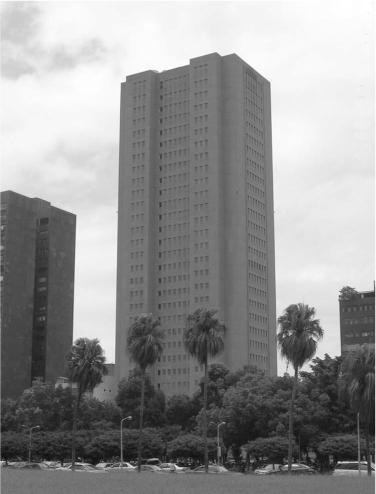
Picture of the PS Building in Taipei.
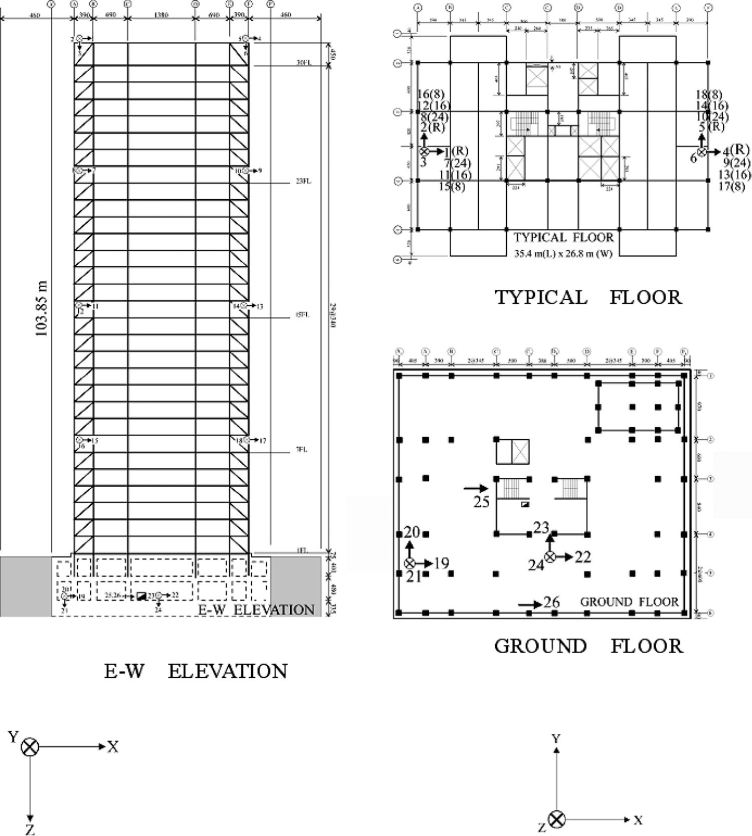
Configurations of the PS Building. Left: EW elevation profile; Top right: a typical floor plan; Lower right: the ground floor plans. The accelerometer components are indicated by arrows.
A total of 26 accelerometers are placed at the basement, eighth, sixteenth, and twenty-fourth floors and the roof. These floors are at heights of −8.8 m, 24.55 m, 51.75 m, 78.95 m, and 103.85 m relative to the ground surface, respectively (Figure 2). The measured wind data, including the wind speed and wind direction, were obtained at the TAP station of the Central Weather Bureau (CWB) of Taiwan, at a height of 34.9 m above ground. The anemometer, installed on the roof of the main CWB Building, was the R.M. Young's propeller anemometer (Model 05103, made in the United States). The measurement ranges of the anemometer for wind speed and direction were from 0 to 60 m/s and from 0° to 360°, respectively.
Records of the Chi-Chi Earthquake and Typhoon Aere
A major earthquake of Mw magnitude 7.6 took place in central Taiwan on 21 September 1999, local time. The epicenter was located near the town of Chi-Chi, after which the event was named. This was the largest inland earthquake to strike Taiwan in the twentieth century. The CWB located its epicenter at 120.82°○ E and 23.85° N, with a focal depth of 8 km. Strong shakings of the earthquake caused devastating impacts at cities and towns as far as 150 km away and destroyed several high-rise buildings in Taipei Basin (Shin and Teng 2001). Records of the Chi-Chi earthquake from the structural array in the PS Building are shown in Figure 3. The largest peak acceleration of 168 cm/sec2 was recorded in Channel 4, located at the roof of the PS Building.
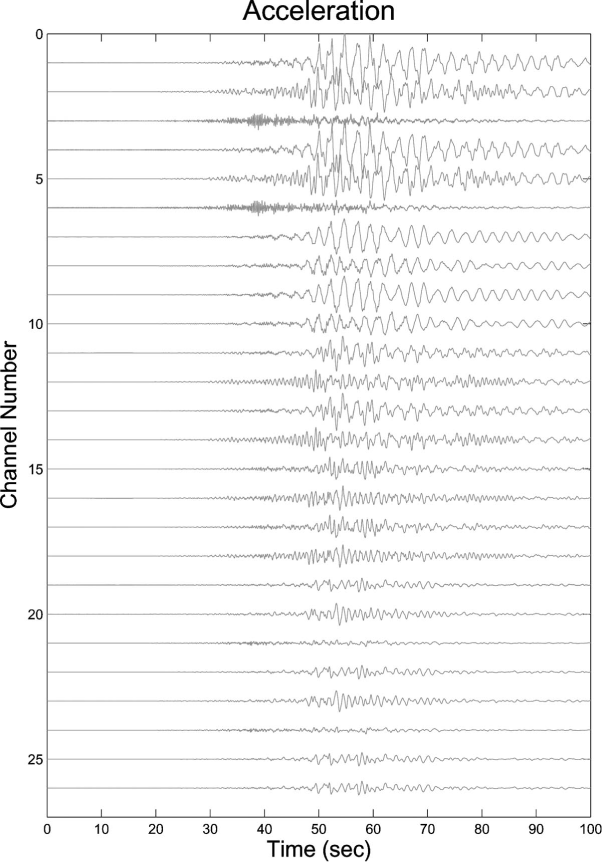
Acceleration time histories of the Chi-Chi earthquake, as recorded by the structural array in the PS Building in Taipei.
The building is also situated in one of the most active typhoon regions in the world. Typhoons attacking Taiwan mainly originate from western Pacific Ocean. In the morning of 20 August 2004, the tropical depression Aere developed over the Pacific Ocean at about 2000 km southeast of Taipei. It intensified into a tropical storm later that afternoon. Typhoon Aere then adopted a northwest course and attained typhoon strength on 22 August. It turned westwards on 24 August and skirted the northern coast of Taiwan the following day. Typhoon Aere caused 24 deaths and left nine people missing in Taiwan. Water supply to 910,000 households was cut off, and power supply to 360,000 households was disrupted. The total economic loss was estimated to be at least NT$ 1.8 billion. (http://www.cwb.gov.tw).
The maximum instantaneous wind speed of Typhoon Aere measured by the anemometer installed at the TAP station was 33.1 m/sec. The maximum 1-minute mean wind speed of 13.3 m/sec was measured at local time of 22:47 (TPT), 24 August 2004. Figure 4 shows the time histories of wind speed, together with the wind direction for 48 hours. These wind data, together with the building response data are used in the following data analysis.
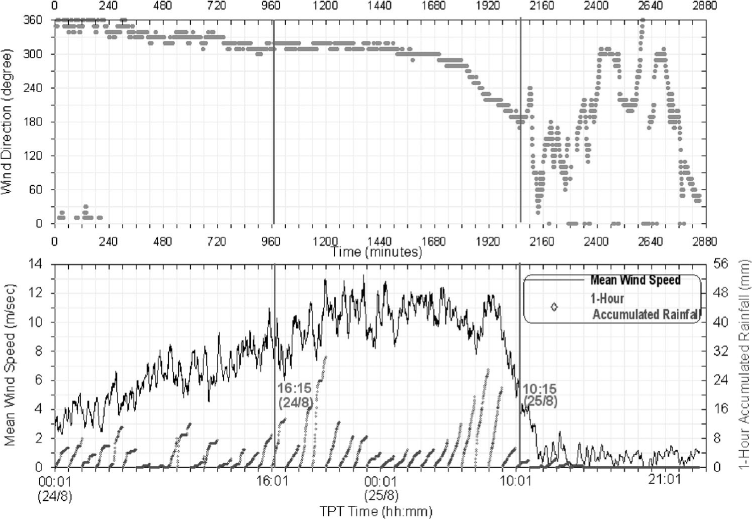
The one-minute mean wind direction (top) and speed (bottom). The vertical dotted lines mark the time interval when the one-minute mean wind speed was above 6 m/sec for the 18-hour duration, starting from 16:15 TPT, 24 August 2004 and ending at 10:15 TPT, 25 August 2004. Data in this interval are used in the analysis. The one-hour accumulated rainfalls are also indicated by diamonds in the lower panel.
In addition to the earthquake and typhoon data, ambient vibrations of the PS Building were also recorded for a duration of 28 minutes on 23 December 2003. The data was recorded by free running the system continuously with a gain set at 10. The record length of each segment was 91 seconds, at a sampling rate of 200 samples per second per channel.
Analysis Methods
Serviceability Performance of the Ps Building
For modern flexible tall buildings, serviceability issues are of paramount important and occupant comfort is a major concern in the design. It has been widely accepted that building acceleration is the most appropriate response component for establishing checking procedure for structural serviceability requirements under wind action (Li et al. 2005; 2007; Melbourne and Palmer 1992). A number of proposals and regulations for limiting wind-induced vibrations have been suggested. Some codes, for example, the National Building Code of Canada (NBCA, 1991) suggests acceptable levels of accelerations as a serviceability requirement, which recommends that a tentative maximum acceleration limitation of 1–3 percent of gravity once every 10 years as a guideline for comfort of occupants. The lower value might be considered appropriate for apartment buildings, whereas the higher value for office buildings. ISO 6897 suggested 5 milli-g rms acceleration criterion for a 6-year return period for building structures (Li et al. 2005).
The serviceability criteria in terms of rms acceleration for a return period of 5 years can be expressed by the following equation (ISO6897 1984):


To evaluate the serviceability of the buildings more properly, one needs to consider the relationship among the resultant acceleration responses, the mean wind speeds, and the occupancy comfort criteria for different return periods. The relationship between the standard deviations of the measured acceleration response averaged over 10-min period and the measured mean wind speed is expressed by the following equation (Li et al. 2005).

Parameters of Vibration of the Ps Building
The measured acceleration data can be used to obtain the dynamic characteristics of the buildings (natural frequencies, damping, etc.). Different sets of modal parameters can be determined from the recorded time histories by several system identification methods, either in frequency domain or time domain. Most commonly used methods are based in frequency domain (Loh and Lin 1996). In order to identify the natural frequencies, damping ratios and mode shapes of the PS Building, two methods in frequency domain, i.e., the transfer function (TF) method and the power spectral density (PSD) method, and two methods in time domain, i.e., the multiple-input multiple-output (MIMO) system identification method and the random decrement method, are used. The TF method is applied to the earthquake records, whereas the PSD method is applied to the records of the typhoon and ambient vibrations (Beck and Jennings 1980). In order to keep the paper within reasonable length, details of the TF and PSD methods can be found in McVerry (1980), Tu (1994), Housner (1970), and Jennings (2002), respectively.
Multiple-Input Multiple-Output (Mimo) System Identification Method
At present, many time-domain and frequency-domain methods are available to extract with high degree of confidence the natural frequencies, mode shapes and fairly good estimates of modal damping of building vibrations. In order to compare the results from different analysis methods, either in frequency domain or time domain, we use the multiple-input multiple-output (MIMO) system identification method developed by Li and Mau (1991) and the modified random decrement method by Li et al. (2004) to study the vibrational behaviors of the PS Building.
The multiple-input multiple-output (MIMO) building system identification method is used on the Chi-Chi earthquake data, in order to take advantage of the availability of multi-channel records at various locations of the building. A brief summary of the method is given here. More details of the MIMO system identification method can be found in Li and Mau (1990). The analytical procedure is based on the least-square-output-error method because the method is easily extended to handle multiple inputs and multiple outputs. The output error is minimized in the time domain. The building is modeled as a classically damped linear second-order system. The system response is obtained through modal synthesis. The procedure developed is intended to be general enough to be applicable to any multi-channel building seismic records.
The MIMO program, developed by Li and Mau (1990), contains following features:
The multiple input-multiple output capability allows the more realistic modeling of the input when the ground excitation in one direction may result in a significant response in an orthogonal direction or there is a torsional input in addition to a translational input. The capability to fix selected parameters facilitates convergence in search for the optimum parameters. For example, the identification may start with a one-mode model and then gradually add more modes while fixing previously determined modal parameters. In this study, the modal frequencies and damping ratios of the three modes are determined separately for each principal direction.
The Random Decrement Method
The dynamic response of a structural system can be greatly affected by the amount of damping exhibited by each mode of vibration. Therefore, reliable determination of damping ratios is important in estimating response of high-rise structures at the design stage. The recorded acceleration data can be used to evaluate the dynamic characteristics of a building (i.e., damping ratio, natural frequencies, etc.). The modified random decrement method developed by Li et al. (2004) is employed in this study to evaluate the damping ratio of the PS Building using the typhoon and ambient vibration data. In order to obtain the damping ratio of each mode, the recorded acceleration signals were bandpass filtered before applying the random decrement method (RDM) to remove the components not related with the mode under consideration. When the observed acceleration data are extracted for free vibrations by the RDM, the damping ratio can be determined by the logarithmic decrement method.
Results and Discussion
Variations of wind speed and wind direction averaged over one-minute intervals are plotted in Figure 4 for the data obtained at the TAP station. In the figure, the x-coordinate shows the Taipei local time (TPT), starting from 00:01 TPT, 24 August 2004 and ending at 23:59 TPT, 25 August 2004. The one-hour accumulated rainfalls, as indicated by diamonds also shown in the figure. Due to limitation of the hard disk capacity of the structural array, free-running mode was initiated to retrieve the time histories of the PS Building response to Typhoon Aere for a 1,729-minute duration starting from 16:15 TPT, 24 August 2004 until 21:00 TPT, 25 August 2004.
In order to obtain the relationships of the peak floor acceleration or peak floor velocity with the wind speed and floor height, 1-minute averaged wind speed values exceeding 6 m/sec for an 18-hour duration, starting from 16:15 TPT, 24 August 2004 and ending at 10:15 TPT, 25 August 2004 are used in the first-step analysis. It can be seen that the winds blowing at the PS Building were mainly in the north-northwest direction between 17:15 TPT, 24 August and 04:00 TPT, 25 August 2004. The wind direction then changed gradually from northwest to the south in counterclockwise until 10:00 TPT, 25 August, after Typhoon Aere moved west of Taipei.
Acceleration Response and Performance of Ps Building during Typhoon Aere
In this study variations of the peak floor acceleration (PFA) or peak floor velocity (PFV) of the PS Building with respect to 1-min-mean wind speed and the height of individual floors are examined. Figure 5a shows the smoothed PFA, in terms of half of the peak-to-peak acceleration, of the transverse acceleration time-histories of the PS Building, recorded by accelerometers located at its east side of the basement (Channel No. 23), eighth floor (Channel No. 18), sixteenth floor (Channel No. 14), twenty-fourth floor (Channel No. 10), the Roof (Channel No. 5) for a 29-h duration. They show significant differences in the peak acceleration at different floors (i.e., floor height) in the building. It is interesting to note that the PFA increases with the floor height and has a positive correlation with the wind speed. Similar results are found in the corresponding PFV data, as shown in Figure 5b.
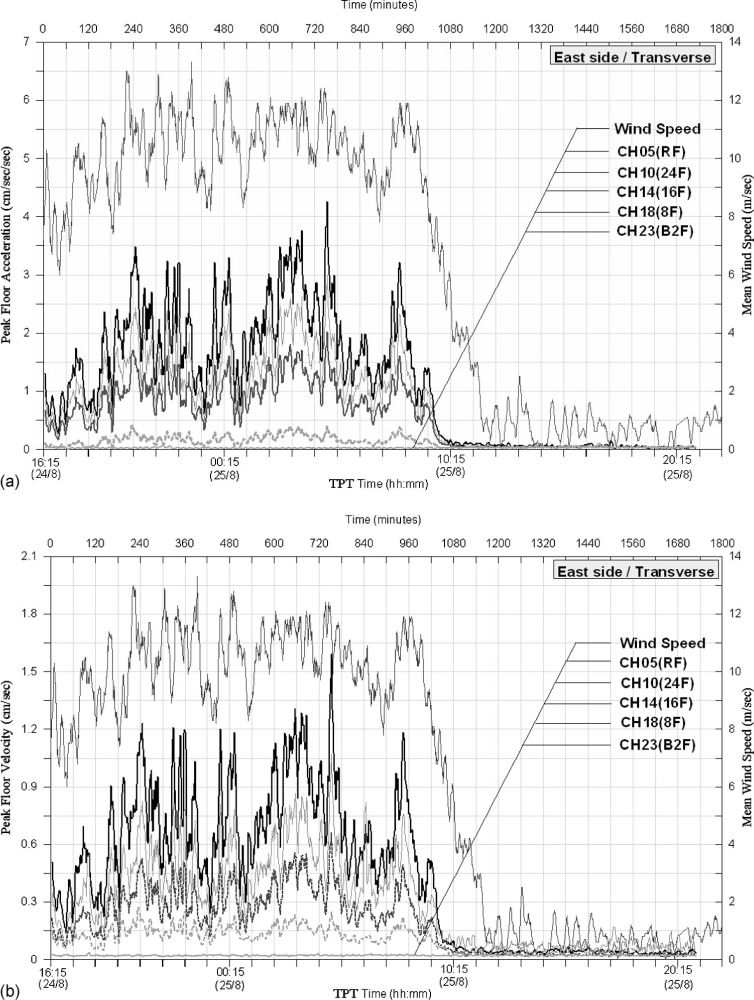
(a) The smoothed peak floor acceleration (PFA), in terms of half of the peak-to-peak acceleration, of the transverse acceleration time histories, recorded by the accelerometers located at the east side of the PS Building during a 29-h duration. (b) The corresponding peak floor velocity (PFV) data.
The half of peak-to-peak value of longitudinal and transverse acceleration response of the PS Building on the roof (Channel Nos. 1 and 5) are 4.439 and 6.652 gal, respectively, as shown in Table 1. The maximum peak horizontal accelerations, as calculated by Equation 2 (Melbourne and Cheung, 1988) with a natural frequency of 0.397 Hz (as obtained later) for return periods of 1 year and 5 years, are 8.53 and 12.56 gal, respectively. Thus, we can conclude that the dynamic performance of the PS Building during Typhoon Aere met the serviceability criteria.
Maximum accelerations (gal) of the PS Building observed during Typhoon Aere

This study also examines the variations of acceleration response of the PS Building with 10 min mean wind speed. Figure 6 shows the variations with time of the standard deviation of transverse acceleration response from the east accelerometers of the PS Building over 10 min intervals and the mean wind speed during the passage of Typhoon Aere. It shows the rms acceleration increases with the floor height and has a positive correlation with the wind speed. The measurements of wind action during the passage of Typhoon Aere were made at the TAP station. The 1-min mean wind direction measured at TAP varied in the range of 280–320°. From 16:15 TPT 24 August to 06:15 TPT, 25 August, the variation of wind direction was small, with a mean wind direction of about 310° during the 14 h recording period.
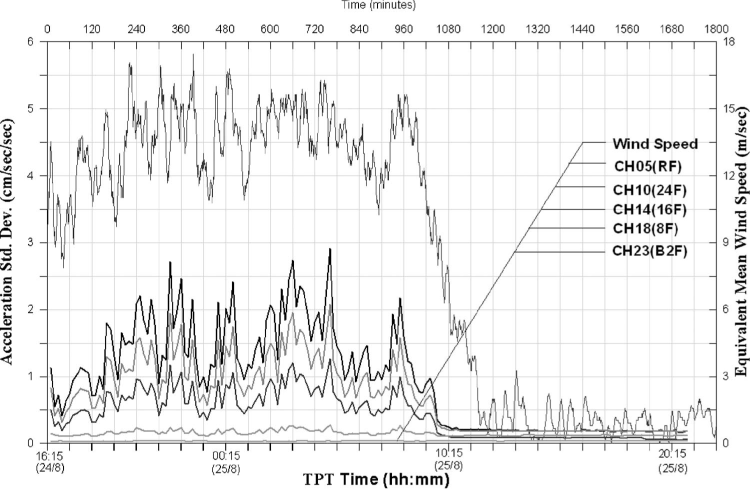
Variations with time of the standard deviation of transverse acceleration responses from the east accelerometers of the PS Building over 10 min intervals and the observed wind speed during the passage of Typhoon Aere.
The relationship between the standard deviations of the measured acceleration response, averaged over 10 min periods, in the longitudinal and transverse direction and the mean wind speed adjusted to the height of the PS Building are shown in Figures 7 and 8, respectively. It shows that both components of acceleration increase monotonically with mean wind speed atop the tall building during the passage of Typhoon Aere. As mentioned previously, the mean wind speeds measured from the anemometer installed at the TAP station were transferred to those at the top of the main structure of the PS Building (corresponding to the height of 130.85 m from ground surface) according to Equation 4, as shown below.
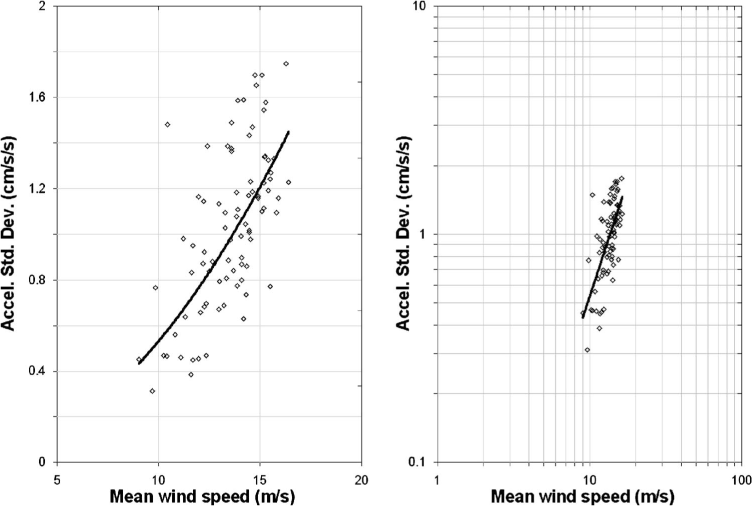
Relation between the standard deviation of acceleration responses in the longitudinal direction and the mean wind speed. Data in diamond and regression curve in solid line.
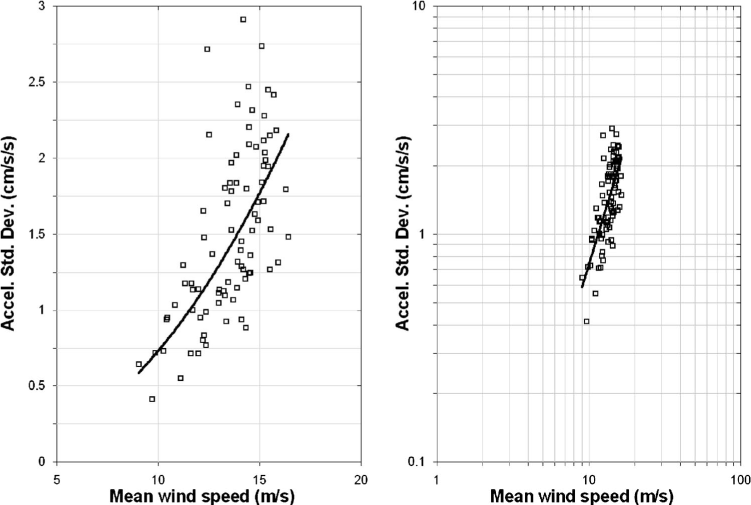
Relation between the standard deviation of acceleration responses in the transverse direction and the mean wind speed. Data in square and regression curve in solid line.
The 10-minute averaged wind speed, which was measured at TAP station at a height of 34.9 m above the ground level needs to be corrected to the standard height of 10 m above the ground level, as adopted by the World Meteorological Organization. To correct the anemometer height to the standard level or other desired heights, the following power law equation can be used:

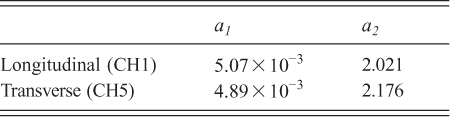
Figures 7 and 8 show the observed acceleration responses with the corresponding regression curves as expressed by Equation 3 for each direction. The associated parameters a1 and a2 are listed in Table 2. The measured data during Typhoon Aere show that the standard deviation of acceleration response at top of the PS Building increases with a power of 2.021 of the wind speed in the longitudinal direction, and a power of 2.176 of the wind speed in transverse direction. It is also observed that the acceleration responses in the transverse direction were generally larger than in the longitudinal direction during the typhoon. This is mainly due to greater stiffness of the building in the longitudinal direction than the transverse direction. This is further supported by the results from the transfer function method to be presented later in Figure 9.
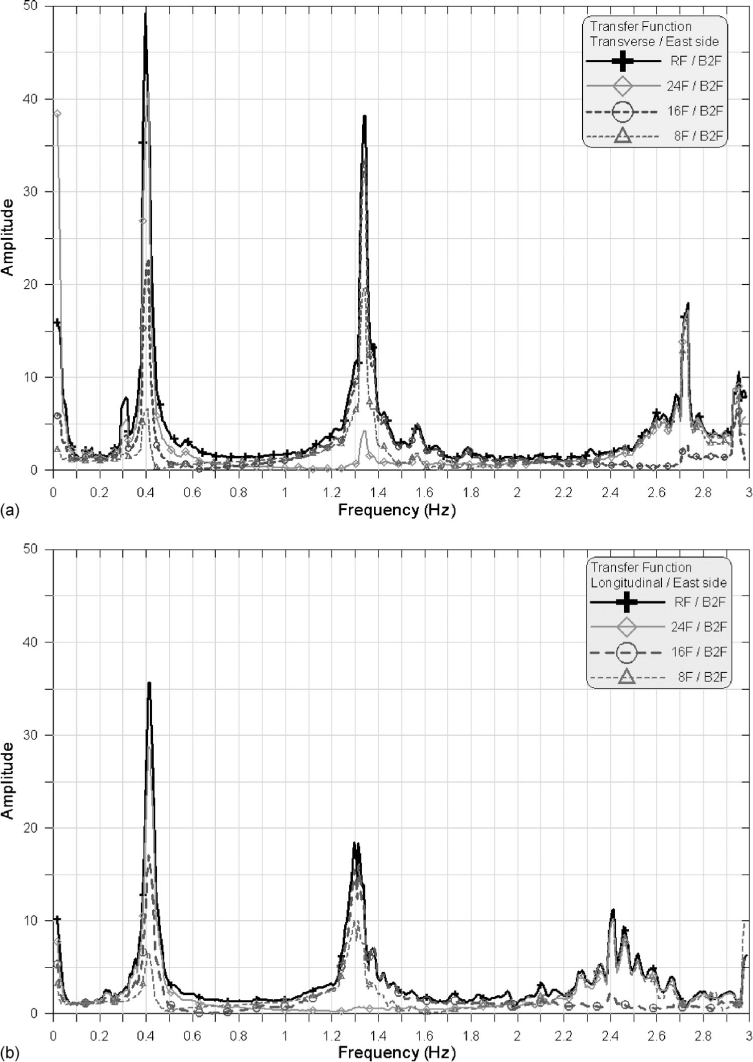
The transfer functions of vibration in frequency domain at different floor heights of the PS Building: (a) for the transverse (T) component, (b) for the longitudinal (L) component.
Parameters for the regression curves described in Equation 3
In order to check the serviceability of the PS Building under wind action, the criteria in terms of rms acceleration for a return period of 5 years is determined to be 3.80 gal for a natural frequency of 0.397 Hz which is determined in the following section. It is found that the rms acceleration responses measured atop the buildings during Typhoon Aere, as given in Table 1, were all under the serviceability criteria for occupancy comfort. It can be concluded that the performance of the PS Building during Typhoon Aere met the serviceability criteria.
Natural Frequencies, Damping Ratios and Mode Shapes of Vibration of the Ps Building
In the present study, only the first three modes of the building response are considered since higher modes are of little significance in overall building responses (Li and Mau 1992). In the following the recorded data in the PS Building from a major earthquake, typhoon and ambient vibrations are used to identify the natural frequencies, damping ratios, as well as the mode shapes of the first, second, and third modes of vibration in the longitudinal and transverse directions.
For earthquake data, the transfer function method and the MIMO system identification program are used to obtain the dynamic characteristics of building vibrations. For ambient vibrations and typhoon data, the data are analyzed by the power spectral density method and random decrement method to determine the modal properties of the PS Building.
The natural frequencies and damping ratios of the first three translational modes in each direction evaluated by using the MIMO method from the observed acceleration data are summarized in Table 3. Figures 9a and 9b show the transverse and longitudinal transfer functions in the frequency domain, respectively, as obtained from the Chi-Chi earthquake data by the east-side sensors in the PS Building. By examining the observed transfer functions, the natural frequencies of the first, second, and third transverse modes of the PS Building are found to be 0.397, 1.338, and 2.720 Hz, respectively. The corresponding results for the longitudinal component are 0.416, 1.308, and 2.402 Hz, respectively.
Observed modal frequencies f(Hz), damping ratio ξ(%) and percentage deviation of modal frequency relative to the calculated Building Code value δ(%) in the (a) longitudinal (L) directions and (b) transverse (T) directions of the PS Building
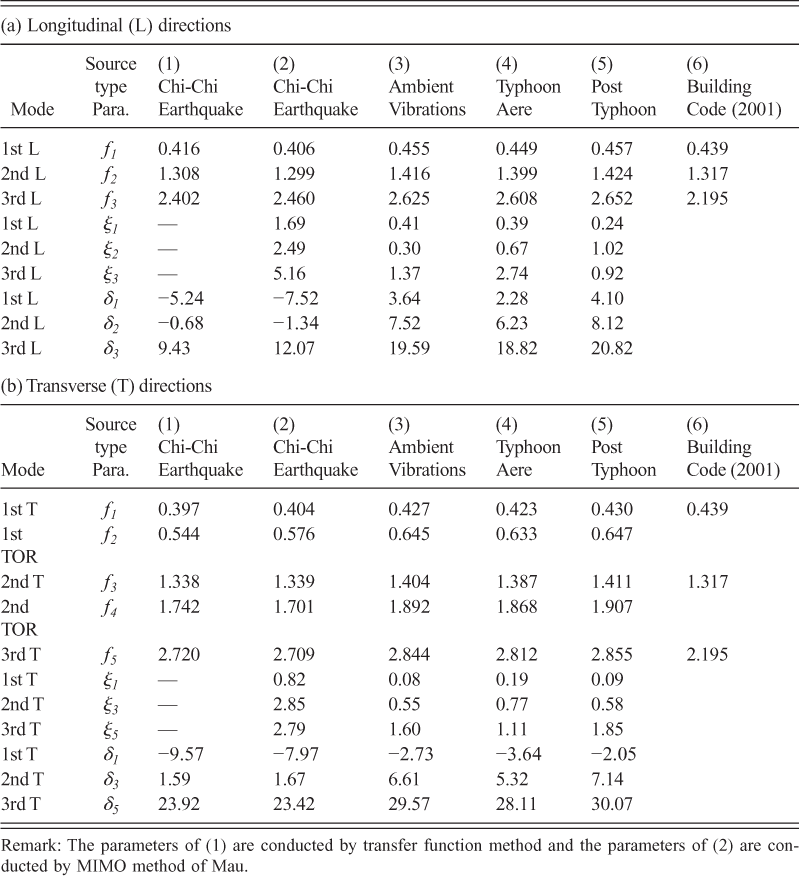
Remark: The parameters of (1) are conducted by transfer function method and the parameters of (2) are conducted by MIMO method of Mau.
Taking the PS Building as a steel structure with eccentrically braced frame, the corresponding fundamental mode period according to the building code can be calculated as follows (Tsai et al. 2001):

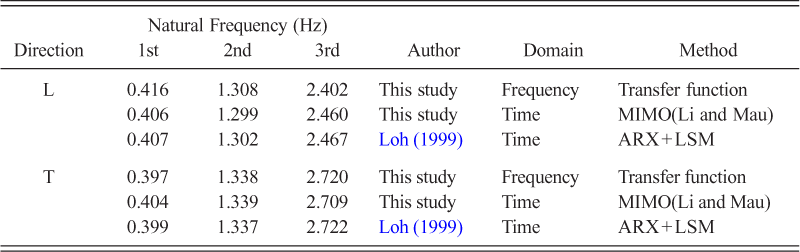
Previously, Loh et al. (1999) used a discrete-time linear filtering theory (ARX model), together with a least-squares estimation method to analyze the seismic response of the PS Building from the Chi-Chi earthquake data. Their results are also listed in Table 4. It is evident from the table that the natural frequencies of the first three modes, as identified by the three different methods, either in frequency domain or time domain, are very close to each other.
Observed modal frequencies f(Hz) in the longitudinal (L) and transverse (T) directions of the PS Building as determined by three different system identification methods
Furthermore, we have checked whether the length of segment used to process the data would have a significant effect on the estimates of natural frequencies and mode shapes, especially when the structure has closely spaced modes. The following formula is applicable to the spectral estimates of TF method and PSD method. The resolution bandwidth for spectral estimate is as follows (Bendat 1978):

After having identified the natural frequencies and damping ratios of the first, second, and third modes from the Chi-Chi earthquake data, we now proceed to analyze the typhoon and ambient vibration data. By examining the observed power spectral density, it is clear that some torsional response had taken place. For the present case the torsional motion can be found from the difference in N–S (transverse) motion between the west and east ends of the building. This definition of torsional motion is adopted for the convenience of system identification. The natural frequencies of the first two torsional modes in the transverse direction from the observed acceleration data are given in Table 3. Furthermore, in order to obtain the damping ratio of each mode, a random decrement method is employed to reduce the observed data so as to extract free vibration response both in the longitudinal and transverse directions. Then, the logarithmic decrement method is applied to calculate the damping ratios, as given in Table 3. These results show that the damping ratios of the PS Building excited by the Chi-Chi earthquake are significantly higher than that excited by either the typhoon or ambient vibrations. The damping ratio apparently increases with the vibration amplitude of the building.
In Table 3 and Figure 10 the observed and the corresponding building code values for the first, second, and third natural frequencies in the longitudinal (L) (dark line) and transverse (T) (light line) directions are compared. Shown in the left panel of Figure 10 are the first, second, and third natural frequencies identified from the Chi-Chi earthquake records (in a straight line made up by 1 record) and ambient vibration data (in a zigzag line made up by 18 segments), whereas shown in the right panel are results from the recorded Typhoon Aere data (in a zigzag line made up by 1141 segments), respectively. The natural frequencies, as identified from each segment with a record length of 91 s, of the ambient vibration data and Typhoon Aere data are shown in Figure 10. The long dash and short dash lines stand for the average natural frequencies, which are calculated from the total segments of records, in the longitudinal (L) and transverse (T) directions, respectively.
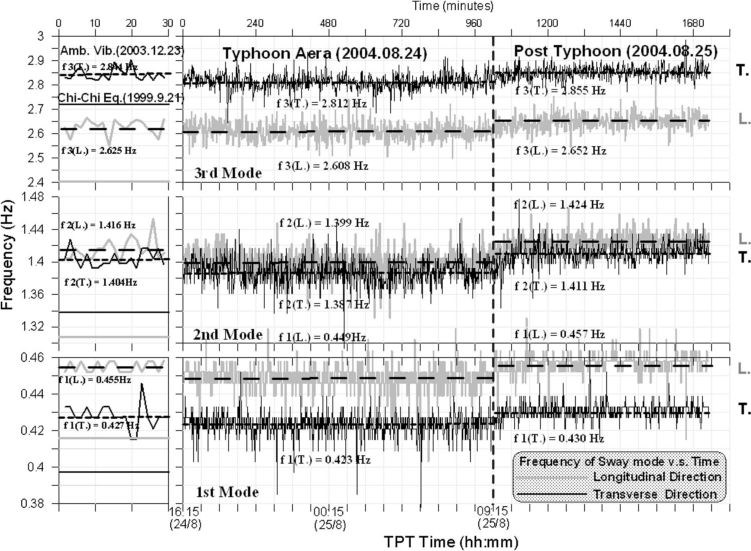
The natural frequencies of the first, second, and third mode (from bottom to top) in the longitudinal (L) (dark line) and transverse (T) (light line) directions as determined from the recorded data of the earthquake, typhoon and ambient vibrations. The left panel shows the frequencies of the first, second, and third mode from the Chi-Chi earthquake data (in straight lines, as obtained from the whole record) and from the ambient vibration data (in zigzag lines, as obtained from 18 segments of records). The right panel shows similar results from the Typhoon Aere data (in zigzag lines, as obtained from 1,141 segments of records). The long-dash and short-dash lines represent the average natural frequencies calculated from all segments of records, in the longitudinal (L) and transverse (T) directions, respectively.
The following can be noted from Figure 10 and Table 3. 1. The natural frequencies of ambient vibrations are very close to that of the post typhoon time period. 2. The observed fundamental frequencies changed in time from low to high as excited first by the earthquake, then the typhoon and finally the ambient vibrations. This means the stronger the external force acting on the building, the lower the fundamental frequency becomes. 3. A significant frequency step-up appears at the time near 09:15, 25 August when Typhoon Aere was moving away and the 1-min-mean wind speed has reduced to under 8 m/sec, especially in the first and second natural frequencies. 4. The fundamental frequencies are lower for the transverse component than the longitudinal component. This is probably because the stiffness of the building in the longitudinal direction is greater than in the transverse direction. 5. At higher frequencies (i.e., third mode), the longitudinal component has a lower natural frequency than the transverse component. This is probably due to presence of shear walls or nonstructural components which may result in higher natural frequency. These nostructural components are distributed more densely in the transverse direction. Consequently, they may result in higher stiffness.
It has been demonstrated that the fundamental frequency of the building may vary with the intensity of excitation force. The change in frequency may be attributed to one or more of the following causes:
Change in building effective stiffness, which could be due to the cracking of RC sections on the tension side and/or the disengagement of stiffness-contributing nonstructural elements. Change of foundation stiffness due to softening in the soil at larger strains and the resulting effect of soil-structure interaction. Structural damage (Li and Mau 1997, Skolnik et al. 2006, Yu et al. 2008). The soil-structure interaction (SSI) can significantly alter the characteristics of recorded motions in buildings. The dominant frequency of a building subject to SSI will be smaller than that of a fixed-base building. The ratio of Fourier amplitude spectrum of the top-story accelerations to that of the foundation accelerations permits the identification of the natural frequency of the fixed-base building (Kohler et al. 2005, Safak 1995).
In order to determine if the frequency reduction in the earthquake was caused by soil-structure interaction, we calculated spectral ratio for the Chi-Chi earthquake. The spectral ratio of the accelerations (roof/basement), together with the Fourier Amplitude Spectrum (FAS) of the roof and basement accelerations are shown in Figure 11 for the longitudinal and transverse directions. It is noted that the peaks of the roof FAS and the spectral ratio appear to coincide with each other, suggesting that there is no significant SSI effects in both the longitudinal and transverse directions.
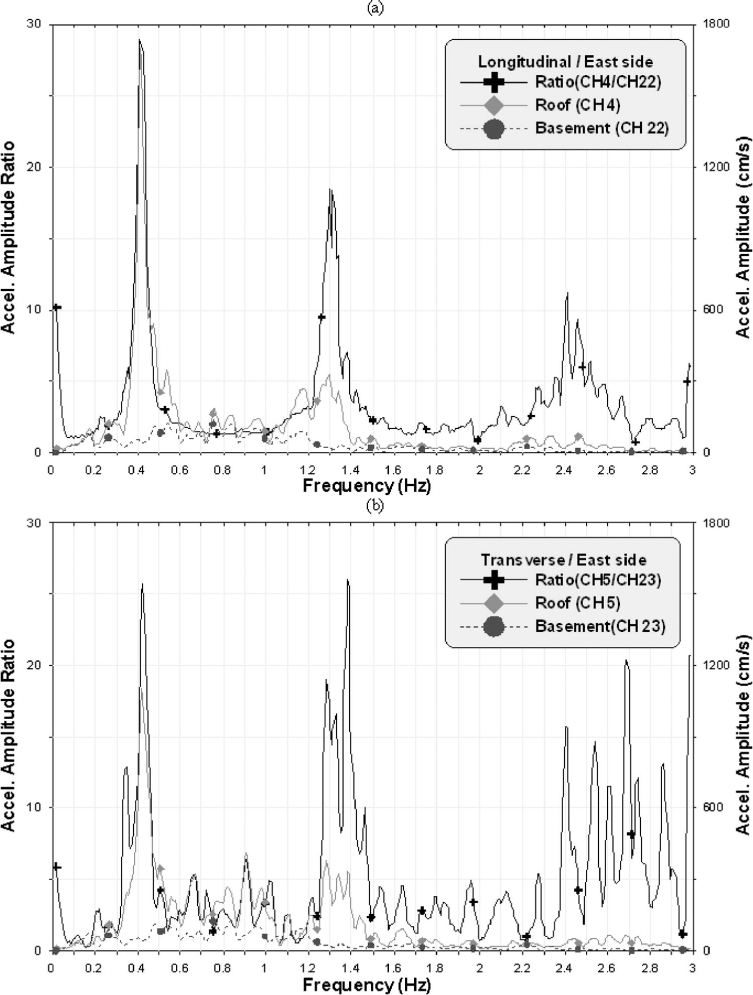
Fourier Amplitude Spectra of acceleration at the roof and basement of the PS Building and their ratio: (a) for the longitudinal (L) component, (b) for the transverse (T) component.
Moreover, an improved understanding of the effects of climate change and the implication for wind engineering problems is needed to anticipate the future trends of a changing climate. Special consideration is needed to deal with a variety of hurricanes (e.g., high winds and heavy rains) (Davenport 2002). Hence, we also try to access the potential impact by weather effects for the soil stiffness variation due to water content. In Figure 4 the one-hour accumulated rainfalls seem to indicate a positive correlation with the wind speed, especially at the peaks of wind speed. However, this only contributes to frequency changes from ambient vibrations to the typhoon in the third decimal (1.3% and 0.9% lower in the longitudinal and transverse directions, respectively) as given in Table 3, suggesting only minor potential effects of rainfalls.
In contrast, comparison of mode frequencies between the earthquakes and the ambient vibrations, the frequencies for the ambient vibrations are significantly higher in each individual mode. Comparing the Chi-Chi earthquake with ambient vibrations for the first mode, the earthquake peak frequency for the longitudinal components (0.416 Hz) is approximately 8.6% lower than the average first-mode frequency (0.455 Hz) for the ambient vibrations. The transverse mode frequencies behave similarly.
The dynamic properties of tall buildings tend to be the result of a combination of shear and bending deformation (Clough and Penzien, 1993). If the building is behaving like a pure shear beam, one would expect frequency ratios between the first, second and third modes to be 1:3:5. For a pure bending beam, the ratios would be about 1:6:18. It is clear from the Chi-Chi earthquake data that the PS building behaves very much like a shear beam, with ratios of 1:3.1:5.8 for the longitudinal direction and 1:3.4:6.8 for the transverse direction. The slight differences may be due to minor bending deformation in each direction. It is noted that the observed frequency ratios from the typhoon and ambient vibration data are about the same as those from the earthquake data.
After identification of the natural frequencies is completed for the first, second, and third modes, our next step is to determine the corresponding mode shapes associated with these frequencies. Figure 12a–12c shows the mode shapes of the PS Building in both longitudinal and transverse components, corresponding to the first, second, and third natural frequencies using the Chi-Chi earthquake data. Figure 12d, as enlarged from Figure 12a, shows the following. 1. The amplitude ratios of the fundamental mode at lower floors, 8F and 16F, are lower in the transverse component than in the longitudinal component. This means more flexible behaviors in the transverse component, probably due to lower stiffness of the building in the transverse than the longitudinal direction. 2. The amplitude ratios in the same direction but at different sides of the PS Building are different, especially at the higher floors, 16F and 24F. The difference between the east and west sides in both transverse and longitudinal dynamic responses indicates presence of torsional vibrations of the building. After having identified the first and second natural frequencies relative to torsional response in the transverse (T) direction of the PS Building using the recorded earthquake, typhoon and ambient vibration data, we find the ranking of the frequencies from low to high is again moving successively from the Chi-Chi earthquake, Typhoon Aere and the ambient vibrations. An interesting observation is that the torsional frequencies are only slightly higher than the corresponding translational frequencies. Presently, there is no code formula for estimating the torsional frequencies.
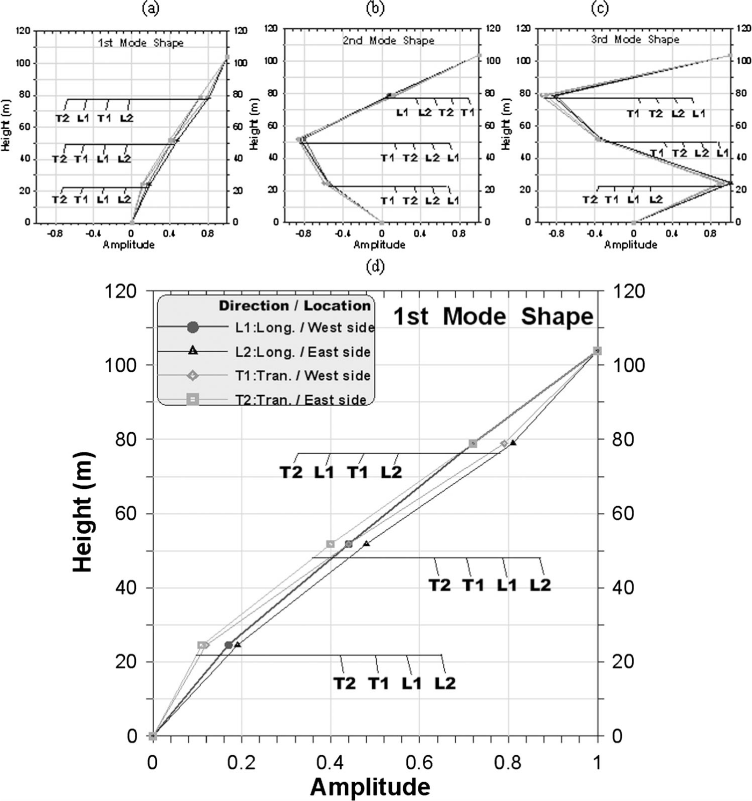
The normalized mode shapes of vibration of the PS Building for the longitudinal and transverse components based on the Chi-Chi earthquake data: (a) at the natural frequency of the first mode, (b) at the natural frequency of the second mode, and (c) at the natural frequency of the third mode. (d) Enlarged version of (a).
Finally, in order to compare the mode shapes of the building in response to the earthquake, typhoon and ambient vibrations, we have normalized the mode shape ratios and their corresponding standard deviations for the first, second, and third natural frequencies both in the longitudinal and transverse directions. The results show that the fundamental mode shapes of the PS Building excited by the Chi-Chi earthquake resemble more closely with shear deformation than that excited by Typhoon Aere and ambient vibrations.
Conclusions
The present study investigates the vibratory characteristics of a 30-story high-rise building in response to a major earthquake and typhoon as well as ambient vibrations. This presents an opportunity for us to compare building behaviors, especially their modal properties under different types of excitation. Based on above results and discussion, we can draw the following conclusions:
The wind-induced acceleration responses of the PS Building were found to be monotonically increasing with the measured wind speeds. The measured data show that the standard deviations of acceleration responses atop the building increase with a power of 2.02–2.18 of the wind speed. It was observed that the peak acceleration responses measured atop the tall building during Typhoon Aere were under the serviceability thresholds for occupancy comfort. Based on the observed transfer functions from the Chi-Chi earthquake data, the first, second, and third transverse natural frequencies of the PS Building are found to be 0.397, 1.338, and 2.720 Hz, respectively. The corresponding frequencies for the longitudinal component are 0.416, 1.308, and 2.402 Hz, respectively. The results on modal frequencies determined by three different system identification methods, either in frequency domain or time domain, are very close to each other. The observed fundamental mode frequencies are found to be lower than that calculated from the current building code formula by less than 10%. With the information in this paper and other similar data, the code period expression could be revisited and possibly modified. The fundamental natural frequencies identified from the data recorded for the earthquake, typhoon and ambient vibrations increased successively from low to high as the building was subject to excitation of the Chi-Chi earthquake, Typhoon Aere, and the ambient vibrations. This means that stronger excitation forces of the earthquake have resulted in lower natural frequencies than that produced by the weaker excitation forces of the typhoon and ambient vibrations. This is in good agreement with results obtained from recent tests in the United States (Kohler et al. 2005, Skolnik et al. 2006, Yu et al. 2008). Furthermore, the damping ratios of the PS Building observed from the Chi-Chi earthquake data are significantly higher than that observed either from the typhoon or ambient vibrations data. The damping ratio of the PS Building apparently increases with vibration amplitudes. From the spectral ratio of the accelerations (roof/basement), along with the FAS of the roof and basement accelerations for the Chi-Chi earthquake, it is noted that the peaks of the roof FAS and the spectral ratio seem to coincide, suggesting that there is no significant SSI effects in both the longitudinal and transverse directions. Comparing the Chi-Chi earthquake with ambient vibrations for the first mode, the earthquake frequency for the longitudinal components is approximately 8.6% lower than the average first-mode frequency for the ambient vibrations. The transverse mode frequencies behave similarly. In contrast, the frequency changes from the typhoon to the ambient vibrations appear in the third decimal (1.3% and 0.9% lower in the longitudinal and transverse directions, respectively), indicating only minor potential effects of rainfalls. The fundamental frequency is lower for the transverse component than the longitudinal component. This is probably because the stiffness of the building is smaller in the transverse direction than the longitudinal direction. On the contrary, the higher mode frequency (i.e., third mode) is lower for the longitudinal component than the transverse component. This is probably due to presence of more shear walls or nonstructural components in the transverse direction. The observed ratios among the first three modal frequencies, at 1:3.1:5.8 for the longitudinal direction and 1:3.4:6.8 for the transverse direction from the Chi-Chi earthquake data show that the PS building deforms primarily like a shear beam. Similar results on the frequency ratios are also obtained from the typhoon and ambient vibration data. The normalized amplitude ratios of motion in the same direction but at the opposite sides of the same floor height are different, especially at higher floors, 16F and 24F. The difference between the east and west sides of the building in both transverse and longitudinal dynamic responses indicates presence of torsional vibrations. The first and second natural frequencies of torsional response in the transverse directions of the PS Building are identified from the earthquake, typhoon and ambient vibrations data. These observed frequencies rank successively from low to high from the Chi-Chi earthquake, to Typhoon Aere, and to the ambient vibrations. An interesting observation is that the torsional frequencies are close to the translational frequencies for the first and second modes. Currently, there is no formula available in the building code for estimating the torsional frequencies.
Footnotes
Acknowledgments
We thank the Central Weather Bureau of Taiwan for providing excellent seismic and wind data for the present study. We also appreciate Prof. S.T. Mau for providing the MIMO computer program for system identification. We are grateful to anonymous reviewers for their critical and helpful comments, which have led to significant improvement of the paper. This research was supported by the Taiwan Earthquake Research Center (TEC) funded through National Science Council (NSC) with Grant No. NSC97-2625-M-244-001 and NSC98-2625-M-244-001. The TEC contribution number for this article is 00057.