






Abstract
We present reference noise models for high-quality strong-motion accelerometer installations. We use continuous accelerometer data to derive very broadband (50 Hz–100 s) high- and low-noise models. The proposed noise models are compared (1) to the broadband seismometer Peterson (1993) noise models; (2) the datalogger self-noise and background noise levels at existing Swiss and Southern California strong-motion stations; and (3) typical earthquake signals recorded in Switzerland and worldwide. The accelerometer low-noise model (ALNM) is dominated by instrument noise from the sensor and datalogger. The accelerometer high-noise model (AHNM) reflects (1) at high frequencies the acceptable site noise in urban areas, (2) at mid-periods the microseismal peaks and (3) at long periods the maximum noise observed from well-insulated sensor/datalogger systems placed in vault quality sites. This study also provides confirmation of the remarkable capability of modern strong-motion accelerometers to record low-amplitude ground motions with seismic observation quality over a broad frequency range.
Introduction
Noise models for seismic stations provide a crucial guide to the quality of the seismic installation and the selected site. Models based on microseismic noise have been derived for many decades (e.g., Brune and Oliver 1959). The current reference model for stations equipped with very broadband velocity sensors are the Peterson (1993) high- and low-noise models, developed by the U.S. Geological Survey (USGS) and the Albuquerque Seismological Laboratory (ASL). These upper and lower bounds constrain the range of acceptable noise amplitudes across a broad period range, derived from high-quality instrumentation and vaults in the Global Seismic Network (GSN). These models continue to be important guidelines for evaluating and comparing station site characteristics; for defining technical specifications for instruments; and for predicting the response of sensor systems to quiet and noisy background conditions (Peterson 1993, Berger et al. 2004).
In spite of the widespread use of noise models in the seismological community, no comparable effort to develop reference models for accelerometer station installation exists in the engineering community. This may be partly explained by the relatively recent deployment of very high-quality acceleration sensors recording on 24bit dataloggers with continuous data observation. Prior to this, the typical strong-motion installation traditionally used up to 19bit dataloggers operating in triggered mode recording low dynamic range accelerometers optimized to record the strongest ground motions (∼1 g clip level). Indeed, only two decades ago, the vast majority of strong-motion systems were analogue, with very limited frequency response and low dynamic range typically not exceeding 60 dB (see e.g., Trifunac and Todorovska 2001, Douglas 2003).
Consequently, 1) the background noise was rarely measured as only records reaching preselected minimum acceleration levels well above the background noise were recorded and 2) even if a continuous recording were made, the datalogger/sensor noise would be so high that background noise would be observed only at very noisy conditions. Current trends to incorporate high-quality strong-motion sensors and dataloggers into broadband seismic networks (e.g., Clinton et al. 2011) now allow high-fidelity recording of small earthquakes at close distances, at amplitudes that are far below the traditional trigger levels of the order of 1-to-10 mg for strong-motion stations (see Douglas 2003 and Zambonelli et al. 2011 amongst others). There is now a need to maximize the amplitude range of the signal by ensuring candidate strong-motion sites have minimum site noise (e.g., COSMOS 2001).
As research over the last decades has emphasised displacement-based (capacity design) concepts (Priestley et al. 2007) in earthquake engineering, the ability to recover displacements at longer periods, and hence the waveform quality in general, has become a key parameter in the selection of accelerometric traces (Douglas 2003). This is important across a wide range of engineering applications, from nonlinear time-history analyses of structural response to basic seismic hazard assessment. At the same time, the progressive introduction of broadband accelerometric sensors recording on high dynamic range dataloggers within seismic networks has blurred the traditional boundary between weak and strong ground motion (Boore 2005a). Networks now routinely record digital ground motion acceleration records of seismic observation quality (i.e., quality of these data is comparable to that expected from a seismological broadband sensor installation, from the point of view of low noise across a broad frequency range), and what are traditionally engineering data (acceleration waveforms) are now available continuously in real-time, including aseismic noise. Boore (2005a) described this new reality as the basis for “a new era in engineering seismology.” Further, strong-motion sensors are now routinely being placed at both sites of seismic vault standard (often co-located with broadband sensors to ensure a given site can record the full spectrum of earthquake motion) as well as soft soil sites in urban areas. An improved understanding of the optimal possible performance of typical state-of-the-art accelerometer stations is a basic prerequisite to appropriate installation and evaluation of their potential usage in seismology and earthquake engineering studies.
This study presents new reference noise models for high-quality strong-motion accelerometer installations. Continuous accelerometer data from (1) the Swiss Seismological Service at the ETH Zürich (Clinton et al. 2011) and (2) the Southern California Seismic Network (SCSN 2011) are used to derive very broadband (50 Hz–100 s) high- and low-noise models. There is particular emphasis on the potential use of the new models for strong-motion network operators and researchers.
A note on terminology: to be consistent with naming conventions typical in the seismology community, in this manuscript the term broadband (BB) refers to high-gain wide-passband seismological instrumentation, that is, velocity sensors with flat response to velocity over a broad frequency range (typically spanning between 360 s and 120 s to between 20 Hz and 100 Hz). The term strong-motion (SM) in the context of this paper, describes modern low-gain accelerometer sensors, that are also broadband and are characterised by a flat response to acceleration from ∼200 Hz to DC.
Accelerometric Data used in this Study
The data used in this study are collected by the seismic networks in Switzerland and Southern California. The Swiss Seismological Service (SED) at the ETH Zürich (ETHZ) is the Swiss federal agency responsible for monitoring the seismicity of Switzerland and surrounding areas, providing rapid notification to the local authorities and the public, and archiving and providing reliable data for seismological and earthquake engineering research studies. The SED manages both a high-gain broadband/short-period seismometer network and a low-gain strong-motion network. The former is intended to monitor earthquake activity at magnitudes well below the human perception threshold (Deichmann et al. 2008), whereas the latter is principally aimed at engineering purposes.
The strong-motion network in Switzerland (SSMNet) has been progressively modernized and densified since 2000, when the first high-quality stations were installed co-located with some broadband stations. High-quality, stand-alone strong-motion stations at sites of engineering interest began to be installed in 2005. The strong-motion network is currently being rapidly expanded: by 2018, over 130 strong-motion stations should be operational in Switzerland. Modern strong-motion stations are integrated into the network in the same manner as broadband stations, that is, the high dynamic range instruments are continuously monitored in real-time at high sampling rates. Currently, strong-motion sensors are co-located with broadband sensors at 12 sites, and similar instrumentation is installed at 30 (this number is rapidly increasing) free-field, mainly urban locations.
The geographical distribution of the main broadband and accelerometric stations continuously monitored by the SED is presented in Figure 1. Note the densification of strong-motion stations in the Basel Area, the Valais and the Graubünden, where the Swiss earthquake hazard is highest (Wiemer et al. 2009). The Swiss strong-motion sites used in this study are described in Table 1, along with the recording starting date, sampling rate, sensor and datalogger type at each co-located/stand-alone station.
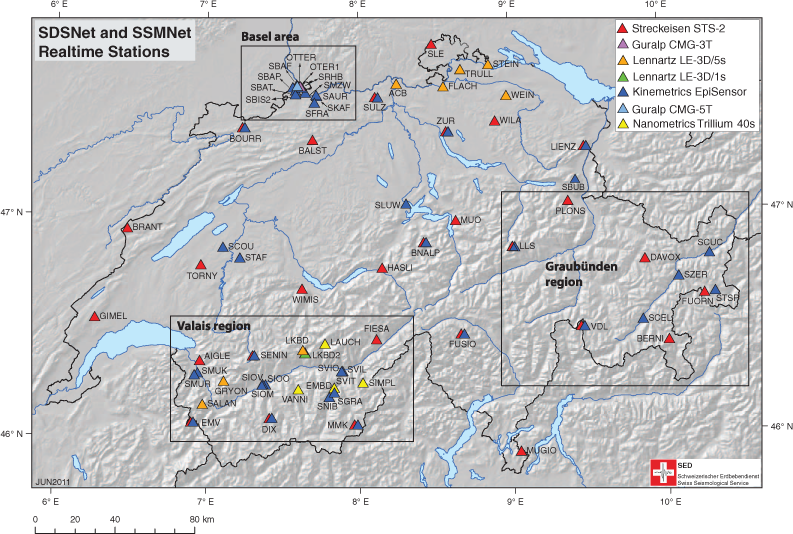
Geographical distribution and sensor type of the Swiss realtime stations of the SSMNet (Swiss Strong-Motion Network) and SDSNet (Swiss Digital Seismic Network). The networks are densified in the regions where the seismic hazard is highest. Twelve sites have co-located strong-motion and broadband sensors, these installations are optimised for broadband seismological observation. In general, the stand-alone strong-motion sites are in urban areas.
Characteristics of the Swiss strong-motion stations used in this study. All dataloggers are Nanometrics.

Co-located broadband and strong-motion sensor; (1) from array measurements; (2) rock site for seismological observations; (3) from MASW investigations.
The strong-motion sensors operated by the SED (see Table 1) are uniformly Kinemetrics EpiSensors (Kinemetrics 2011), with 2 g clip level, 155 dB dynamic range and flat frequency response from 200 Hz (above the Nyquist frequency at the operational sampling rates) to DC. The majority of dataloggers are Nanometrics Taurus (Nanometrics 2011). Data from strong-motion co-located with broadband are sampled at 120 sps, and at 250 sps at the stand-alone strong-motion sites. The high sample rate adopted at stand-alone strong-motion stations was chosen to allow computation of ground motion parameters of engineering interest, such as acceleration response spectral ordinates, at up to 100 Hz (see also Douglas and Boore 2011). Commercial ADSL communication is used for the stand-alone stations. The average data latency across the network is 2 s. The latency is the time taken for the recorded seismic data to be made available to processing machines at the SED, and so includes data packing at source, communications delay, and data unpacking at the SED. The typical Swiss strong-motion housing is a vault (a concrete cylinder with a metallic pot) placed in free-field conditions, as described in Clinton et al. 2011. This housing concept draws from experiences in other broadband and strong-motion communities, including those in Japan (Aoi et al. 2011), the United States (see SCSN 2011), and Italy (Gorini et al. 2010), and was designed to minimize anthropogenic noise sources, including electrical noise.
The ∼120 strong-motion channels acquired continuously in real-time at the SED are processed and archived identically to the broadband and short-period sensors also monitored by the seismic network (Clinton et al. 2011). This allows use of the strong-motion data for routine automatic network operations, manual locations and seamless archival of continuous data and extraction of data into event files. Metadata maintenance, and health monitoring—both of waveform completeness and waveform signal quality—are also kept to the same standards as the rest of the network. This ensures a high-quality in strong-motion network performance, and nearly 100% recovery of event data.
The SCSN (2011) is a cooperative project of Caltech and the U.S. Geological Survey (USGS). All waveform data are recorded at Caltech, processed, archived (1932–present) and distributed to the research and general public by the Southern California Earthquake Data Center (SCEDC). With more than 350 seismic stations in Southern California, SCSN is one of the densest seismic networks in the world. Careful site selection procedures, sub-networking and continuous recording enable SCSN to regularly detect events as small as ML < 0.4. At all broadband sites a strong-motion sensor is co-located. Similar to the Swiss national networks, the majority of sensors deployed in the SCSN are broadband STS-2 sensor, and the EpiSensor strong-motion sensor. The subset of the SCSN used in the present study comprises ∼190 three-component strong-motion stations, typically equipped with EpiSensor and Quanterra dataloggers (typically Q330). No borehole data have been used in this study.
In both networks, the continuous archival of accelerometric waveforms along with the velocity streams means state-of-the-art seismological community data quality processing tools can be applied to the data (as described in the following section), allowing direct analysis, comparison and evaluation of the noise recorded at the strong-motion stations.
Acceleration Data Processing
The continuous strong-motion stations are routinely processed via the health monitoring software tool PQLX (McNamara and Buland 2004; see also McNamara 2011). This software, a standard tool for the broadband community, calculates power spectral densities (PSD) from intervals of continuous data and overall station performance from a given period is illustrated as a probability density function (PDF). The software allows evaluation and temporal tracking of background station noise across the frequency spectrum. The software processes continuous seismic data (typically miniSEED) with associated station metadata (sensor and datalogger response description—typically datalessSEED; IRIS 2011). For time periods on the order of a few hours, restitution of ground motion into acceleration units (ms−2) is performed through full deconvolution of station response. Hence, the PSD computation is performed using a similar algorithm as used to develop the Albuquerque Seismological Laboratory (ASL) new low-noise model (NLNM) and new high-noise model (NHNM) (Peterson 1993, Bendat and Piersol 1971). The PSD estimate is converted into decibels (dB) with respect to acceleration (ms−2)2Hz−1, for direct comparison to the NLNM. Finally, seismic noise PDFs from each of the PSDs are computed over full octave averages taken in 1/8 octave intervals. These PDFs result in a plot of the probability of occurrence of a given power at a particular period with direct comparison to the high- and low-noise reference. Examples of these plots for all Swiss stations can be found at http://www.seismo.ethz.ch/research/groups/alrt/pqlx/index (SED 2011). Other agencies also routinely provide this information (e.g., Orfeus 2011). The software stores the PDFs and PSDs values in a local relational database, and statistics such as minimum, mode, median and maximum for each station component for a given period of time can be extracted for further processing.
For the present study, using the separate PQLX databases maintained at the SED and Caltech, we extracted the PDFs computed for the all strong-motion stations for the duration of their operation. For the Swiss stations, the 5-, 50-, and 95-percentile values of the PSD distribution are presented in Figure 2 and compared with the Peterson (1993) high- and low-noise model. From Figures 1 and 2, it is clear that high frequency noise levels at urban sites only rarely exceed the NHNM of Peterson (1993). Modal PSD values close to the NHNM are typically reached at stations installed in the Basel area (Switzerland's second-largest conurbation with ∼830,000 inhabitants), and are exceeded at one station, SVIL, placed on loose alluvium basin sediments in a small and heavily industrialized town (Visp) in the Canton of Valais (SW Switzerland). The modal PSD values at co-located stations are, as expected, significantly lower (up to two to three orders of magnitude for periods T < 1 s) than those observed at stand-alone strong-motion sites. These co-located installations are indeed optimized for broadband seismological observation, earthquake detection and location, and are thus located at hard-rock sites (with measured VS30 values typically exceeding 1000 ms−1 and reaching ∼3000 ms−1 at LLS), with minimum anthropogenic disturbances. The main aim of co-locating strong-motion instruments with broadband at these sites is to allow recording of peak parameter of ground motions in case of strong shaking, which when in excess of ∼13 mms−1, would saturate (clip) the STS-2 broadband sensor.
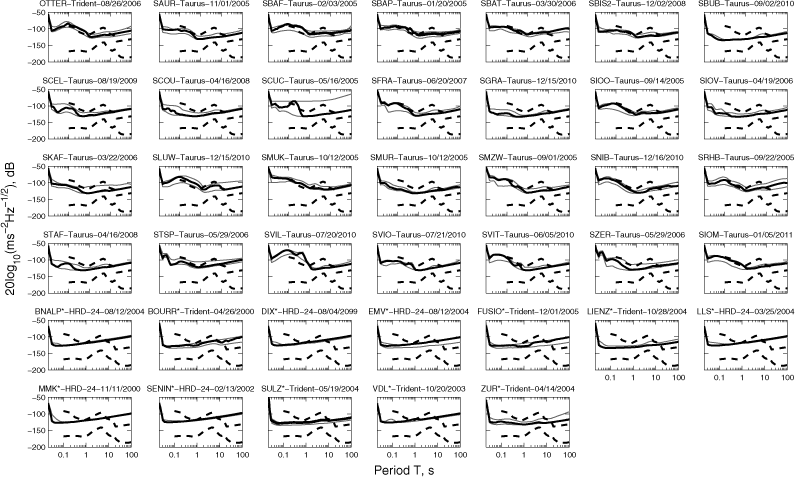
Noise characteristics for Swiss stand-alone and co-located strong-motion stations. For each station, using PQLX statistics, the modal PSD values (thick curves) are represented along with the 5- and the 95-percentile of the PSD distribution (thin gray curves). These station-specific noise characteristics are compared with the NLNM and NHNM of Peterson (1993), shown by thick dashed curves. In the title of each subplot, the station name, datalogger type and starting date of acquisition are also given; all stations are operational today. Consistent with the adopted processing tool, the units of y-axis in each subplot are 20log10(ms−2Hz−1/2), dB. On the x-axis of each subplot the period T (in s) is given. Similar to Table 1, an asterisk attached to the station name means co-located station, indicating high-quality vault located at generally hard sites.
Pseudo Self-Noise Tests for Dataloggers
The individual station noise levels represent the overall noise recorded by the whole system, including not only the site, but also both the accelerometer and the datalogger. In order to better understand and clarify the datalogger contribution to the observed noise levels, we performed terminated noise tests for dataloggers available at our laboratory in Switzerland following the method of Evans et al. (2010) and Ringler and Hutt (2010). We were then able to estimate the self-noise spectra for the dataloggers used at the SED (and also in many other seismic networks worldwide). Terminated noise tests estimate the datalogger self-noise by shortening its input by a resistor that simulates the output of low-impedance sensors such as accelerometers and many modern broadband seismometers. The noise levels computed for a specific acquisition unit can be coupled with the idealized sensor response by converting the datalogger input in Volts to ground motion units (e.g., ms−2) for a given sensor. This of course does not take into account possible noise introduced by a real seismic sensor.
Datalogger self-noise tests were carried out at the SED seismological laboratory of Zürich at Degenried on Nanometrics dataloggers HRD-24, Taurus and Trident and Quanterra dataloggers Q330, Q330HR (Quanterra 2011). All these acquisition units are 24bit dataloggers, except for the 26bit Q330HR (High-Resolution). 24bit systems can typically provide 20log10(223) ∼140 dB dynamic range, while 26bit data acquisition system can deliver over 150 dB dynamic range.
Following Evans et al. (2010) experiments were carried out at 200 sps with duration over several days. Datalogger input were shortened by a 100 Ω resistor to simulate the effect of strong-motion and broadband sensors as operated by SED. Data were processed via PQLX for sake of consistency with the processing adopted for permanent stations (see previous Section). Two dataloggers were tested for each model (with the exception of Q330HR) and the minimum modal PSD value taken as representative of the datalogger performance at a given period T. Since PQLX computes PSD values on restituted ground motion, we state these experiments produce pseudo self-noise levels, because the sensitivity of the (missing) sensor has been taken into consideration in processing the noise waveforms. We simulated the EpiSensor with full-scale range at 2 g, +/−20V differential, sensitivity equal to 1.0197 V/(ms−2), and the STS-2 sensor with bandpass sensitivity equal to 1,500 V/(ms−1).
Results are depicted in Figure 3, along with 5-percentile PSD values as obtained from co-located (green curves) and stand-alone (red curves) Swiss strong-motion stations. The Peterson (1993) high- and low-noise models are also shown in Figure 3 for comparison. The results of the experiments with simulated EpiSensor are in the upper part of Figure 3. The lowest noise levels from the Swiss network are similar to the Taurus datalogger performance over a broad period range, from 50 Hz to 5 s. At longer periods differences are observed in the performance of the two tested Taurus, explaining the discrepancy between the pseudo noise and observed field noise data. The performance of the Trident datalogger appears to be sensitive to the chosen sample rate: in the tests at 200 sps the long period noise is ∼10 dB higher than observed under normal operational conditions at co-located sites, where the sample rate is 120 sps, as seen in the lower bound of the green curves in Figure 3. Further, the unusual long period high noise levels observed at a subset of co-located stations (see Figure 2 also) is due to the use of HRD-24 dataloggers.
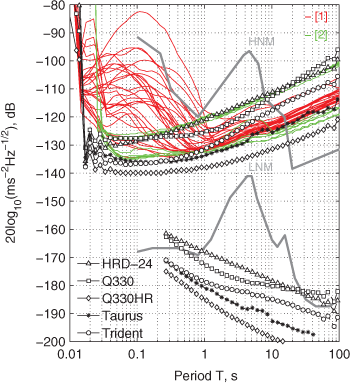
Results of the datalogger self-noise tests carried out at the SED. In the upper portion, the datalogger test results, convolved with the EpiSensor response, are compared with the Peterson (1993) high- (HNM) and low-noise (LNM) model, as well as with data from Swiss stand-alone [1] (typically urban, soft soils) and co-located (typically low noise, hard rock) [2] strong-motion stations. The results of the experiments with simulated STS-2 are located in the lower portion of the picture.
While a systematic comparison of typical data acquisition unit is beyond the scope of the present study, these results show that datalogger performance is the key limiting factor for long-period low noise at seismological vault-quality strong-motion stations. At periods larger than 10 s, substituting a HRD-24 (or equivalent) with a Taurus (or equivalent) datalogger results in at least 10 dB increased resolution.
The results of the experiments with simulated STS-2 are located in the bottom part of Figure 3. Here, the effect of sensor response on the seismographic system (i.e., both sensor and datalogger) performance is clearly illustrated. The same data acquisition units coupled to ideal broadband velocity sensors, produce a system noise performance well below the NLNM for periods T > 1 s. Results from STS-2 coupled with a Q330HR datalogger are consistent with Ringler and Hutt (2010).
Proposed Accelerometric Noise Models
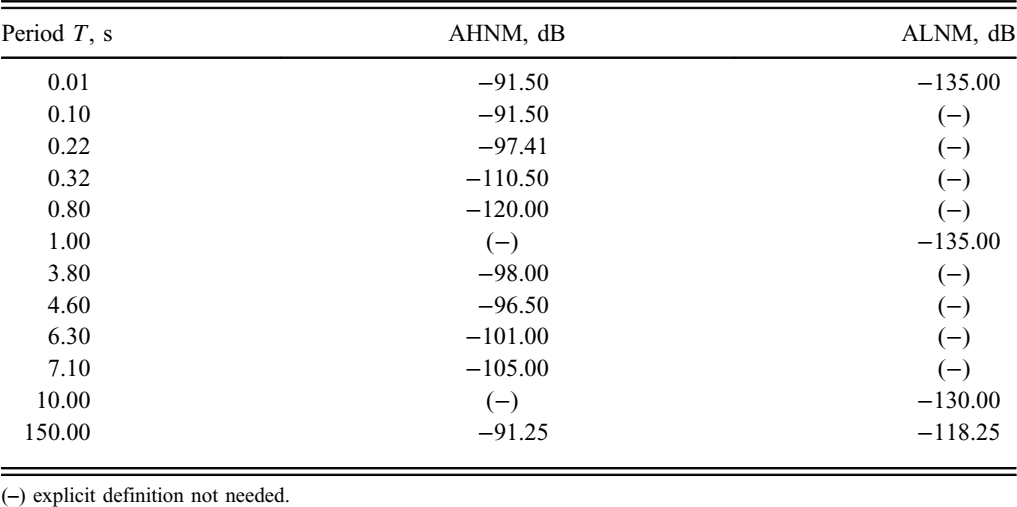
Based on the PSD curves presented in the previous Sections, the proposed accelerometric high- (AHNM) and low- (ALNM) noise models for high-quality accelerometers are presented in Figure 4. The amplitude values of the proposed AHNM and ALNM are listed in Table 2. In Figure 4, the AHNM and ALNM are also compared with Swiss and Southern California 5-percentile PSD obtained through PQLX from continuous acceleration recordings. Since it is not standard practice to couple an EpiSensor with a Q330HR datalogger, we define the ALNM by the minimum measured resolution observed at Swiss and Southern California (SCSN) stations, that is, the lower boundary of 5-percentile PSD amplitudes observed at a large number of hard-rock strong-motion sites. The proposed ALNM is consistent with noise performance of typical high-quality digitizers. If compared with the resolution of the strong-motion equipment presently adopted in Japan by K-Net (2011) and KiK-Net (2011) networks, the proposed ALNM is at least 20 dB below the K-Net02 instrument noise (Aoi et al. 2011) for short periods, T < 10 s.
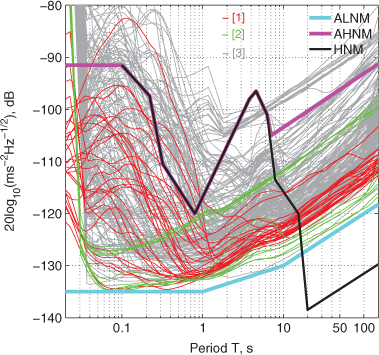
Proposed accelerometric high- (AHNM) and low- (ALNM) noise models for high-quality accelerometers. The models are compared with 5-percentile PSD computed through PQLX for Swiss continuous stand-alone [1] and co-located [2] accelerometric stations, Southern California continuous strong-motion stations [3] and the Peterson (1993) high-noise model (HNM).
Amplitude values of the proposed AHNM and ALNM. Intermediate values can be computed using linear interpolation over logarithmic period axis (see Figure
(-) explicit definition not needed.
The AHNM is dominated by electromagnetic noise for very short periods T < 0.1 s. In this period range, the most important source of noise is the 50 Hz electromechanical vibration associated with strong-motion installations within transformer houses. The proposed AHNM can be conservative in this frequency range since, as recently demonstrated by Cauzzi and Clinton (2011) within the framework of the ongoing upgrade project of Swiss strong-motion network (see also SED 2010), relocating stations ∼12 m away from transform houses is in most cases sufficient to reduce the amplitude of the 50 Hz peak by at least 2 orders of magnitude. At frequencies higher than the microseism peaks (0.05 s–3 s) the AHNM reflects the acceptable site noise in urban/industrialized areas and the contribution to noise amplitude amplification due to site effects. In this period range, the apparent high noise levels at many Southern California stations (gray curves in Figure 4) reflect typical cultural and site noise conditions in the sedimentary Los Angeles basins (∼ 40 stations in the present dataset). At mid-periods the peak microseismal energy that can be expected at strong-motion stations installed near coastlines dominates the AHNM. The Peterson (1993) high-noise model remains appropriate over this broad period range. At long and very long periods (7 s–100 s) the proposed AHNM is constrained by the noise of the sensor/datalogger system for a well-insulated station. The proposed AHNM and ALNM models span 2 orders of magnitude over a broad frequency range.
It is worth noting here that the proposed noise models for typical state-of-the-art accelerometer stations are conceptually different from the Earth's ambient noise models. The Peterson (1993) NLNM does not depend on the measuring instrument, while the proposed ALNM is the result of a particular combination of 140+ dB accelerometric sensors with a given gain and response (e.g., EpiSensor 2 g) with 24bit dataloggers (e.g., Taurus). However, the comparison in Figure 4 with a large set of data with different geographical origin and vault characteristics confirms the validity of the proposed ALNM, further strengthened by the practical observation that the class of sensors and dataloggers used in this study is also widely adopted in many modern strong-motion networks. Note that the lower bound of SCSN PSD curves is characterized by EpiSensors with 2g/4g clip level and the latest generation of Q330-S dataloggers, that is, a digitizer not included in the pseudo noise tests described in the previous Section. The new AHNM is primarily intended as a minimum reference level for high-quality strong-motion installations, which are capable of recording acceleration waveforms over a large magnitude and frequency domain. Achieving this noise level thus justifies the considerable expense of the high-quality equipment.
Discussion and Conclusions
In Figure 5, the proposed acceleration noise models are compared in terms of period and amplitude with average earthquake amplitudes representing events typically of interest to both engineers and seismologists. Following Clinton and Heaton (2002), signals are represented as octave wide bandpassed acceleration, in ms−2. This direct measure of acceleration is chosen rather than the standard power spectral density to allow direct comparison of the proposed noise models with expected ground motion amplitudes from transient earthquake signals, which cannot be uniquely represented by power spectra as the duration must be arbitrarily selected (Aki and Richards 1980, Clinton and Heaton 2002). The EpiSensor 2g clip level and the theoretical resolution (least significant bit) of 12bit, 16bit, 19bit and 24bit instrumentation are also shown in Figure 5 as gray dashed lines (see also Trifunac and Todorovska 2001). Note that instrument limits in Figure 5 are scaled down (typically 50%) to account for the bandpassing of the event data (Clinton and Heaton 2002). Hence, the upper bound of the y-axis in Figure 5 corresponds to a 2 g clip level of the accelerometer. In addition to the near field strong-motion data presented in the original Clinton and Heaton (2002) dataset, we augment the teleseismic dataset by including data recorded in Switzerland at 10,000 and 12,000 km distance during the Chile, 2010, 
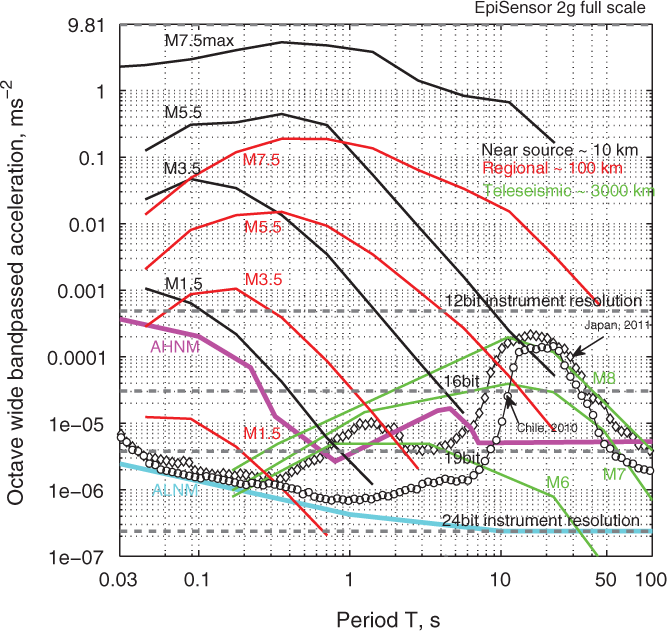
Comparison between the proposed acceleration noise models and earthquake data as processed following Clinton and Heaton (2002). Black curves are computed from local earthquakes with distance ∼10 km. Red curves represent regional events recorded at ∼100 km distance. Green curves are teleseismic events recorded at more than 3,000 km distance. The M7.5max curve in the figure was derived using some of the largest near source data from Chi-Chi (Taiwan) and Kocaeli (Turkey) earthquakes. The black lines with symbols represent the maximum observed PSD amplitudes at Swiss strong- motion station SULZ during the Chile 2010 and Tohoku (Japan) 2011 earthquakes, at about 10,000 km.
When high-quality strong-motion sensors are installed at site of seismological quality, as in many locations in Switzerland, stations are capable of operating near the ALNM at high frequencies. While modern accelerometers can record very small earthquakes (
The comparison of the proposed noise models with earthquake data in Figure 5 contributes to the ongoing discussion within the engineering seismology community assessing optimal correction techniques (including filtering) and usable period ranges for computing ground motion parameters of engineering interest from strong-motion data. Following Boore (2001), Boore (2005a and b) and Boore and Bommer (2005), Paolucci et al. (2007) used a global digital strong-motion accelerometric database (albeit dominated by Japanese data), with magnitude spanning MW 5–7.2 and hypocentral distances R < 150 km, to show that simple removal of a baseline offset computed on pre-event time window of the acceleration trace is often sufficient processing if the aim is to calculate reliable elastic displacement response spectra up to at least 10 s. In other words, when using high-quality strong-motion data, station noise proves to be significant in data only at periods > 10 s. These findings, implemented by Cauzzi and Faccioli (2008) in their development of a global broadband (0–20 s) ground motion prediction equation (GMPE), have been subsequently confirmed in similar studies by Akkar and Boore (2009).
Even though sensor and datalogger noise and vault conditions are not the only contributors to long-period drift in strong-motion waveforms—co-seismic tectonic and local tilting (Clinton 2004, Grazier 2010) are also important—the newly developed noise models provide a reliable reference framework for waveform selection for modern accelerometric data for earthquake engineering and engineering seismology.
At the SED, the introduction of continuous monitoring and the automated quality processing via PQLX (McNamara et al. 2009) led to significant improvements in the quality of data collected. As an example, improved insulation of the sensor provides dramatic improvements in the long period performance of the sensors, an improvement that was subsequently applied to all stations. In terms of high frequency performance, some sensors were found to record significant high frequency noise from electrical sources that prompted station relocation. The good performance of the Swiss stations is a direct consequence of the migration to constant observation and easy comparison of the quality of each site.
A remarkable example of the performance of a strong-motion station is presented in Figure 6, which shows waveforms from the Tohoku, Japan,
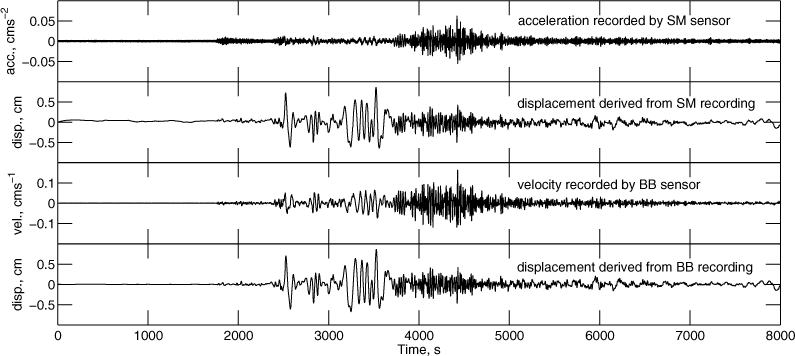
Acceleration, velocity and 120 s high-pass filtered displacement waveforms from the Tohoku (Japan) 2011
For network operators installing new strong-motion stations, the proposed noise models can serve as useful guidelines, though the noise at a site is often only one of many important considerations. At the SED, these preliminary models now provide the acceptable limits for candidate sites within the strong-motion network modernisation project (Clinton et al. 2011). Nevertheless, as the key goal of the network upgrade and densification is to improve the understanding of the seismic risk in Switzerland, certain urban towns must be instrumented (e.g., Visp) which are located at sites with basin amplifications so large that any station in the vicinity will have noise above the AHNM, and we are forced to accept that at some sites the AHNM will be exceeded at some frequencies.
These noise models, in particular the ALNM, are functions of the sensor/datalogger and vault system. We have shown that for the currently proposed ALNM model based on the Swiss and Southern California dataset, the datalogger performance is the limiting factor in determining the achievable noise floor. It is important to note that in future, as we migrate to in some cases better and possibly different instrumentation (for example datalogger with higher dynamic range or strong-motion sensors recording velocity rather than acceleration), the ALNM would need to be revised. We note that some new strong motion networks prioritize station density over sensor quality, often resulting in deployment of cheaper instrumentation (typically MEMS-based) with reduced frequency and dynamic range operating in a triggered mode. In these networks, station quality tends to be a minor consideration and the AHNM is not expected to be reached.
Footnotes
Acknowledgements
This work has been partially developed within the framework of the project of renewal and modernization of the Swiss Strong-Motion Network (SSMNet 2011), approved by the Swiss Federal Council in February 2009, monitored and supervised by a steering committee headed by the Swiss Federal Office for the Environment (FOEN). The installation of a subset of Swiss strong-motion stations used in this study was funded by the COGEAR project (CCES 2011). We thank Egill Hauksson and Rae Yip (Caltech) for providing PQLX statistics for SCSN (Southern California Seismic Network). The Electronics Laboratory at the SED provided valuable technical support, both by achieving the high-quality network data for Switzerland, and in performing the datalogger tests described in the paper. The Engineering Seismology group at the SED maintains the site characterization database, which is the source of the geophysical station information. We thank Sabine Wöhlbier for providing the Seismic Network maps. Marco Olivieri contributed with many helpful discussions. Joe Steim also provided valuable insight. We would like to thank John Douglas, Marco Massa and an anonymous reviewer for critically revising the manuscript and providing constructive comments and suggestions.