






Abstract
This paper investigates the effect of earthquake ground motion duration on the design and collapse risk of reinforced concrete shear wall buildings from 6 to 30 stories. Both design and collapse levels of shaking were considered through nonlinear incremental dynamic analysis. At the design level of shaking, it was found that (1) maximum interstory drifts were increased as ground motion duration increased (from <20 s to 35–150 s of strong shaking), though not enough to flag the designs as unacceptable; (2) story forces and moments were not significantly affected; and (3) energy demands were greatly increased by motion duration. When the records were scaled until collapse level, it was found that (1) the median collapse scaling level was greatly impacted by duration, and the median collapse shaking level was almost 20% higher on average when considering shorter records; and (2) long duration records produced both larger probabilities of collapse at the design shaking level and lower collapse margin ratios compared with spectrally equivalent short duration records.
Introduction
Many major population centers, such as Vancouver, British Columbia, Seattle, Washington, and Portland, Oregon, are located in the Pacific Northwest of North America, which is a region susceptible to megathrust earthquakes from the rupture of the Cascadia Subduction Zone. Such earthquakes have occurred in the past and are capable of reaching a moment magnitude (Mw) of 9.0 or higher (Goldfinger et al. 2012). Recent earthquakes located in similar subduction zones, such as Tohoku, Japan (Mw 9.1, 2011), El Maule, Chile (Mw 8.8, 2010), and Sumatra, Indonesia (Mw 9.1, 2004), have produced very strong levels of shaking as well as records with very long durations. Because of this, the effect of ground motion duration on structural damage has become an important consideration for regions such as the Pacific Northwest. The standards used for structural design in this area currently do not explicitly account for ground motion duration; however, they attempt to do so by requiring the selection of ground motions with geophysical parameters (e.g., magnitude and distance) similar to those anticipated, from probabilistic seismic hazard analysis (PSHA), at the building site when performing time history analysis [National Research Council of Canada (NRCC) 2015, American Society of Civil Engineers (ASCE) 2016, Pacific Earthquake Engineering Research Center (PEER) 2017]. Because traditional PSHA does not consider duration, the duration of the selected motions is still somewhat arbitrary.
A comprehensive state-of-knowledge review on the effect of ground motion duration on structural damage was compiled by Hancock and Bommer (2006). In this review, it was noted that most experimental tests showed a high correlation between the number of loading cycles and specimen damage (e.g., Calado et al. 2002, Dutta and Mander 2001, Manfredi and Pecce 1997). In studies that rely on numerical methods, the conclusions were less clear. Most studies using cumulative damage measures found a correlation between ground motion duration and structural damage (e.g., Tang and Yao 1972, Stephens and Yao 1987, Chai 2005); however, studies that used extreme responses (such as maximum interstory drift or displacement) generally did not find strong correlations between duration and damage (e.g., Rahnama and Manuel 1996, Iervolino et al. 2006, Cosenza et al. 2004). These results may be due to limitations in the numerical models used, which did not always properly account for cyclic strength and stiffness degradation.
Recently, several studies done in the OpenSees framework (McKenna et al. 2000) using models with strength and stiffness degrading plastic hinges, along with “leaning” P-delta columns, have indicated that ground motion duration has a high importance when predicting structural collapse or damage. Two of these studies considered concrete moment frames (Chandramohan et al. 2016a, Raghunandan and Liel 2013), while another used steel moment frames modeled with degrading plastic hinges (Chandramohan et al. 2016b). In the study done by Chandramohan et al. (2016b), spectrally equivalent long and short duration record pairs were considered to isolate the effect of duration from spectral shape. The results of these recent studies indicate that ground motion duration does have a large impact on structural collapse and damage; however, these studies have focused on moment-resisting frames, and the results have not been generalized for other structural systems.
In this paper, the effect of ground motion duration on concrete shear wall buildings is investigated. Five archetype-coupled concrete shear wall buildings from 6 to 30 stories are considered. Cyclic and in-cycle degradation is accounted for in the coupling beam models as well as the material models used in fiber sections of the shear walls. Two suites of spectrally equivalent records are run at various levels of shaking, from the code design level all the way to collapse level. The code-level motions are ran to see if ground motion duration can impact the typical code design of this type of building, while collapse-level motions are ran to determine if the collapse risk of the structure is influenced by ground motion duration.
Archetype Buildings
The archetype buildings considered in this study are reinforced concrete shear wall buildings that are typical of residential buildings constructed in Vancouver, BC, Canada (a large city with a dense urban population in close proximity to the Cascadia Subduction Zone). Buildings with 6, 12, 18, 24, and 30 stories are considered. The lateral load–resisting system of the buildings includes three interior reinforced concrete shear walls, which comprise the elevator and stair core of the buildings. The gravity-resisting system of the buildings includes circular perimeter and interior columns and 8-in. slabs at each story. The floor layout of the buildings is illustrated in Figure 1. The floor area is about 5,200 sq. ft. per story, and the weight was calculated as 0.21 kips/sq. ft. (approximately 10 kN/m2). The archetype building layouts were based on designs by a report prepared by Green and Karsh (2012).

Archetype buildings floor plan.
Three sets of core walls were designed: one for buildings up to 12 stories, another for buildings up to 20 stories, and a final design for buildings up to 30 stories. Reinforcement in the shear walls for buildings up to 30 stories is illustrated in Figure 2. The walls are connected by 2-ft. deep header beams (Figure 3), which are reinforced by transverse 15M stirrups spaced at 4 in.
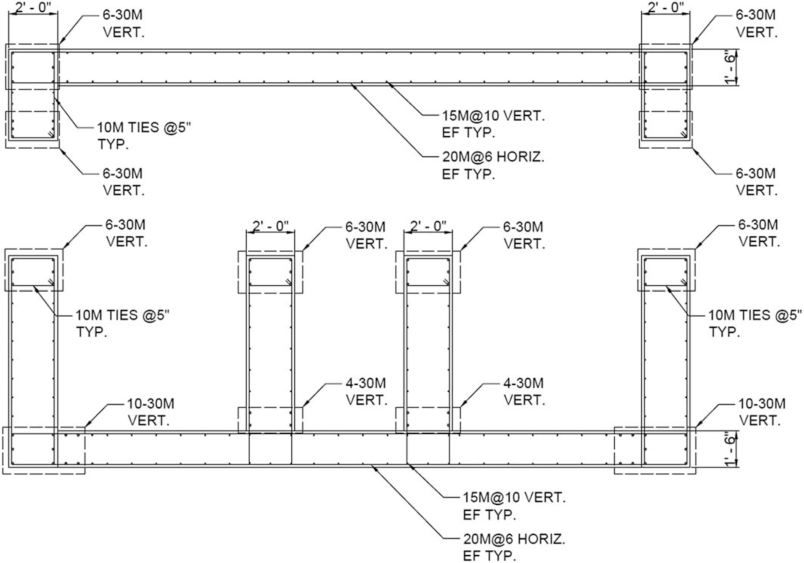
Reinforcement details of shear walls for buildings up to 30 stories.
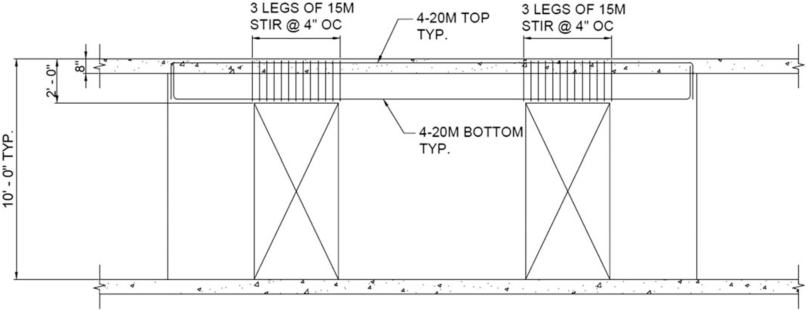
Elevation view of slabs and header beams.
The buildings were designed using the Equivalent Lateral Force Procedure (ELFP) for a base shear calculated in accordance with the 2010 National Building Code of Canada (NBCC; NRCC 2010) for Vancouver, BC, based on conventionally constructed coupled walls. The seismic force reduction factor (RdRo) of this system is 1.95. Only the softer East-West direction (Figure 1) was considered for analysis. Conventionally constructed walls include headers with conventional stirrups instead of cross-tied steel cage reinforcement. Although this type of header is less ductile, test results show that they are more susceptible to damage because of cyclic degradation than more ductile headers (Galano and Vignoli 2000), which is why they were chosen for this study.
Numerical Models
The OpenSees framework (McKenna et al. 2000) was used to develop a numerical model for each archetype building. The interior shear walls were modeled using fiber elements with a displacement-based formulation. Elastic shear deformations were captured by including a linear shear hinge at the midpoint of the walls at each story. The shear hinges were modeled with stiffness equal to the cracked shear area multiplied by the shear modulus and divided by the story height. To account for the loss of area because of cracking, the gross area was multiplied by 0.1 based on the recommendations by Pugh (2012).
The header beams were modeled using elastic beam elements with nonlinear shear hinges. The elastic beam elements were modeled considering a cracked section modulus (Icracked = 0.35Igross) to account for bending deformations. Between the header beam elements and wall elements, rigid beam elements were modeled to account for the physical width of the walls. A shear hinge was modeled at the midpoint of each header beam to account for the shear yielding and nonlinearity in the elements.
The header beams are 20 in. wide by 24 in. deep with 15M stirrups spaced at 4 in., as shown in Figure 3. The nonlinear shear hinge properties were calibrated to a reverse-cyclic test on a similar beam performed by Galano and Vignoli (2000). The Pinching4 material model (Lowes et al. 2004) was employed to capture pinching, in-cycle degradation, and cyclic stiffness and strength degradation in the nonlinear shear hinges. A comparison of the test results to the nonlinear shear material is presented in Figure 4, including the monotonic backbone curve assumed.

Nonlinear shear hinge model for header beams.
Concrete was modeled with a linear tension softening concrete material model (Concrete02; Yassin 1994), which includes unloading stiffness degradation. Confinement was accounted for by using the Mander et al. (1998) relationship. This concrete model is able to capture degradation through both crushing and spalling. Reinforcing steel was modeled using the ReinforcingSteel material model, which accounts for cyclic fatigue in the steel bars according to Brown and Kunnath (2000). Buckling and fracture of the reinforcement was captured through the OpenSees MinMax material. This material returns zero strength and stiffness once a predetermined strain (i.e., the fracture strain of steel) is surpassed. To account for buckling, the negative limit of the MinMax material was set to the concrete crushing strain, assuming steel buckling would occur immediately after the surrounding concrete crushes. Bar slip, which could be another source of degradation, was not modeled.
The weight based on the tributary area of the core walls was applied directly on the wall elements. The gravity system was not explicitly modeled; however, to account for the second order effects of the weight carried by the gravity system, a leaning (or P-delta) column was included in the model. The weight of the structure not applied directly on the shear walls was applied on the leaning column, which was pinned at the base and constrained to the walls at each story level. Rigid diaphragm constraints were applied at each level. An illustration of the OpenSees model is presented in Figure 5.

Illustration of a typical story of the OpenSees numerical models.
Damping was applied as 2.5% Rayleigh damping in the first and third modes. The first three periods of the models are summarized in Table 1.
Periods of the archetype building numerical models
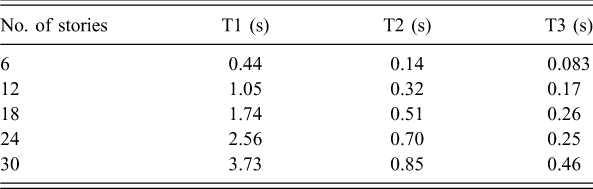
Ground Motion Suites
Two suites of 30 ground motion records were selected to investigate the effect of ground motion duration on the archetype building models. The records were downloaded from the PEER NGA-West2 (2014), The Consortium of Organizations for Strong-Motion Observation Systems (COSMOS) Strong-Motion Virtual Data Center (2008), and the K-Net (Kinoshita 1998) databases. The NGA-West2 database was used to select shallow crustal events; the COSMOS and K-Net databases were used to download subduction interface events from worldwide and Japanese events, respectively. Unprocessed records from the COSMOS and K-Net databases were baseline corrected and filtered with a fourth-order Butterworth bandpass filter from 0.1 to 25 Hz.
The first suite of motions contained long duration records, while the second comprised spectrally equivalent short duration records. The 5% to 95% significant duration (D5–95) was adopted to quantify record duration. D5–95 refers to the time between the accumulations of 5% and 95% of the total energy of the record, in which the Arias intensity is used to quantify record energy. Arias intensity (Ia) is calculated using the acceleration of the record (a(t)) squared, as presented in Equation 1:


Illustration of significant duration (D5–95) for the 2011 Tohoku, Japan, TKY024 NS station recording (D5–95 = 108.7 s).
First, 30 long duration records (D5–95 > 35 s) were selected and linearly scaled to the Vancouver 2% in 50-year spectrum. The Kempton and Stewart (2006) and Bommer et al. (2009) ground motion prediction equations (GMPEs) predict 5% to 95% significant durations of ∼100 and ∼20 s, respectively, for a magnitude 9.0 earthquake in Vancouver (distance of ∼135 km on 760 m/s soil). This magnitude and distance were the mean results from a PSHA of subduction sources affecting Vancouver, BC. Although these GMPEs are only valid to magnitudes of 7.5 and 8, respectively, there are currently no GMPEs proposed for larger magnitude earthquakes. The 20 s lower bound from Bommer et al. (2009) was considered quite low and too close to the short duration limit, so adding one standard deviation to the median prediction gave the lower bound limit of 35 s for long duration records.
Most of the events are from large magnitude subduction interface and crustal events. For this study, spectral shape and significant duration were the most important aspects of the records; thus no selection constraints, other than limiting initial scale factors to the design spectrum to 4.0, were employed to maximize the number of records available. This limit was applied to both record suites. The long duration events and records selected are summarized in Table 2. Although all the records were considered to have a long duration, they came from both crustal and subduction interface events. The results of this study may differ if only subduction events were chosen.
Long duration suite summary
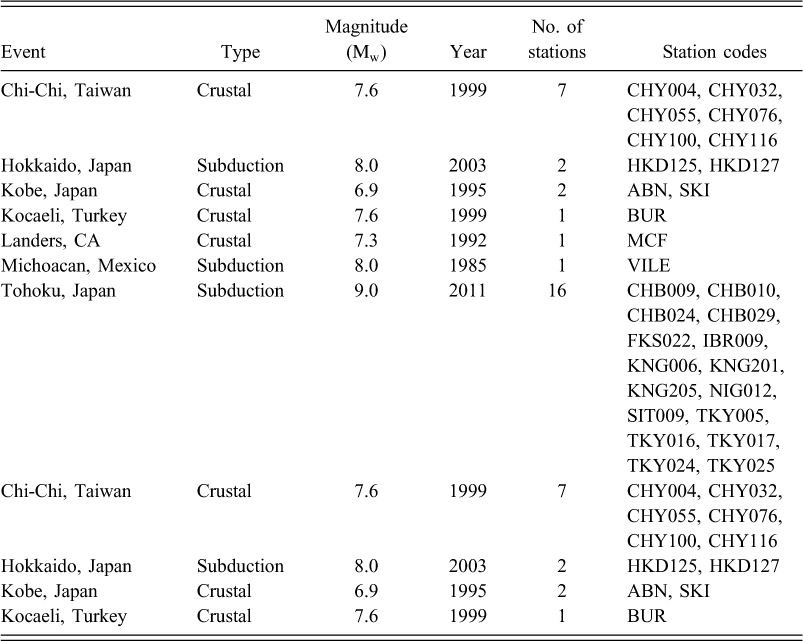
The methodology employed in the Chandramohan (2016b) study was then used to select spectrally equivalent short duration motions. This methodology removes the influence of spectral shape so that the effect of duration can more easily be isolated. Accordingly, a short duration (D5–95 < 20 s) record was selected to best match the spectrum of each of the 30 long duration records. The best match was obtained by minimizing the mean squared error (MSE) between the spectra of the two records. The short duration upper limit of 20 s was the average of the Kempton and Stewart (2006) and Bommer et al. (2009) GMPEs for a magnitude 7.2 earthquake at a distance of 20 km. This magnitude and distance were the mean results from a PSHA of shallow crustal sources effecting Vancouver, BC.
Figure 7 illustrates an example of a long record and spectrally equivalent short duration record. Scaling factors and MSE were computed between 0.07 and 5.6 s, which is equal to 0.15 times the 6-story model's period to 1.5 times the 30-story model's period. Table 3 summarizes the selected short duration events and records. The short duration records were obtained exclusively from worldwide shallow crustal events.

Example of spectrally equivalent records: (a) 5% damped response spectra and (b) acceleration time histories.
Short duration suite summary
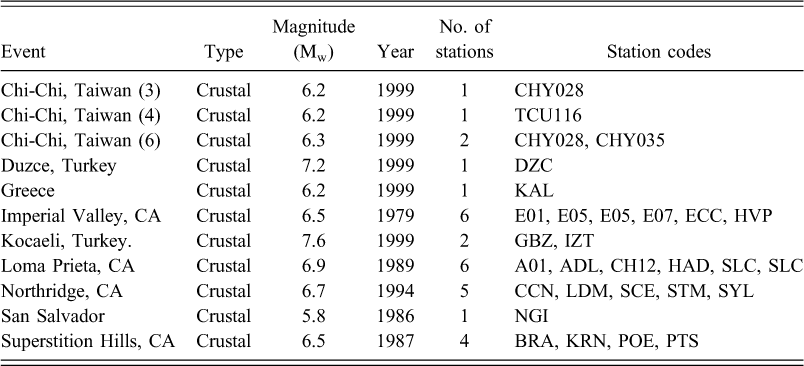
Figure 8 presents the spectra of the two suites compared with the Vancouver 2015 design spectrum. Figure 9 compares the significant duration of the two suites. The short duration suite comprised records with a 5% to 95% significant durations of 5 to 15 s with a mean of 11 s. The long duration suite had a range of 40 to 150 s and a mean of 80 s.

Spectra of (a) the long duration suite and (b) the short duration suite compared with the Vancouver 2% in 50 year design spectrum.

Long and short duration suites significant duration (D5–95) comparison.
Code-Level Analysis Results
The NBCC specifies a ground motion shaking level with a 2% in 50 year probability of exceedance for code-level design and analysis of Canadian buildings. The “Risk-Targeted” Maximum Considered Earthquake (MCEr), which ranges from 0.85 to 1.15 of the 2% in 50 year shaking level for the majority of the continental United States (Luco 2011), is used for the performance-based design of tall buildings in Los Angeles, CA [Los Angeles Tall Building Structural Design Council (LATBSDC) 2017], and elsewhere in the United States (PEER 2017).
Accordingly, the two suites of ground motions were first scaled to the Vancouver NBCC 2015 (NRCC 2015) design spectrum (Figure 8) and used to analyze the models using nonlinear time history analysis. The resulting maximum interstory drifts, story shear forces, and overturning moments for the 30-story model are shown in Figures 10, 11a, and 11b, respectively.

Interstory drift results for the 30-story model at the code shaking level for (a) the long duration suite and (b) the short duration suite.

(a) Story shear force and (b) story overturning moment results for the 30-story model at the code shaking level for the long and short duration suites.
The NBCC uses interstory drifts as a surrogate for structural damage and limits regular buildings to a mean maximum interstory drift of 2.5% of the story height when using a suite of records to conduct time history analysis. For the collapse prevention evaluation used in performance-based design, mean and maximum interstory drifts are limited to 3.0% and 4.5%, respectively (LATBSDC 2017). As seen in Figure 10, neither suite surpasses these limits.
The shear force and overturning moment demands for these two suites of ground motions are similar, as these are governed by the strengths of the walls; however, the drift demands from the long duration suite are slightly higher than the equivalent short duration records. This is because the overall damage (interstory drift levels) is quite low at this level of shaking (maximum interstory drift of ∼1% for the two suites). At these lower levels of damage, the amount of degradation in the walls and header beams is low, which will largely nullify the effect of the ground motion duration.
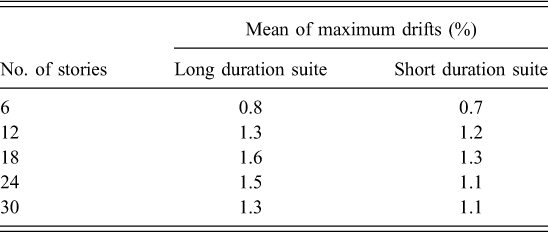
Additionally, the mean of the maximum interstory drift observed in each of the other models is summarized in Table 4. The results are very similar for the two shortest models (6 and 12 stories); however, they do differ slightly for the three taller models (18, 24, and 30 stories). This may be due to larger displacements in the taller models, which stimulate more damage and degradation.
Mean of maximum interstory drifts summary for all archetype models at the 2% in 50 year shaking level
The energy demands of the 30-story structure were also computed during the time history analysis by considering the energy dissipated through both yielding of the walls and header beams. The force-displacement response of the header beams and moment-rotation results of the wall elements were recorded throughout the analyses. The areas under these curves were used to compute energy. Figure 12 compares the energy response calculated in the structure at this level of shaking for the two motion suites. Despite producing comparable peak displacement and force results, the long duration suite has much higher energy demands because of the large number of cycles that the longer motions subject the structure to. This may lead to more structural and nonstructural damage in the building (Bertero et al. 1978).

Energy demand statistics for the 30-story model at the code shaking level.
Collapse-Level Analysis
Next, in order to determine if long duration ground motions increase the collapse risk of reinforced concrete shear wall structures at higher shaking levels, the two suites of ground motions were incrementally scaled up until collapse was reached. Collapse is defined in this study as excessive interstory drifts (>5%). This drift limit was chosen because the gravity system, which was not explicitly modeled but idealized as a single leaning column, is not expected perform past 5% drift. This is also slightly over the allowable maximum drift limit from LATBSDC of 4.5% (LATBSDC 2017) and past the point at which the incremental dynamic analysis (IDA) curves became flat. Other forms of nonsimulated collapse, including shear demands in the walls, were checked but did not govern. As described by Chandramohan (2016), using nonconvergence as a failure criterion will tend to bias the results toward the short duration motions, as the longer motions will have a larger chance of terminating because of nonconvergence. Accordingly, if either of the records in a pair initiated failure because of nonconvergence, the cumulative distribution function (CDF) was modified as follows. First, the median collapse scaling level was computed without considering any nonconverged records. Then, if the record was below this median collapse scaling level when nonconvergence occurred, it was completely removed, as there is no way to know if that record could have gone on to increase the median level. If convergence failure occurred at a level above the median collapse scaling level, it was used to recompute the median collapse scaling level once all nonconverged records were accounted for. As it cannot be known how much further the nonconverged records could have been scaled, they were not used to compute the standard deviation of the function.
Figure 13a presents the empirical and lognormal fragility curves derived for the six-story building model for the two ground motion suites. In this figure, the 100% scaling level refers to the 2% in 50 year shaking level (the code design level according to the NBCC). Note that the 2% in 50 year shaking level is computed with contributions from both crustal and sub-duction ground motions. The same reference level was considered for both suites (as opposed to using a 2% in 50 year shaking level computed for each individual source) because the object of this study was to compare the effect of short and long duration motions, not crustal versus subduction ground motions.

CDF results for the long and short duration suites for the six-story model including (a) RTR variability only and (b) total variability.
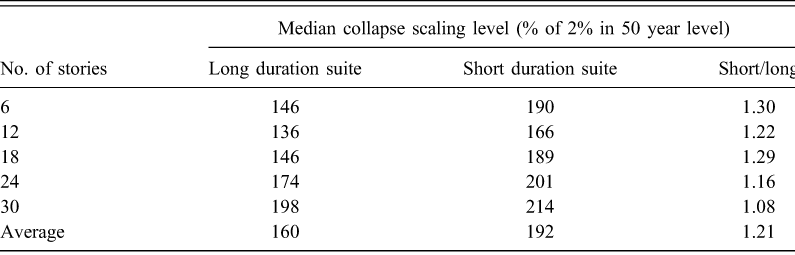
For the six-story model, the median collapse levels for the long and short suites are 146% and 190% of the design scaling level, respectively. The median collapse scaling levels for the other archetype models are summarized in Table 5. The short duration suite consistently requires scaling levels ∼20% to 30% higher than those required for the long duration suite to induce collapse. The minimum required increase in collapse scaling level is 8% for the 30-story model, while the maximum is 30% for the 6-story model. This makes sense considering the 6-story model has a much lower period compared with the 30-story model, meaning it will undergo more cycles during the motions and will accumulate more inelastic damage, increasing the difference between the two record suites.
Mean collapse scaling level for all archetype models
The CDFs in Figure 13a only show record-to-record (RTR) variability, which arises from disparities between the ground motion records selected. According to FEMA P695 (FEMA 2009), there are other sources of uncertainty that should be accounted for when assessing the safety of building types, including design requirement, test data, and modeling related uncertainties. Because the design, testing, and modeling of reinforced concrete shear walls is well established, it was assumed that each of these uncertainties was very low (the lowest beta values recommended by FEMA P695 of 0.1 were selected for each.) In Figure 13b, the CDFs for the 6-story model were recalculated considering the contributions of these sources of uncertainty along with the RTR variability (denoted “total variability”). In Figure 13b, the area below a 10% probability of collapse is highlighted to emphasize that the probability of collapse at the 2% in 50 year shaking level must be less than 10% according to FEMA P695. Figure 14 presents the CDFs for the other four model heights derived considering both RTR variability and total variability.

CDF results, including total variability, for the long and short duration suites for (a) the 12-story model, (b) the 18-story model, (c) the 24-story model, and (d) the 30-story model.
The two major requirements for safe design according to FEMA P695 are: (1) a low probability of collapse (P[Collapse]) for 2% in 50 year level ground motions (2% probability of exceedance in 50 years); and (2) an acceptable margin of safety against collapse. In order to satisfy the first requirement, there are two basic collapse prevention objectives at the 2% in 50 year shaking level: probability of collapse less than 10% across the group of archetype models and probability of collapse less than 20% for each individual model. In order to ensure a sufficient margin of safety against collapse, FEMA P695 uses the collapse margin ratio (CMR), which is the ratio between the median collapse shaking level and the 2% in 50 year shaking level, of each archetype. Both the average CMR of the group and each individual CMR must exceed a minimum acceptable value as proposed in FEMA P695, depending on the total system collapse uncertainty (CMR10% for the group and CMR20% for each individual model). Table 6 summarizes both the collapse probabilities at the 2% in 50 year shaking level and CMRs, along with the FEMA P695 acceptable CMRs (in parentheses), of each model. Note that this study does not attempt to strictly follow the FEMA P695 methodology to assess the safety of reinforced concrete shear wall buildings. These FEMA P695 metrics have simply been adopted as convenient means to compare the relative safety of the structures computed when subjected to the two suites of motions.
Collapse probability at the 2% in 50 year shaking level and CMRs for all archetype models
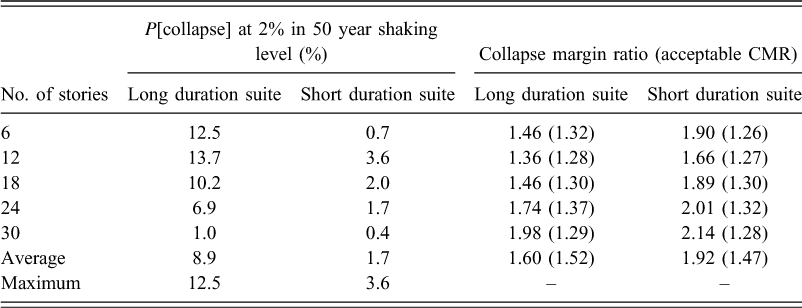
According to these objectives, if this building type were being assessed using either record suite, it would pass both requirements. However, the long duration suite was much closer to the limit for all criteria; the 8.9% average probability of collapse at the 2% in 50 year shaking level is very close to the 10% limit, and the average CMR of 1.6 was only just above the limit of 1.52.
These results show that ground motion duration can significantly affect the collapse risk and margin of safety (quantified by the CMR) of this type of reinforced concrete structure. The long duration suite caused both an increase in the probability of collapse at the 2% in 50 year shaking level and a decreased CMR across the entire suite of archetype models.
Because the spectral shapes of the anticipated motions were not accounted for, only the relative safety between the system subjected to short and long motion suites can be commented on. The absolute safety of the system should not be implied from these results.
Implication of Results for U.S. Practice
Following FEMA P695, reduction (R) factors should be calibrated so that building systems have a 10% or less probability at the 2% in 50 year shaking level and a sufficient CMR. From the results presented in the previous section, it can be seen that long duration ground motions can lower the median collapse scaling level, which both lowers the CMR and increases the probability of collapse at the 2% in 50 year shaking level. This is illustrated for two theoretical CDFs in Figure 15: one short duration CDF and one long duration CDF. In Figure 15, the R factor of the hypothetical building system is calibrated so that a typical short duration ground motion suite produces a certain mean and standard deviation to achieve a 10% probability of collapse at the 2% in 50 year shaking level. Then it is assumed, from the results of the previous section, that an equivalent long duration suite would produce a median collapse scaling level of ∼1/1.2 (the average from Table 5) of that from the short duration suite. It can then be seen that the long duration CDF has a much lower CMR and a probability of collapse much greater than 10% at the 2% in 50 year shaking level, suggesting that this design is unacceptable according to FEMA P695.

Theoretical CDFs derived using short and long duration ground motion suites.
In Canada, new buildings are designed for 2% in 50 year probability of exceedance shaking levels, which gives them a very low probability of collapse when checked at a this shaking level and large CMRs. This was the case for reinforced concrete shear wall buildings when subjected to both long and short duration ground motion suites. This is in contrast to ASCE/SEI 7 (ASCE 2016), which specifies using a lateral static force equal to 2/3 of the MCEr level when using an ELFP for design. A building designed following ASCE 7 could pass FEMA P695 safety criteria when considering a suite of short duration motions (theoretical short duration curve in Figure 15), but it could have an unacceptably large probability of collapse at the 2% in 50 year shaking level and/or a very low CMR when subjected to long duration ground motions (theoretical long duration curve in Figure 15). This means that when developing R factors for building systems, it will be necessary to include ground motion duration if the factors are intended to be used to design structures in tectonic regimes capable of producing long duration ground motions.
Conclusions
In this study, a suite of reinforced concrete shear wall buildings was analyzed using two sets of records: a long duration suite and a spectrally equivalent short duration suite. At a code level of shaking (2% in 50 year probability of exceedance), little damage was expected (as indicated by low interstory drift ratios). Even at this shaking level, the longer motions tended to impose greater interstory drift demands (approximately 20% greater on average) and produced much larger total energy demands. However, both suites met the collapse prevention criteria required by the NBCC and other performance-based design standards (LATBSDC 2017, PEER 2017). Story forces and overturning moments, which are governed by wall strength, were not noticeably affected.
When the ground motion records were incrementally scaled to very high levels of shaking using IDA, the median collapse scaling level of the models was significantly affected by ground motion duration. The short duration suite, on average, required scaling factors 20% greater than the long duration suite in order to induce structural collapse (as indicated by large drift values). This implies that ground motion duration may not be an important consideration at levels of shaking in which little damage is expected (such as the design level); however, when considering larger levels of shaking, in which large levels of damage are expected (e.g., to determine the safety of structures), then duration becomes an essential parameter of the input motions. The observation that ground motion duration can significantly affect the median collapse scaling level of structures is in line with the conclusions of other recent studies conducted using moment-resisting frames (e.g., Chandramohan et al. 2016a, Chandramohan et al. 2016b, Raghunandan and Liel 2013).
It was also noted that when considering FEMA P695 collapse prevention performance objectives, the selection of records could have a significant impact on the determined safety of a system. Based on the results presented in this paper, the selection of longer duration motions could significantly increase the probability of collapse at the 2% in 50 year shaking level and could decrease the CMR. This indicates that structures designed to national building standards (i.e., using seismic force modification factors from national building codes) might be safe in some regions but could be unsafe (have an unacceptably high probability of collapse at MCEr demands) in regions where long duration subduction interface events are possible. This highlights the importance of selecting records with a duration representative of the shaking duration expected at the site when assessing the safety of new or existing structural systems.
The results presented in this study were for conventionally constructed reinforced concrete coupled shear wall buildings. The header beams modeled for this system show a significant amount of cyclic strength and stiffness degradation (Figure 4; Galano and Vignoli 2000). This cyclic degradation led to significant amounts of strength and stiffness loss in the systems when they experienced large amounts of deformation cycles during the long duration ground motions. However, such large difference in demands because of the two suites of records may not be as severe in other building systems with more ductile detailing requirements. For example, ductile header beams reinforced with cross-tied steel cages may exhibit less cyclic degradation (Naish et al. 2013) and may be less susceptible to longer duration ground motions. Thus further studies would be required to quantify the safety of such systems under different potential ground motion time history records.
Footnotes
Acknowledgements
The study in this paper is part of the PhD dissertation of the first author, which was funded by the Natural Sciences and Engineering Research Council of Canada (NSERC). The authors would like to thank Mahdi Taiebat from the University of British Columbia for supplying the computational resources required to conduct this work.