
Abstract
Tsunami alerts following severe earthquakes usually affect large geographical regions and require people to evacuate to higher safety zones. However, evacuation routes may be hindered by building debris and vehicles, thus leading to longer evacuation times and an increased risk of loss of life. Herein, we apply an agent-based model to study the evacuation situation of the coastal city of Iquique, north Chile, where most of the population is exposed to inundation from an incoming tsunami. The study evaluates different earthquake scenarios characterized by different ground motion intensities in terms of the evacuation process within a predefined inundation zone. Evacuating agents consider the microscale interactions with cars and other people using a collision avoidance algorithm. Results for the no ground shaking scenario are compared for validation with those of a real evacuation drill done in 2013 for the entire city. Finally, a parametric analysis is performed with ten different levels of ground motion intensity, showing that evacuation times for 95% of the population increase in 2.5 min on average when considering the effect of building debris.
Introduction
Communities throughout the world that are exposed to tsunamis require a rapid evacuation from inundation zones to minimize deaths. It is well known that good planning and rehearsal of evacuation procedures is critical in reducing evacuation times and casualties (Eisenman et al. 2007, Yuan and Han 2009, Shuto 2015). Naturally, planning must take into account the timescales of the evacuations, which depend on the type of hazard; for instance, arrival times for tsunami waves range from a few minutes to hours.
Several previous studies have focused on modeling tsunami evacuations using numerical approaches (e.g., Lämmel et al. 2010, Anh et al. 2012, Forcael et al. 2014, Wang et al. 2016). One way of classifying these models is by their geometric scale. Macroscopic scale models characterize the city as a network, i.e., a collection of evacuation routes with nodes and arcs with a flow capacity, without simulating individual agents. One of the most used macroscopic methods is least-cost-distance modeling, which calculates the shortest path by using a grid in which each cell represents the effect that different factors impose on movement (e.g., slope and land cover; Adriaensen et al. 2003). For example, Schmidtlein and Wood (2015) use a Monte Carlo approach to study how land cover speed conservation values influence evacuation simulations. Other macroscopic studies on evacuation modeling that use a geographical information system framework based on a shortest path algorithm (Katada et al. 2006) have analyzed the effect that warning dissemination has on the number of casualties. Furthermore, Wood and Schmidtlein (2012) developed an anisotropic path model to evaluate the impact of data resolution and travel speed parameters on evacuation times.
On the other hand, microscopic scale evacuation models simulate each person as an independent but interacting entity, which enables the consideration of a heterogeneous population. Hence several studies have used agent-based models (ABMs) to simulate tsunami evacuations using this microscopic scale. For example, Mas et al. (2012) did a simulation of the tsunami after the 2011 Tohoku earthquake in Japan considering an agent-based evacuation model of interacting vehicles and pedestrians to estimate casualties. In this work, agents (people) move to predefined shelters through a two-dimensional grid, in which the capacity of each cell is limited in order to simulate congestion that could be generated in a real situation. A similar approach was used by Solís and Gazmuri (2017), which also considered the reduction of agent speed because of slopes in the city of Iquique. In the same study area, León and March (2015) followed a different approach to simulate congestion by controlling the agent's speed based on the pedestrian density around it. The model was used to compare different agent behaviors, such as departure times and route selection procedures, as well as population distributions. However, all of these models simulate congestion indirectly, without using the restriction that agents cannot use the same physical space at the same time.
Moreover, the earthquake that precedes a tsunami may cause significant physical damage on buildings and infrastructure, and the debris generated may reduce the cross section of the evacuation routes. This effect has been studied previously in the context of falling contents of single buildings (e.g., Li et al. 2015, Liu et al. 2016, Xiao et al. 2016, Poulos et al. 2017). However, the effect of debris on city-scale evacuations that are due to tsunamis has not been studied previously, although similar studies exist for other types of hazards, such as fires following earthquakes (e.g., Nishino et al. 2013, Osaragi et al. 2014).
Consequently, the main objective of this investigation is to assess the effect of earthquake-induced damage on evacuations that is due to tsunami inundation. To quantify this effect, a range of earthquake intensities was considered to generate different amounts of debris in the streets. The amount of building damage corresponding to these intensities is estimated using an exposure model of the city, which represents the current building stock and associated fragilities. Debris is incorporated into the agent-based evacuation model to determine evacuation times to predefined safety zones. The model considers the interaction between people, cars, and debris using a collision avoidance algorithm (van den Berg et al. 2011), which ensures that agents are constrained to not occupy the same physical space at the same time. This enables the simulation of congestion as a natural process. The evacuation simulations are divided into two phases. First, the evacuation times of people within buildings are computed considering typical floor plans of reinforced concrete shear wall buildings and the number of floors of each structure. These times are then used to input agents into a model that considers the street evacuation. This latter model considers people walking with traffic and debris. The methodology proposed herein is applied to the coastal city of Iquique, north Chile, which has suffered several tsunami inundations throughout its history.
Methodology
A schematic diagram with the general methodology used to simulate the evacuation of a city is shown in Figure 1. Its first step consists of estimating damage of the built environment using fragility curves of buildings at a given ground motion intensity. This step is done using a detailed model of the city that was previously developed using the platform Hazus (Aguirre et al. 2018). Building damage was used to estimate the amount of debris generated that may reduce the speed of movement of pedestrians and vehicles because of a reduced cross section of the evacuation routes. In typical traffic models, it is customary to use a speed reduction factor to model this effect. However, in this work, because of the use of a microscopic model of individual agents, debris are considered as real physical obstacles that people must circumvent as they evacuate to safety zones.
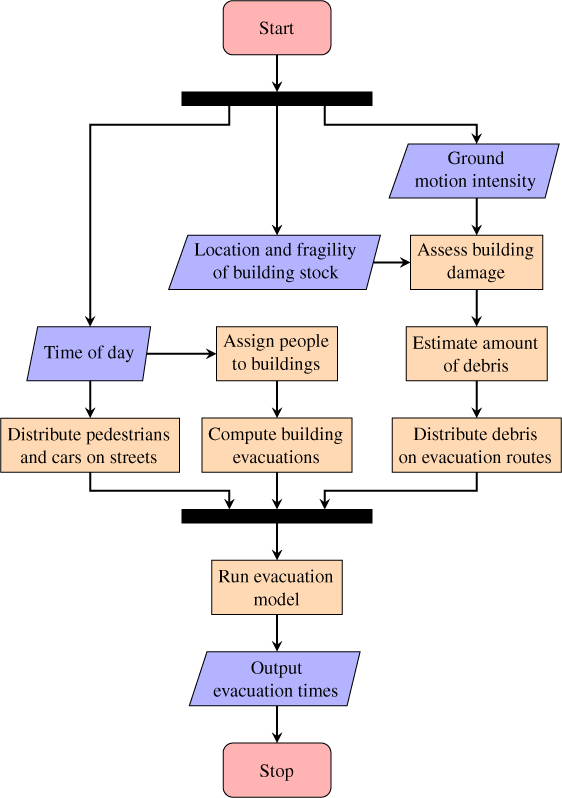
Flowchart of a single simulation of the proposed methodology.
Once the post-earthquake-damaged condition of the built environment is set, the evacuation is simulated using ABM, in which each agent represents a single person or car moving in the city during the event. Some people are located on the streets and start evacuating as soon as the ground motion ends or the tsunami alarm starts, but the majority are inside buildings (e.g., houses, offices, and schools), so they must first evacuate the structure in which they are located to get into the street evacuation routes.
Damage Model and State of the Network
City damage is estimated using the Hazus-MH module [Federal Emergency Management Agency (FEMA) 2015]. The methodology consists of an empirical approach to assess the debris generated from damaged buildings given a certain level of ground motion intensity, which in this case is characterized by the spectral acceleration at periods T = 0, 0.3, and 1 s. The methodology uses these inputs together with the building stock, which contains the type of structure in order to estimate the tonnage of debris generated per building. Hazus considers five building types (mobile home, masonry, concrete, steel, and wood), which in turn are divided into other four categories (residential, commercial, industrial, and other). The building height is also considered by defining three ranges for the number of stories (1–3, 4–7, 8+). With this information, different fragility and capacity curves are assigned to each building, obtaining the expected tonnage of debris. The tonnage of debris obtained from Hazus has to be preprocessed to be used in the evacuation simulations in order to transform it into realistic obstacles with physical dimensions. In the evacuation model used in this work, the network has a physical representation; therefore, the tons of debris falling into the streets have to be transformed into an effective volume. For this purpose, the factors developed by the U.S. Army Corps of Engineers (USACE) for converting between tons to cubic yards of debris were used, which FEMA has deemed reasonable (FEMA 2010). In the case of construction and demolition debris, USACE proposes the relation of 1 t = 2 CY = 0.76 m3.
The volume obtained after using the linear transformation has to be distributed along the perimeter of the building. Please note that the spatial distribution of debris is still an open research question. Some models for estimating geometries of debris were previously presented by Nishino et al. (2012), Osaragi et al. (2014), Quagliarini et al. (2016), Ravari et al. (2016), and Argyroudis et al. (2015). The latter proposes a simplified geometry to represent the building and the distribution of debris, as shown in Figure 2. In that model, it is assumed that debris will form a volume, as it should empirically, with the shape of a triangular prism with a larger height next to the building. Moreover, because debris may fall at any location along the perimeter of the building, its total volume is divided in several groups randomly. The characteristics of each group are expressed as a function of building height (H) and width (W); the proportion of volume of the damaged building with respect to the original volume, kv = (WHd + 0.5WdHd)/(WH); and the angle of the collapsed material relative to a horizontal plane (θ). With these parameters defined, the debris width (Wd) can be easily estimated using Equation 1:

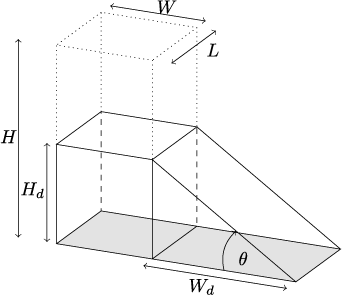
Simplified building representation to estimate the debris widths at collapse, adapted from Argyroudis et al. (2015).
In general, the height and width of the buildings are known. However, the values of kv and θ are uncertain and should be considered as random variables for each group of debris, and hence Wd. Following the methodology proposed earlier by Argyroudis et al. (2015), Wd is estimated using a normal distribution, and kv and θ are assumed to be statistically independent. The latter assumption is based on the observation that kv depends on the total amount of debris generated, while the parameter θ depends on the geometry of the prism that the fallen material adopts once on the ground. By making it parallel with a granular material, this angle should depend on the coefficient of friction of the fallen pieces of material rather than the generated volume. In other words, it is intuitive that for a granular material, the probability of a certain volume of debris given an angle θ = θ0, P(kv | θ = θ0) = P(kv). Thus the expected value (μWd) and the standard deviation (σWd) of the width of debris are estimated with the Harr's point estimate method (Harr 1989), using the expected values of kv and θ (μkv and μθ) and their respective standard deviations (σkv and σθ), as described in Equations 2–6:


Variables kv and θ are assumed as described in Argyroudis et al. (2015), i.e., μkv = 0.5, σkv = 0.15, μθ = 45°, and σθ = 13.5°. The width and height of the buildings are selected in order to represent the typical buildings in the study area, with W = 8 and H = 15 m. Pieces of debris are located randomly around the building, with L = 50 cm (see Figure 2), until the entire debris volume is reached. It is important to indicate that, although the methodology presented here allows for complete blockage of streets, such scenarios will not be considered in subsequent analyses.
Evacuation Model
The city evacuation model used herein is based on the work of Poulos et al. (2018). In this ABM, each agent (person) has the objective of reaching a certain location while avoiding collisions with other agents and static obstacles. The routes that agents follow to reach their objective are computed in real time using Dijkstra's algorithm (Dijkstra 1959); however, other wayfinding algorithms can also be used, such as artificial potential field methods (Khatib 1990), simple paths (Duckham and Kulik 2003), and least-risk paths (Vanclooster et al. 2014). Moreover, it is assumed that agents are familiar with the existing evacuation routes. This assumption seems to be realistic for the case study, since the evacuation routes are predefined by the authorities, communicated to the public, and head toward visible nearby mountains.
Once the evacuation routes are selected, agent movement is determined using the Optimal Reciprocal Collision Avoidance principle proposed by van den Berg et al. (2011), which prevents multiple agents from using the same space simultaneously. This is achieved at each time step by solving a constrained optimization problem for each agent to compute its displacement. Each agent is represented by a circle with an equivalent radius and a maximum speed, and its possible velocities are constrained by other agents and static obstacles around to ensure that there is no collision. Buildings, parked cars, and debris are modeled as impenetrable obstacles that agents need to bypass. The velocity of each agent is selected as the velocity that follows the global evacuation route as closely as possible among all feasible velocities. If several agents are close, their speed will be reduced in order to satisfy the constraints. This enables the emergence of congestion during the evacuation process as agent density increases.
Additionally, the model was extended to include cars in the simulation, which dynamically interact with pedestrians. Although authorities highly recommend not using vehicles during evacuation processes, the empirical evidence from the Pisagua earthquake of 2014 is different, and some people evacuated in cars along the evacuation routes. In this model, cars circulate only on the streets and are represented by agents with a larger size and maximum speed. The interaction between pedestrians and cars follows the same rules as the interaction between pedestrians. In addition, two types of vehicles are considered: first, those that move on the streets at the time of the earthquake (it is assumed that they start to move immediately after the earthquake), and second, those used by people who decided to evacuate from buildings and leave on cars a few minutes later.
The diameter used for pedestrians was 0.45 m, as stated in Poulos et al. (2018). Because of the limitations of the algorithm, vehicles were simplified to circular shapes with an equivalent diameter of 2.03 m instead of a rectangular shape. The maximum speed of each pedestrian is randomly selected using a Weibull distribution. The shape and scale parameters of the Weibull distribution are k = 10.14 and λ = 1.41 m/s, respectively, as indicated elsewhere (Poulos et al. 2018), with a mean value of the maximum speed of about 1.34 m/s. On the other hand, to represent the maximum speed of vehicles, the same distribution was used, but the shape and scale parameters were adjusted to k = 40 and λ = 15.5 m/s, yielding a mean value of a maximum speed of 55 km/h. Additionally, the maximum speed for pedestrians is reduced by a factor of ϕ depending on the slope, using the formula given by Tobler (1993):

In addition to evacuation route selection, it is also necessary to define the time when agents start to evacuate. Usually, the majority of people are inside of buildings, and therefore when an earthquake strikes the city, they have to evacuate the building before they seek city evacuation. To estimate these initial lag times, a typical approach is to use a probability distribution (e.g., Mas et al. 2012). However, this methodology does not consider information that can be crucial in real evacuations, such as the height of the buildings and their spatial distribution in the city.
Consequently, the methodology proposed in this work consists of estimating the initial (tini) and final (tend) times of the evacuation process of typical residential buildings of varying heights. To estimate building evacuation curves, different building layouts are used as well as a changing number of floors and occupancy rates. Probability density functions for initial and final times in each scenario were obtained using a kernel density estimation method from these simulations, with Gaussian distributions as the kernel functions. The distributions of tini and tend obtained from the simulations are presented in Figure 3 for different numbers of floors. Most buildings in the studied area have a number of floors ranging from one to seven. However, three buildings have more floors, and hence specific simulations with their floor numbers were performed. It is relevant to state that these times correspond to typical Chilean building layouts and would probably need adjustment in other cases.
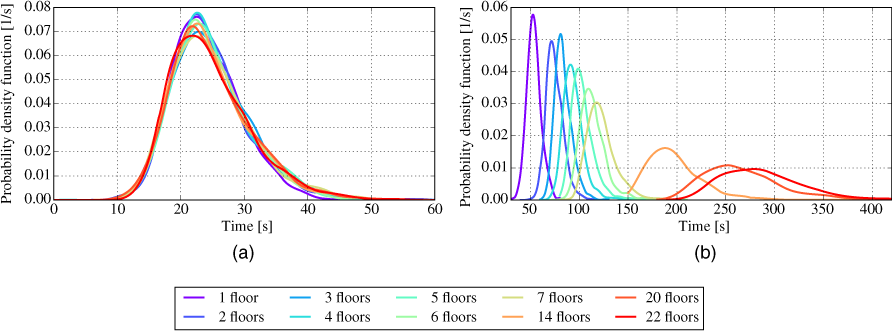
Distributions of evacuation times for the (a) first and (b) last person to evacuate the building.
Besides the evacuation time of the first and last person to evacuate a building, we assume herein that the evacuation curve of a building (i.e., the number of people that have evacuated as a function of time) has the shape of a beta distribution's cumulative distribution function. This curve was selected because of its geometric similarity to evacuation curve shapes of building evacuations presented in previous works (e.g., Li et al. 2015, Liu et al. 2015, Xiao et al. 2016, Poulos et al. 2017). Thus the number of people that have evacuated a building in time t is as follows:
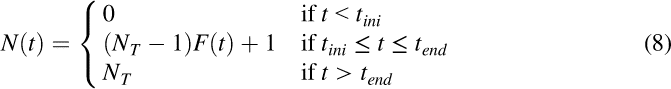
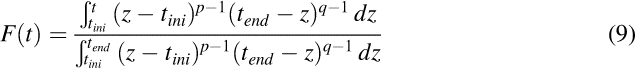
Parameters p and q control the shape of the beta distribution and were selected as p = q = 2 for this study.
The building evacuation curves are used to determine the times of each agent leaving the building, which becomes an input to the simulation of evacuation of the city. These times are only affected by the number of people and height of the building and do not consider the possible effects of building damage that could lead to casualties or an increase in evacuation times. Both of these effects were modeled in a previous study of a single structure (Poulos et al. 2017), but because of the large computational requirement, they were omitted in dealing with the city scale. From that point on, building evacuees start interacting with pedestrians and cars that had previously started their evacuation. When an agent reaches a safety zone, it is removed from the simulation, and its evacuation time is recorded. This behavior of the model is analogous to the consideration that the safety zones have an infinite capacity, i.e., there is no congestion within this zone. This is a reasonable assumption, since safety zones are open spaces in which evacuees may continue moving upwards.
Variables of Study
Three outputs of the simulations are analyzed in this study: the effective street area for pedestrian walking and the evacuation times for which 85% (T85%) and 95% (T95%) of the population have reached the safety zones. The effective street area for pedestrian walking corresponds to the available space for pedestrians to evacuate and is reduced by the presence of debris. Besides the reduction in the cross section by the physical space used by debris, there are other factors that narrow the evacuation route, as shown in the schematic diagram of a street in Figure 4. When obstacles hinder the normal flow of people, it is apparent that the effective section of the evacuation route is reduced because of the “shadows” caused by these objects, and people tend to walk in a direction that avoids such objects. This output is just an estimation of the network capacity, since agents will tend to move within the zone defined by the effective area but can still occupy the space that was reduced. This tendency can be seen in Figure 4, in which three time steps of an evacuation simulation are shown. Blue, red, and green circles represent the agents at the first (t1), second (t2), and third (t3) time steps, respectively.
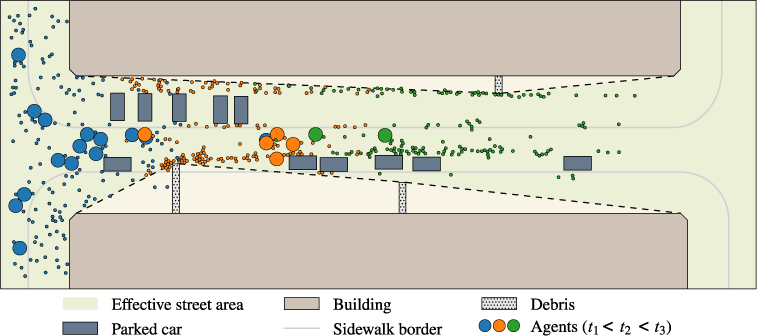
Representation of the effective street area for pedestrian walking on an example evacuation simulation at three different time steps.
Although the effective area affects the evacuation process, it does not consider the actual evacuation and hence can only be used as a proxy of the system's response. Indeed, the most direct and relevant way to measure the response is by estimating the evacuation times of people. The outputs considered to evaluate the effect of damage on the evacuation process are the times needed for 85% (T85%) and 95% (T95%) of the people to reach the safety zones. The evacuation time of the entire population is, by definition, controlled by the last evacuee. However, the evacuation process of this last person is not necessarily affected by other evacuees. Therefore, in order to prevent results from being spurious or affected by particular cases, the evacuation times of these two percentages are used.
Case Study
Iquique (20°13′00″ S, 70°09′00″ W) is a coastal city located in northern Chile and is the capital and largest city of the Tarapacá region. The population of Iquique is approximately 180,000 people, and the city represents the fifth most important port of the country (Aguirre et al. 2018). The city is located in a subduction zone and underwent a Mw 8.2 earthquake in 2014, which produced a tsunami that reached the city only 19 min after the event. The earthquake caused six casualties and affected more than 9,500 houses (Ministerio de Vivienda y Urbanismo 2014). However, it is estimated that the event only ruptured about 20% of the large seismic gap in the region (Lay et al. 2014), and a bigger earthquake and tsunami are expected to happen in the near future. The National Office of Emergency of the Ministry of Interior and Security (ONEMI) has defined the safety zones of Iquique for tsunami inundations as the areas with an elevation of 30 m.a.s.l., following the recommendation of the International Tsunami Information Center (ONEMI 2011; Figure 5).
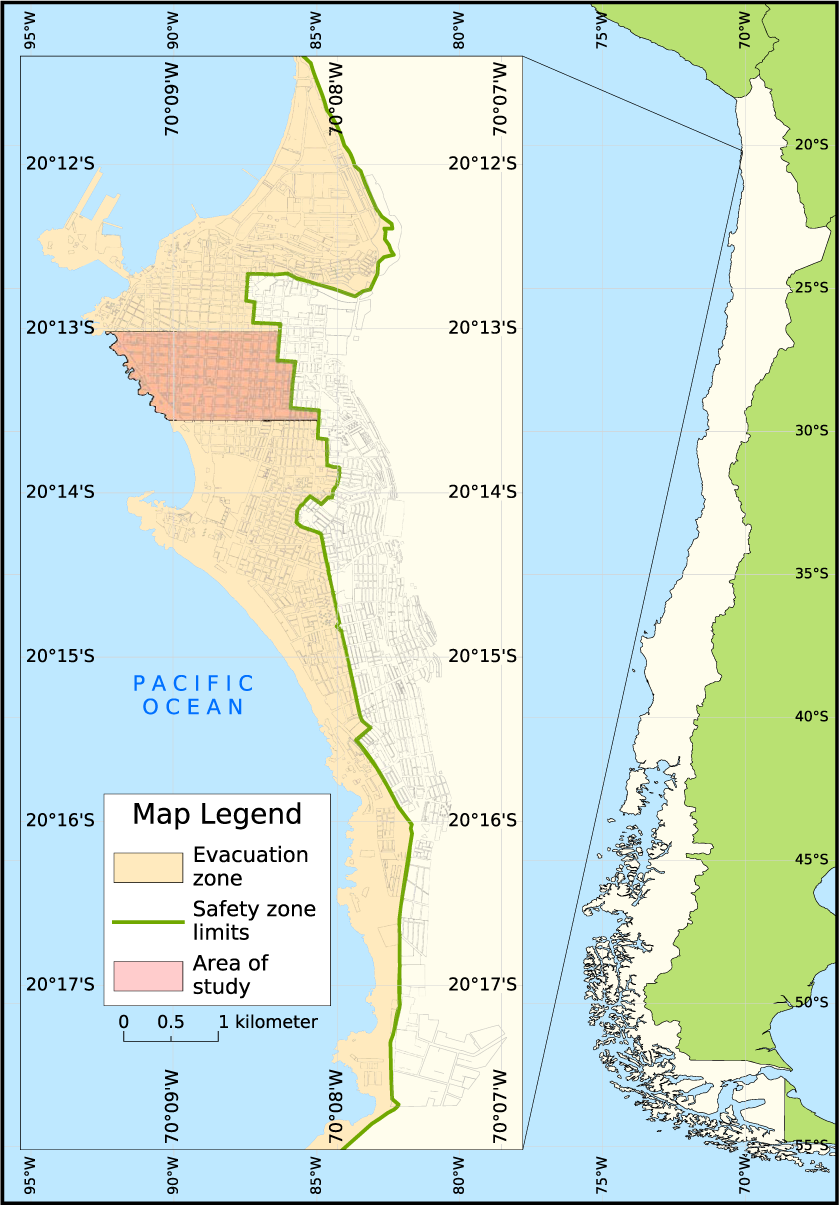
Map of the tsunami evacuation zone of Iquique, Chile, and the area of study of this work.
Our case only focuses on the downtown and historic zones of the city. The study is restricted to this area because the goal was more to evaluate the effect of damage in the evacuation process than to simulate the complete city, which is perfectly possible. The selected area is, however, a good representation of the entire city based on the type of buildings and population present in the area. As shown in Figure 6a, the evacuation routes defined by the authorities are the east-west direction streets that go from the coastline to the desert plateau. In the selected area, the longest distance to the safety zone is approximately 2 km with a slope that varies between 0.1° and 3° (see Figure 6b).
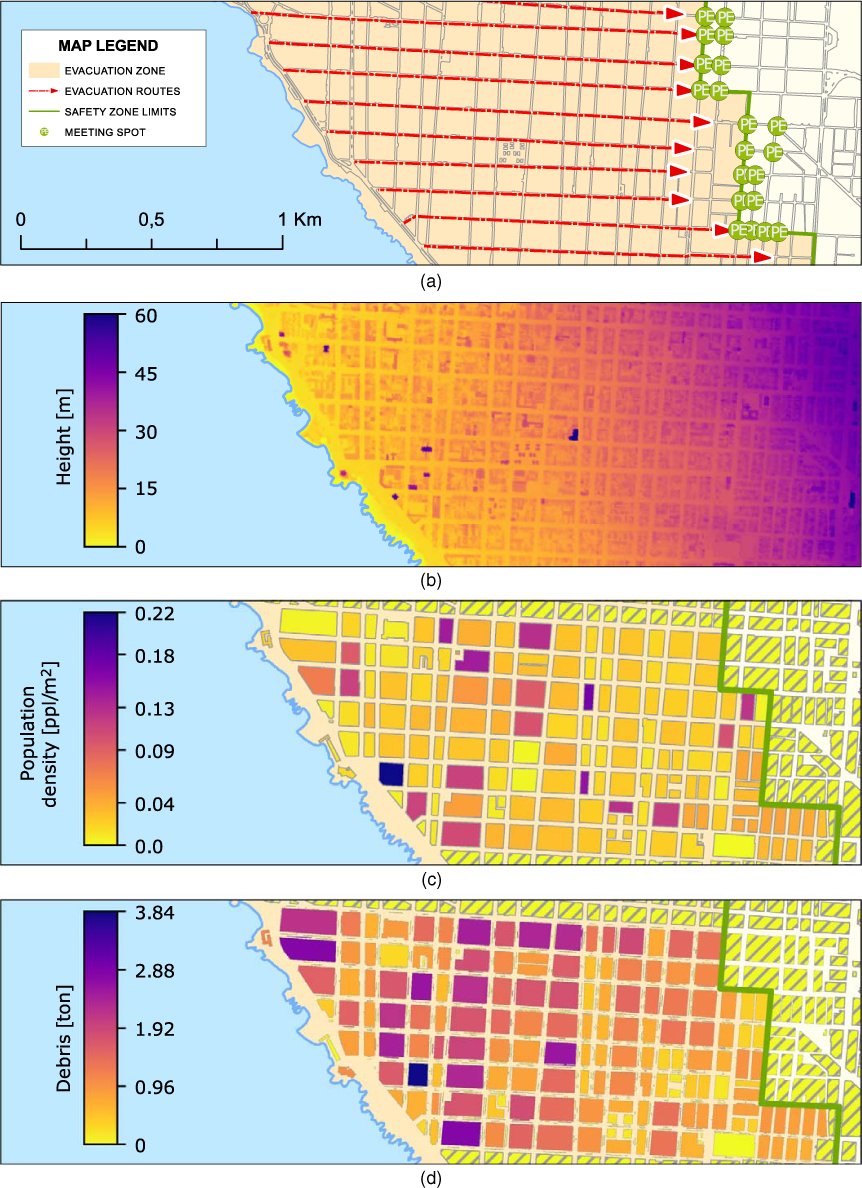
Study area of the city of Iquique, Chile, including (a) evacuation routes (red lines) to meeting spots (green dots), (b) topography of the area of study, (c) population density distribution during a weekday morning, and (d) debris distribution for intensity of PGA = 0.8 g.
The distribution of people in Iquique was obtained from the 2012 census database (Instituto Nacional de Estadísticas de Chile 2012), which indicates the number of people living at the block level. Nevertheless, this information represents only the number of permanent residents, which corresponds closely to a nighttime scenario. In order to consider a daytime scenario, we used the methodology and results provided in Aguirre et al. (2018), applying an Origin-Destination survey (EOD) carried out in 2010 (APIA XXI 2012). This survey shows the number of trips from each area of the city, their destinations and purpose (e.g., commercial and educational) at four different times of the day: morning, noon, and afternoon during rush and nonrush hours. Thus crossing the information of the census with the EOD, it is possible to estimate the population distribution at different times of the day. In this work, we focus on the morning scenario because it represents the most critical situation in terms of traffic congestion. However, only the commercial trips were considered from that analysis, while the number of students and their locations were included using the specific information of each school in the area. Proceeding this way, the estimation of the total number of people inside buildings in the area of study is about 34,000, and the distribution of the population per block during a morning scenario is shown in Figure 6c. People of each block were allocated randomly in the buildings considering the number of floors, except for schools, where the exact number of habitants was known. There was a total of 4,580 buildings in the area of study.
In addition to people in buildings, pedestrians on sidewalks during the earthquake are also considered in the evacuation model. Sidewalks in the area closer to the coastline are considered more crowded than the rest of the sidewalks, mainly because this area is closer to downtown, which attracts and generates pedestrian trips during weekday mornings. Considering 100 pedestrians for a crowded block and 1 pedestrian in an almost empty block, and assuming that 25% of the blocks are crowded, the resulting numbers yielded an average density of 0.25 pedestrians per meter of sidewalk. For a total length of 55 km of sidewalks, the total number of pedestrians on sidewalks during the earthquake is estimated to be 13,000. These pedestrians are randomly distributed throughout the network, considering higher density on the sidewalks closer to the shore, as previously stated. The consideration of these pedestrians is additional to the population inside the buildings, yielding a total of 46,500 people in the simulation.
To estimate the number of vehicles on the streets at the time the evacuation starts, i.e., during a morning scenario, the model assumes a situation in which the network is not congested. More specifically, sporadic queues exist only because of the operation of traffic lights. As a consequence, an average density of 40 veh/km-lane is used to determine the number of vehicles. Since the total number of km-lane of the network of interest is about 50, a total number of 2,000 vehicles was assumed to be on the streets when the evacuation starts. Once this number of total vehicles is defined, they are randomly distributed on the different streets.
Additionally, Iquique has a duty-free commercial port, which has an impact on the motorization rate in the city. With an estimation of 259 cars per 1,000 people, Iquique has a density of 23.7 vehicles per urban hectare, the highest density in Chile (Universidad Diego Portales 2012). This characteristic of the city is important because of its potential effect in the evacuation routes, i.e., the reduction of the available cross section space of streets for people to evacuate, thus generating potential congestion. To represent this particular situation of the city in the evacuation model, together with the building debris, parked cars should also be considered as evacuation obstacles. Thus in addition to the 2,000 moving vehicles, parked vehicles were located randomly as obstacles on the sides of the streets in order to satisfy the estimated density of 23.7 vehicles per urban hectare.
Once the spatial distribution of people and cars has been set, it is necessary to define the location of debris that is due to building damage. Unlike other works that model evacuation processes that are due to specific earthquake scenarios, this work studies the evacuation conditioned to different levels of ground motion intensity, characterized by the peak ground acceleration (PGA). However, as explained earlier in the methodology, the model also requires spectral accelerations at other periods (e.g., 0.3 and 1 s) to assess building damage. These spectral accelerations are correlated with PGA and depend on several aspects, such as global earthquake parameters (e.g., magnitude and focal depth), propagation properties, and local soil conditions. For the sake of simplicity, the relation between PGA and spectral accelerations was assessed deterministically using a uniform hazard spectrum (UHS), which corresponds to a response spectrum in which all spectral coordinates have the same return period (McGuire 2004). The UHS were constructed using the ground motion prediction equation proposed by Abrahamson et al. (2016) for subduction earthquakes and an average shear wave velocity on the upper 30 m of soil of 872 m/s, which was obtained from measurements in the area of study (Becerra et al. 2015). A total of ten equally spaced PGA intensities were used in this study, ranging from 0.1 to 1 g. An example of the debris distribution over the city is shown in Figure 6d, using a PGA value of 0.8 g, while the resulting spectra for five of these intensity levels are presented in Figure 7.
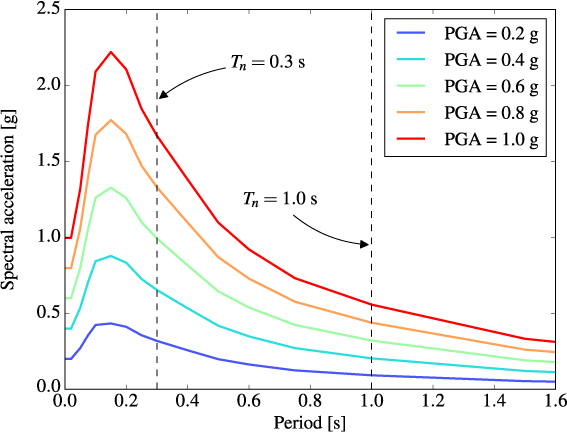
Uniform hazard spectra used to define the spectral accelerations at periods Tn = 0.3 and 1 s, which are necessary for damage assessment.
Results and Discussion
Certain components of the evacuation process are naturally random, such as the position of people and cars in streets, their speed, and the evacuation times from buildings. Hence multiple simulations for each PGA intensity are needed. The results for this study were obtained by running 70 evacuation simulations for each of the 10 ground motion intensities, plus the nondamaged case (PGA = 0). The debris estimation was obtained using Hazus (FEMA 2015), and the damage and evacuation models were implemented using our own codes.
The results of the undamaged scenarios are compared with empirical evacuation curves obtained from a drill carried out in Iquique in 2013. Approximately 70,000 people participated in the evacuation drill, which represents 39% of the city's population (Walker Rousseau 2013). Official reports indicate that the population reached safety zones in approximately 27 min but do not provide a more detailed analysis of the specific data for different evacuation routes.
The cumulative number of people arriving to the safety zone were measured at two meeting points during the drill, resulting in the evacuation curves presented in Figure 8. These curves show the percentage of people that have reached the safety zone at any given time. In order to evaluate the capability of the evacuation model to capture the evacuation process, the curves obtained during the drill are compared with those from 70 simulations of the undamaged case at the same meeting points. As should be expected, the curves from the simulations do not coincide exactly with those from the drill. Significant differences are observed regarding the time taken by both the first person and the last 10% of the group of people to reach the safety zone. This discrepancy is explained in part by the different modeling assumptions, such as the total number of evacuees and the evacuation times from buildings, but can also be explained by two other phenomena observed during the drill: (1) most people that were initially located close to the safety zone did not participate in the evacuation drill, and (2) some people stopped evacuating a few blocks before reaching the safety zone. In spite of this, the evacuation model captures the global trends of the evacuation process well.
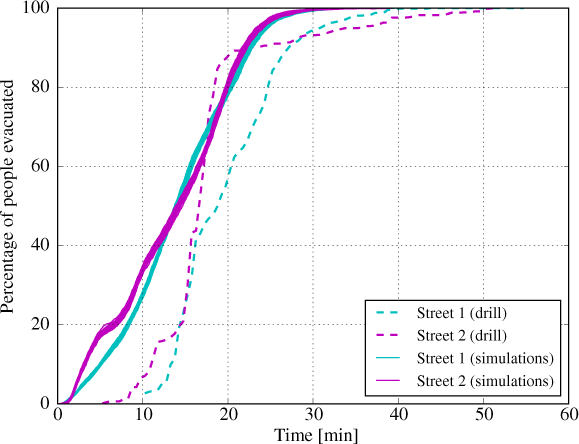
Evacuation curves showing the evolution of the percentage of people that have arrived in the safety zones of two evacuation route streets during the city evacuation drill and in 70 simulations of the model.
The spatial distribution of the nondamaged scenario evacuation times is shown in Figure 9. The results were arranged in a 10-m grid, in which each cell contains the average evacuation time of the agents that started the evacuation from that location. The times shown in Figure 9 are the mean values from 70 simulations. León and March (2015) also performed tsunami evacuation simulations for Iquique but did not consider the interaction between pedestrians and cars. They presented a comparable map with evacuation times that are roughly 20% shorter than the ones obtained here. However, their results are for a different, more optimistic scenario, in which all pedestrians start the evacuation at the same time.
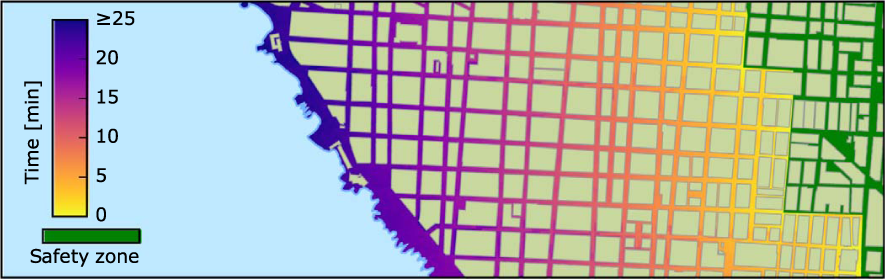
Map of the average evacuation times for the nondamaged simulations.
The effect of building stock damage is first analyzed by examining the change in the effective cross section street area as the intensity measure increases, normalizing the street area by the effective one without debris. The resulting normalized effective area and amount of debris estimated for each level of PGA are presented in Figure 10. The figure shows that the network reduces its capacity significantly for intensities greater than 0.5 g, resulting in an effective area reduction ranging from 6% to 16% at a PGA of 1 g. Moreover, the effective area presents a small variability because of the random nature of the debris width and location. Please note that the total amount of debris is the same for all simulations of a given intensity, since Hazus just provides an expected value without considering the uncertainty of different building damage states.
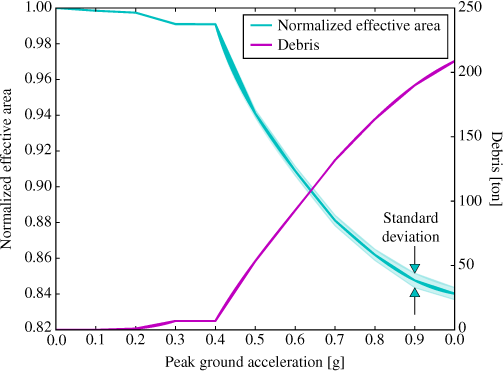
Physical effects of different levels of earthquake intensity in terms of the effective street area for pedestrian walking and the amount of debris.
Similarly to the capacity of the streets, the evacuation times T85% and T95% are also affected by the amount of debris, as seen in Figure 11. The time increment starts to be perceptible from PGA = 0.5 g, at which the increase of the mean of T85% is about 1.4% (representing an increment of 17 s) and 49 s for the mean of T95%. For larger PGA values, the evacuation times show a clearer and larger increase. For example, for PGA = 1 g, the mean times of T85% and T95% are 52 and 153 s longer than the base comparison case, respectively.
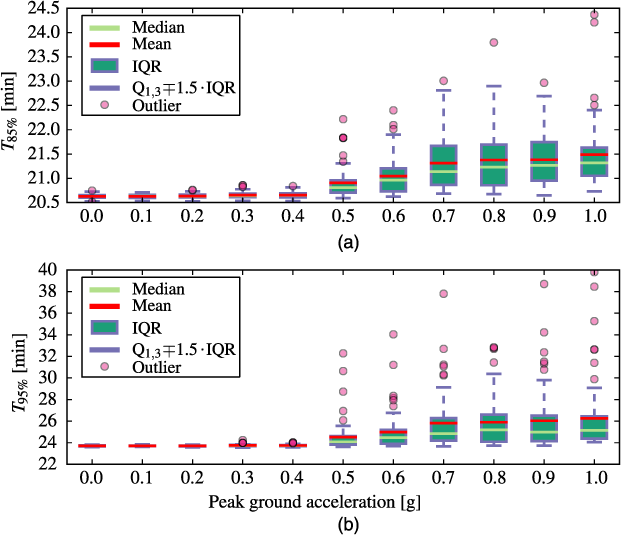
Change in evacuation times for different PGA levels: (a) 85% of evacuated people (T85%); (b) 95% of evacuated people (T95%). IQR, Interquartile range; Q1, 25th percentile; Q3, 75th percentile. Whiskers are the lowest data point greater than Q1 − 1.5 · IQR, and the highest data point lower than Q3 + 1.5 · IQR.
In some cases, the values obtained for the evacuation times presented in Figure 11 may expose a significant number of people to tsunami inundation. Indeed, the 2014 Mw 8.2 Pisagua earthquake showed that the first wave arrived at the coast about 15 min after the earthquake (Catalán et al. 2015). Although the purpose of this study is not to estimate the number of casualties in different scenarios or human risk, it is important to remark that, given the results shown in Figure 11, the tsunami waves are likely to arrive before the evacuation has ended, which may bring important consequences to the people.
Beyond the increase in mean evacuation times that was pointed out previously, another interesting result is the increase in variability when increasing PGA. For example, for an intensity level of PGA = 1 g, T95% ranges from an identical time of a nondamaged scenario to 16.1 min longer. A possible explanation for this large variability is given by how the debris distribution can partially block evacuation routes. As noted in Figure 6a, north-south streets are less important than east-west streets in terms of the number of people that will use them during the evacuation. Therefore, the same amount of debris can produce a wide range of critical route capacity reductions depending on how it is spatially distributed. The same variability is obtained when studying the correlation between the normalized effective street area and T95%, as shown in Figure 12. The Spearman and Pearson correlation coefficients between the variables are −0.77 and −0.5, respectively, which indicates a moderate negative linear correlation. Therefore, the amount of debris cannot be used by itself to estimate evacuation times precisely, and its spatial distribution plays a major role in generating congestion.
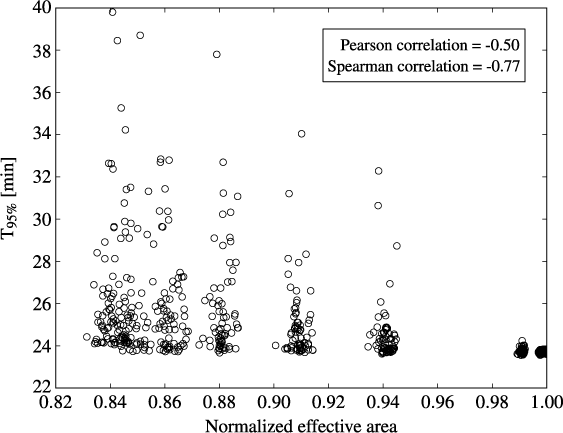
Correlation between the normalized effective street area and evacuation times for 95% of the population (T95%).
Conclusions
This work presents a new integrated methodology to estimate the evacuation time delay caused by earthquake debris, vehicles, and other geometric obstacles on large-scale city environments subject to ground shaking. Damage on the built environment for different earthquake intensity levels was estimated using building fragilities. This damage causes piles of debris on the evacuation network with geometries that may partially block the sidewalks and streets of the city. To simulate evacuation behavior, an ABM was developed to estimate the evacuation times of the interacting people to predefined safety zones.
This methodology was applied to downtown Iquique, Chile, since the city is located in the most significant seismic gap in the region. The evacuation times of the model without debris were first compared with data obtained from a real evacuation drill run in the city in 2013. The results of this validation show some differences in the times required to reach the safety zones, which are mainly explained by a significant portion of the community not participating in the voluntary drill. However, these results also provide relevant information and confidence in the developed model.
Despite the effect of debris, total evacuation times obtained by the model should be of real concern to the authorities of the city. It was shown that roughly 40% of the people in a nondamaged scenario would take longer to evacuate than the observed arrival of the first tsunami wave of the 2014 event (Catalán et al. 2015), indicating that a strong tsunami in the area may generate significant casualties. Naturally, the information presented in this article should be linked with tsunami scenarios that are consistent in intensity and rupture mechanism in order to estimate these casualties. This will be the subject of a sequel investigation. As it should, the most critical situation occurs with people near the coastline.
Ten earthquake intensities were used to simulate scenarios of damage in the city, generating 700 spatial distribution patterns of debris across the network. Results show that the effect of debris on the evacuation process increases evacuation times and hinders a fluent evacuation process for earthquake intensities greater than or equal to 0.5 g. For example, for an earthquake that generates PGA of 1 g, the time required to evacuate 95% of the population increases by 2.5 min on average when compared with the scenario without debris.
However, please note that the evacuation times estimated in this work were obtained using several assumptions that should be carefully understood. In the first place, the volume of debris was estimated from the damage state of buildings using the platform Hazus, and hence the validity of the results is limited to the empirical data used in the calibration of the Hazus models. Also, building damage was exclusively used to compute the amount of debris, neglecting other possible effects on building occupants, such as producing casualties or increasing the evacuation times by slowing or trapping people inside a building. Furthermore, it is assumed that evacuees cannot walk through debris, which leads to narrower street cross sections that may trigger congestion. In practice, people could present all sorts of behaviors by climbing on top of some pieces if their volume is small or scattered. It is apparent from the analysis that improved modeling of the geometry of debris and interaction between moving agents and debris is fertile ground for future research. Finally, although social behaviors of agents, such as herding and grouping, could be modeled, they have not been included in the results presented herein. Indeed, considering the capabilities of ABMs, the pedestrian-to-pedestrian interactions could include other more sophisticated decision-making rules.
In spite of the limitations previously mentioned, the methodology developed herein can be used to study evacuations under a multihazard scenario (e.g., tsunami and earthquake) and has some significant advantages over previous methodologies for simulating tsunami evacuations. First, it uses a collection of earthquake scenarios, each with different intensities, rather than a single scenario, providing more generally applicable results, which are preferred for the definition of robust public policies. Additionally, the methodology considers the evacuations that occur inside the buildings in the inundation zone, which are affected by the building heights. Finally, the use of a microscopic evacuation model enables the simulation of more complex behaviors and interactions of pedestrians and vehicles at the individual level. Hence the phenomenon of congestion emerges from the rules that govern the interactions between agents and their environment and is not forced from the top down.
Finally, the implementation of an evacuation model, such as the one presented herein, aims to improve current evacuation policies targeted to decrease the number of potential casualties affected by the tsunami. This model can be used to directly compare different evacuation strategies, such as the convenience of vertical evacuations relative to horizontal evacuation to safety zones, the enforcement of specific routes to optimize global evacuation rather than individual evacuations, or the evaluation of the impact of different city street layout interventions to optimize evacuation times. All of these results would provide valuable information to city policy makers and generally improve the preparedness of citizens in the case of an emergency. Indeed, some considerations on the applicability of these policies have been addressed in recent research (e.g., León et al. 2018), such as the characteristics that buildings should have for vertical evacuation (e.g., number and size of entrances) or subsidy policies for private buildings designed as vertical evacuation shelters. A direct next step in this research is to cross the evacuation simulations’ results with the tsunami inundation fields, which might affect the number of available evacuation routes.
Footnotes
Acknowledgments
This research has been sponsored by the National Research Center for Integrated Natural Disaster Management CONICYT/FONDAP/15110017 and by Fondecyt Grant No. 1170836. We also thank the Japan International Cooperation Agency and the Japan Science and Technology Agency through their Science and Technology Research Partnership for Sustainable Development Program Enhancement of Technology to Develop Tsunami-Resilient Community, which provided us with the topography used in this study.