
Abstract
Results of a study on the flexural behavior of confined masonry walls are presented. Six walls were tested in a laboratory under reverse cyclic loads. The variables studied were the wall aspect ratio and wall axial compressive stress. The behavior of walls was characterized by yielding of the longitudinal steel reinforcement of vertical confining elements followed by vertical and diagonal cracks on the masonry panel. The failure of walls was associated with crushing concrete of vertical confining elements. Flexural strength increased as the wall aspect ratio decreased or the wall axial compressive stress increased. The flexural strength of walls was validated using flexural theory. A displacement ductility capacity of 6 and a drift ratio capacity of 1% were proposed for the walls. A hysteretic model based on four parameters was calibrated. This model represented well the flexural behavior of the studied walls.
Introduction
In many countries in Latin America, central and south Asia, and eastern and southern Europe, confined masonry walls are widely used as a structural system (Tena-Colunga et al. 2009, Riahi et al. 2009). Confined masonry consists of an unreinforced masonry panel with flexible reinforced concrete confining elements around its perimeter. In this type of construction, the masonry panel is constructed first, and later, the confining elements are concrete cast. Confined masonry is built using different sorts of units (e.g., solid, hollow), unit materials (e.g., clay, concrete), and mortars, depending on the region. The use of confined walls in Mexico is very common because of their low construction cost and ease of construction.
The shear behavior of confined walls under in-plane lateral loads has been widely studied. There are several experimental studies carried out by different authors. The main variables studied are the unit type (Meli 1979, San Bartolomé and Quiun 2010), combination of clay and concrete units (Tena-Colunga et al. 2009), types and quantities of steel reinforcement in confining elements (Treviño et al. 2004, Quiroz et al. 2014), wall axial load (Urzua et al. 2001, Castilla and Marinilli 2000), wall aspect ratio (height over length; San Bartolomé et al. 1992, Perez Gavilan et al. 2015, Castilla and Marinilli 2000), toothing (Singhal and Rai 2016), and wall openings and type of reinforcement around openings (Flores et al. 2004). In general, these studies considered the shear behavior of confined walls with aspect ratios smaller than or equal to 1. Only one study considered wall aspect ratios up to 2.2 (Perez Gavilan et al. 2015). Walls considered by those authors were constructed using clay or concrete units. The shear behavior of walls was characterized by diagonal cracks that eventually formed the traditional “X” final cracking pattern. The failure of walls was mainly associated with the propagation of diagonal cracks in the top and bottom ends of vertical confining elements. The shear strength of walls was associated with the formation of the first diagonal crack. It was observed that confining elements increased the loading and deformation capacity of walls after reaching their shear strength.
In contrast, as far as the authors know, the flexural behavior of full-scale confined walls under in-plane lateral loads has not been studied. The authors only found a study on the flexural behavior of a half-scale structure tested with a shaking table (Bustos et al. 2000). The structure consisted of two confined masonry walls with a reduced amount of flexural reinforcement. The behavior of the structure was dominated by the flexural behavior of the walls.
Confined walls are mainly used in buildings for housing. In low-rise masonry structures, wall aspect ratios tend to be smaller than or equal to 1. The prescribed minimum amount of longitudinal (vertical) steel reinforcement for those walls (Gobierno del Distrito Federal 2004b) induces shear behavior. Walls tested under those geometrical and reinforcement conditions had shear failure, as described previously. Prescribed minimum amounts of longitudinal and transverse steel reinforcement for confined walls are based on shear behavior rather than flexural behavior (Gobierno del Distrito Federal 2004b). For example, closely spaced steel hoops are required at the ends of vertical confining elements to retard the propagation of diagonal cracks in these elements. Reduction in the amount of the longitudinal steel reinforcement below the minimum might be used to induce flexural behavior. Flexural strength of walls will be reduced, but the shear strength will remain the same. For taller masonry structures, wall aspect ratios tend to be much greater than 1. In this case, the prescribed minimum amount of longitudinal steel reinforcement might induce flexural behavior rather than shear behavior. Flexural behavior is desirable in seismic zones because it is a more ductile behavior than shear behavior. In the first case, the behavior is characterized by yielding of the steel reinforcement, and in the second, it is characterized by the formation of diagonal cracks on the masonry wall panel.
There are some studies related to the in-plane flexural behavior of other types of masonry walls. In the case of reinforced walls, the main variables that have been studied are the quantity and distribution of reinforcement (Yoshimura et al. 2000, Shedid et al. 2008), wall axial load (Tanner et al. 2005, Varela et al. 2006, Shedid et al. 2008), and wall aspect ratio (Tanner et al. 2005, Varela et al. 2006). Flexural behavior of those walls was, in general, characterized by flexural cracks over the wall height followed by yielding of the longitudinal steel reinforcement. The failure of walls was mainly associated with crushing of the masonry or concrete at wall ends. The flexural strength of walls was maintained over a certain maximum displacement ductility.
The objective of this article is to study the flexural behavior of confined walls subjected to reverse cyclic loads. As far as the authors know, there is no previous research on full-scale confined walls subjected to this type of load in the literature. The results of six confined walls subjected to lateral loads are presented. The variables studied were the wall aspect ratio and wall axial compressive stress. The final cracking patterns of walls are presented. The lateral load-drift ratio curves for the walls are analyzed. A discussion related to flexural strength, displacement ductility, and drift ratios is presented. A hysteretic model is calibrated based on experimental data.
Experimental Program
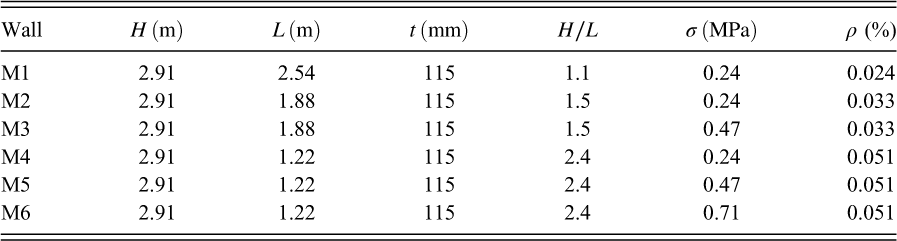
Six full-scale confined walls were tested in the laboratory (Walls M1 to M6). Walls were constructed using hollow clay bricks with nominal dimensions of 115 × 200 × 320 mm (thickness × height × length). The ratio between the net and gross area of the bricks was about 0.54. Bricks were obtained from a single batch. The study variables were the wall aspect ratio (H/L) and axial compressive stress (σ; Table 1). Aspect ratios were selected to be greater than 1 (1.1, 1.5, and 2.4) to facilitate wall flexural behavior. Axial compressive stresses of 0.24, 0.47, and 0.72 MPa corresponded to two, four, and six-story masonry structures, respectively. The amount of vertical reinforcement was selected to induce flexural behavior. Details of each confined wall are presented in Table 1. In this table, H, L, and t are the wall height, length, and thickness, respectively. The wall height was measured up to the point of load application.
Details of confined walls
Cross-section dimensions of vertical confining elements were 115 × 115 mm (width × height). Longitudinal steel reinforcement in those elements consisted of a 1#3 (9.5 mm) bar (Figure 1). The corresponding steel reinforcement ratio (ρ) is included in Table 1. This ratio was calculated using the wall cross section. No transverse reinforcement was placed on the vertical confining elements (Figure 1). Longitudinal reinforcement consisted of deformed steel bars with nominal yield strength of 412 MPa. The amount of longitudinal steel reinforcement of the walls was smaller than the minimum amount prescribed in the Mexico City Masonry Technical Norm (Gobierno del Distrito Federal 2004b).
Typical longitudinal steel reinforcement in walls.
The compressive strength of the concrete of vertical confining elements was determined according to NMX-C-083-ONNCCE-2002 [National Organization for Norms and Certification for Construction and Buildings (ONNCCE) 2003]. Compressive strength of bricks was determined according to NMX-C-036-ONNCCE-2004 (ONNCCE 2004). Compressive strength of mortar was determined according to NMX-C-061-ONNCCE-2010 (ONNCCE 2010). Compressive strength and modulus of elasticity of masonry were determined according to NMX-C-464-ONNCCE-2010 (ONNCCE 2011). Samples of six specimens were considered for each case. The tensile strength of the steel longitudinal reinforcement of the vertical confining elements was determined according to NMX-C-407-ONNCEE-2001 (ONNCCE 2001). A sample of three specimens was used. Procedures presented in these norms are similar to those specified in corresponding ASTM standards.
Walls were constructed in a half running bond by a qualified worker. Brick courses were laid using mortar in proportion by volume 1:3 (Portland cement:sand). Mortar was placed on both the face shells and the head joints. The average thickness of mortar joints was 10 mm. The construction of walls was as follows: First, the seven bottom brick courses were laid, and later, the corresponding parts of the vertical confining elements were concrete cast. Second, the last five brick courses were laid, and the corresponding remaining part of the vertical confining elements were cast. Finally, the top confining element was cast.
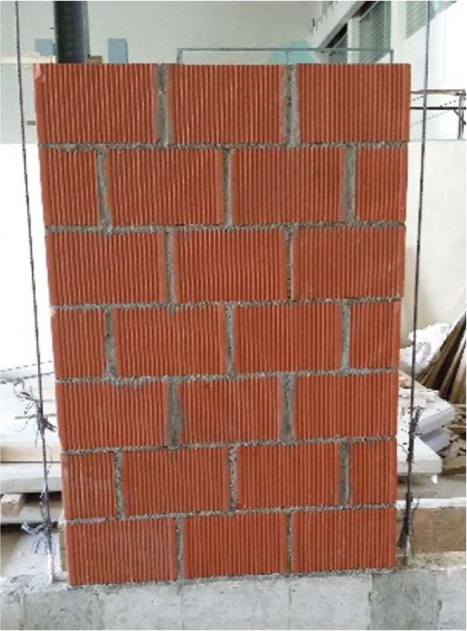
Each confined wall was tested with constant axial load and reverse monotonic cyclic lateral loads until failure. Axial load for each wall was calculated using the corresponding axial compressive stress, wall length, and wall thickness (Table 1). Axial load was applied using a swivel beam, a spreader beam, two threaded rods, and a hydraulic actuator (Figure 2a). Pressure in the actuator was maintained constant during the test using a mechanical load maintainer (Edison 1994). Axial load was measured using two donut-type load cells. This load was verified using a pressure transducer. Lateral loads were applied using a steel frame, loading steel beam, and two-way hydraulic actuator (Figure 2b). Lateral load was measured using a tension-compression pin load cell. This load was verified by using two pressure transducers. Wall specimens were attached to the lab reaction floor.
(a) Axial load test setup, (b) lateral load test setup, (c) typical view of wall instrumentation, and (d) loading protocol.
Horizontal and vertical wall displacements and shortening or lengthening of wall diagonals were measured using linear string potentiometers (SP). Relative displacements between the loading beam and wall, wall and wall foundation, and wall foundation and reaction floor were measured using potentiometers (LP). Strain gages were attached to the longitudinal steel reinforcement of both vertical confining elements. Two strain gages were located at the bottom of each bar. A typical view of wall instrumentation is presented in Figure 2c. In this figure, PLC and DLC refer to the pin-type load cell and donut-type load cell, respectively.
The loading history used to test the walls was based on the protocol established in the Mexico City Masonry Technical Norm (Gobierno del Distrito Federal 2004b). This loading history has six initial reverse cycles controlled by load and subsequent cycles controlled by drift ratios (Figure 2d). The maximum target load was associated with yielding of the longitudinal steel reinforcement of the vertical confining elements (Vy). The target load for the first two cycles was equal to one quarter of the maximum target load, the third and fourth cycles to one half of the maximum target load, and the fifth and sixth cycles to the maximum target load. After that, increments of drift ratios of 0.002 were applied.
Experimental Results
The average compressive strengths of concrete (fc) of Walls M1 to M6 were equal to 17.49, 18.10, 20.00, 18.36, 22.16, and 21.23 MPa, respectively. The corresponding coefficients of variation (CV) were equal to 0.08, 0.04, 0.03, 0.08, 0.02, and 0.01, respectively. The average compressive strength of units (fp) was equal to 16.33 MPa with a CV of 0.06. The average compressive strength of mortar (fj) was equal to 15.85 MPa with a CV of 0.08. The average compressive strength (fm) and modulus of elasticity (Em) of masonry were equal to 9.08 and 5,077 MPa, respectively. The corresponding CV were equal to 0.04 and 0.12, respectively. The average yielding strength of the longitudinal steel reinforcement was equal to 445.7 MPa with a CV of 0.02. All values were calculated using gross properties of corresponding cross sections.
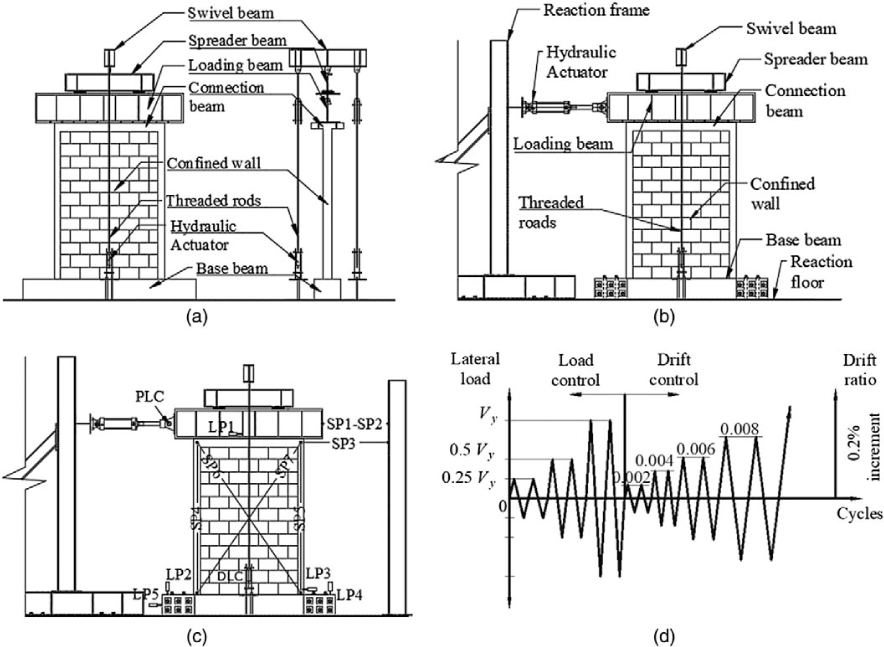
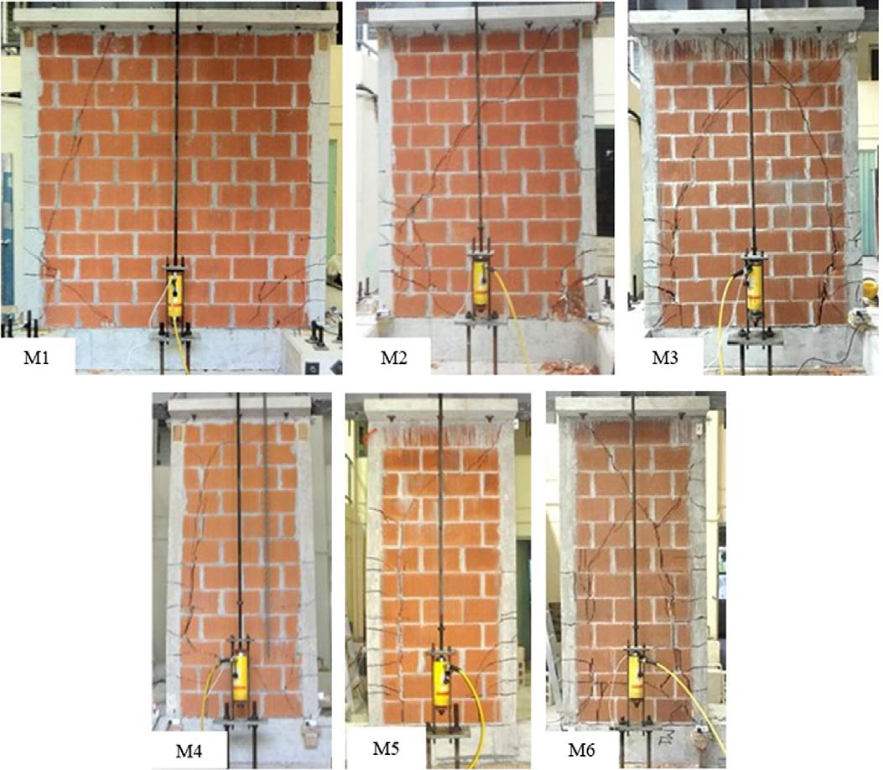
The flexural behaviors of walls were, in general, similar. First, a horizontal flexural crack was observed at the joint between the first brick course and the concrete foundation together with horizontal flexural cracks on the bottom part of the vertical confining elements. After this, yielding of the longitudinal steel reinforcement at the bottom end of the vertical confining element in tension was reached. As the drift ratio was increased, horizontal flexural cracks propagated into the masonry panel, and new flexural cracks were observed along the height of the vertical confining elements. A single vertical crack was observed for Walls M2, M4, and M5 and two vertical cracks for Walls M3 and M6 (Figure 3). Diagonal shear cracks were observed on the masonry panels. These cracks propagated from the top part of the masonry panels to the existing vertical cracks. Out-of-plane buckling of one of the vertical confining elements was observed for Wall M5. The failure of walls was associated with crushing concrete at the bottom part of the vertical confining elements. The final cracking patterns of walls are presented in Figure 3. Lateral load-drift ratio curves of walls are presented in Figure 4.
Final cracking patterns of walls.
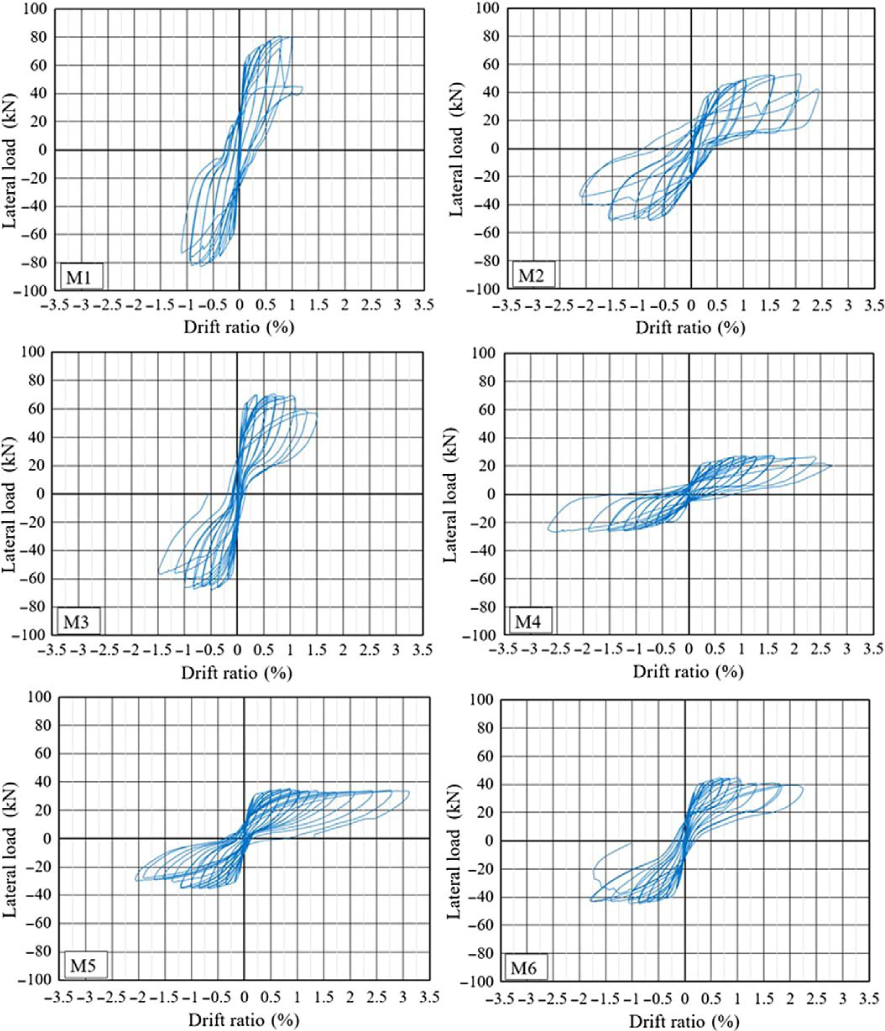
Lateral load-drift ratio curves of walls.
Discussion of Experimental Results
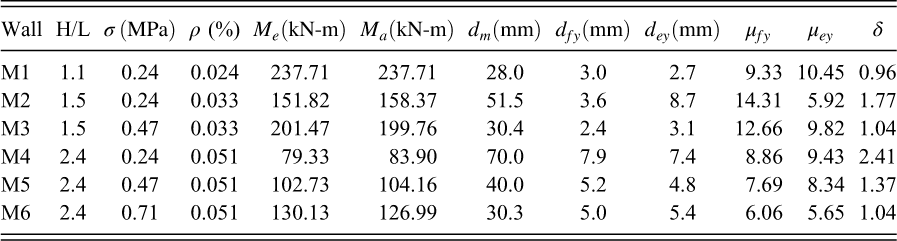
The experimental average flexural strengths of walls (Me) are presented in Table 2. These strengths were calculated using the corresponding positive and negative maximum observed lateral loads. As expected, for walls with the same axial compressive stress (Walls M1, M2, and M4), the flexural strength increased as the aspect ratio decreased (Figure 4). For walls with the same aspect ratio (M4 to M6), the flexural strength increased as the axial compressive stress increased (Figure 4). Analytical flexural strengths of walls (Ma) are also presented in Table 2. These strengths were calculated using flexural theory (kinematics, constitutive models, and equilibrium). A rectangular block was used for the compressive stresses of concrete (Gobierno del Distrito Federal 2004a). This type of block was used because the wall neutral axis (c) was located within the height of the vertical confining element. The height of the rectangular block was defined by 0.85fc and the depth by β1 c, where β1 was equal to 0.85. A stress-strain relationship of the steel, including strain hardening, was used (Rodriguez and Botero 1997). A good agreement between analytical and experimental flexural strengths (Ma/Me) was observed for the walls (Table 2). The ratio Ma/Me varied from 0.98 to 1.06.
Experimental flexural strengths, analytical flexural strengths, displacement ductilities, and drift ratios of walls
Maximum horizontal displacements were calculated for the walls, one in each loading direction. These displacements were limited by a 10% strength degradation or the presence of the first diagonal crack on the wall, whichever happened first. A value of displacement capacity (dm; Table 2) was proposed for each wall as the minimum between the maximum horizontal displacements in the corresponding positive and negative loading directions.
The envelopes of the lateral load-drift ratio curves of walls are presented in Figure 5. Each envelope curve is presented in both loading directions up to the corresponding value of displacement capacity. Solid and hollow triangular markers are included in Figure 5 to represent 10% strength degradation and the presence of the first diagonal crack on the walls, respectively. The displacement capacity of Wall M2 was controlled by the first criterium in the negative loading direction and that of Walls M1, M3, M4, M5, and M6 by the second criterium in the positive loading direction.
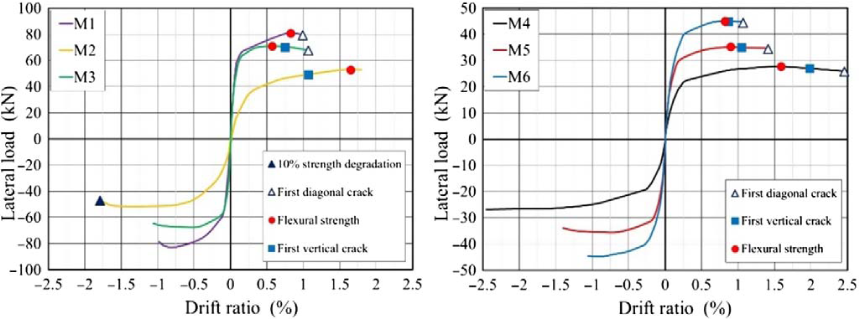
Envelopes of lateral load-drift ratio curves of walls.
Drift ratio and displacement ductility are measures of the deformation capacity of a wall. Drift ratios were calculated dividing the displacement capacities (dm; Table 2) by the wall height (H; Table 1). Wall drift ratios (δ) are presented in Table 2. Displacement ductility is defined as the ratio of a maximum displacement to a given yielding displacement. In general, there is no consensus in the literature on how to determine both displacements. Maximum displacements of the walls were defined as the displacement capacities (dm; Table 2). Two yielding displacements were determined for each wall. The first one was calculated using the average strain readings of 0.0022 (dfy; Table 2). This displacement is associated with first yielding of the steel reinforcement of the vertical confining elements. The second one was calculated using the method proposed by Paulay and Priestley (1992). This method is based on equating the areas under the measured and idealized bilinear curves up to the displacement capacity (dm; Table 2). The initial secant stiffness of the bilinear curve is defined at 75% of the equivalent load at yielding (Vey; Figure 6). Equivalent yielding displacements (dey) for the walls are presented in Table 2. Displacement ductilities at first yielding (μfy) and equivalent displacement ductilities (μey) are presented in Table 2. In both cases, only the loading direction at first yielding was considered. In general, the displacement ductilities at first yielding (μfy) and the equivalent displacement ductilities (μey) were similar (Table 2). The ratio μey/μfy for Walls M1 to M6 was equal to 1.12, 0.41, 0.78, 1.06, 1.08, and 0.93, respectively. The large difference observed for Wall M2 was unexpected. More experimental testing is needed to validate this result.
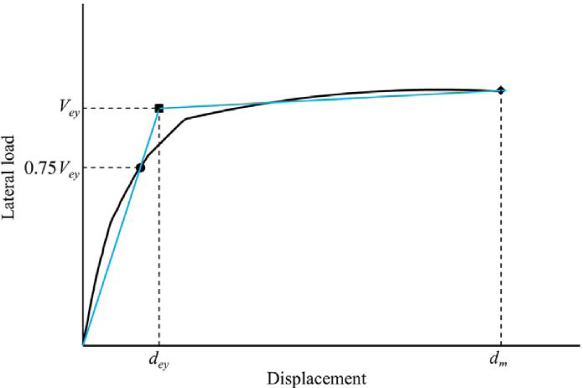
Experimental and idealized lateral load-displacement curves.
For walls with the same axial compressive stress (Walls M1, M2, and M4), drift ratio increased as the wall aspect ratio increased. Corresponding displacement ductilities (μfy) did not follow that trend because Walls M1, M2, and M4 with the same axial compressive stress had different axial loads (P; Table 3) and different steel reinforcement ratios (ρ Table 2). Displacement ductility (μfy) increases as the axial load decreases or the steel reinforcement ratio decreases. Wall M1 had the maximum axial load but the minimum steel reinforcement ratio. Wall M4 had the minimum axial load but maximum steel reinforcement ratio. For walls with the same aspect ratio (Walls M4 to M6), as expected, drift ratios (δ) and displacement ductilities (μfy) increased as the axial compressive stress decreased. The displacement ductilities (μfy) of the walls varied from 6.06 to 14.31. The drift ratios (δ) varied from 0.96% to 2.41%. These values showed that the studied confined walls had good deformation capacity under lateral loads. The minimum displacement ductility (μfy) and drift ratio (δ) of the walls were about 6% and 1%, respectively. Based on those minimum values, a displacement ductility capacity of 6 and drift ratio capacity of 1% are proposed for the studied confined walls. The ductility capacity of 6 is greater than the value of 3.5 reported for reinforced autoclaved aerated concrete (AAC) walls with flexural behavior (Varela et al. 2006). The drift ratio capacity of 1% is equal to that reported for those reinforced AAC walls (Varela et al. 2006) but is greater than the values between 0.25% and 0.35% proposed for confined walls with shear behavior (Gobierno del Distrito Federal 2004b).
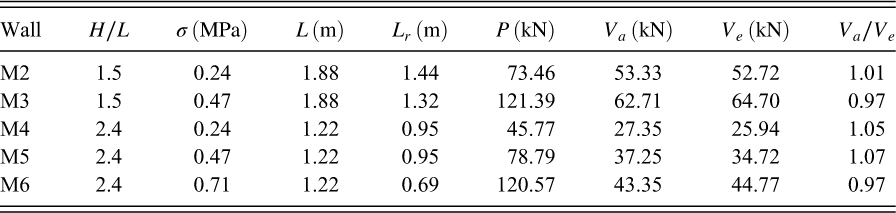
Analytical and experimental shear strengths of walls
Vertical cracks were observed for Walls M2 to M6, one for Walls M2, M4, and M5 and two for Walls M3 and M6. Square and circular markers are included in Figure 5 to represent the presence of the first vertical crack and the flexural strength of the walls, respectively. For Walls M3 to M6, the first vertical crack was observed after the corresponding flexural strength. For Wall M2, the vertical crack was observed first. Vertical cracks formed on the wall side in compression. These cracks were, in general, located on the bottom brick courses about 150 mm from the joint between the vertical confining elements and the masonry panel (Figure 3). Vertical cracks were associated with the brick bond pattern used in construction and the nonuniform vertical deformation along the wall length. The mortar head joints of alternating end bricks were vertically aligned (Figure 3). It was observed during testing that vertical cracks formed first at those head joints and then propagated into the bricks. This was related to the smaller compressive strength of the mortar of joints compared with that of the bricks. The nonuniform vertical deformation along the wall length was caused by the difference between the modulus of elasticity of concrete and masonry. The modular ratio between concrete and masonry was about 3. For example, under only axial load, the axial stress on the wall is uniform, but the bricks close to the vertical confining elements tend to deform less than those located at the wall midlength. This deformation gradient was greater for the walls with smaller lengths. Wall M1, which had the largest length, did not have any vertical cracks. Under lateral loads, the compressive stress increases at the corresponding wall end. Vertical cracks on walls with aspect ratios greater than 1 have also been observed by other authors (Sosa 2013, Perez Gavilan et al. 2015).
Vertical cracks divided the walls into wall segments. As the “effective” wall length decreased, the shear strength of the walls also decreased. This strength reduction triggered the formation of diagonal cracks observed on the walls. Analytical shear strengths (Va) were calculated using Equation 1 (Fernandez-Baqueiro et al. 2014). In this equation, vm is the average diagonal compressive strength (shear strength) of the masonry of 0.83 MPa as reported by the manufacturer of the bricks, α is the inverse of aspect ratio (L/H), At is the wall cross-section area of the wall, and P is the wall axial load. Values of α and At were calculated using reduced wall lengths (Lr; Table 3). These reduced lengths were measured before the diagonal cracking. Analytical shear strengths of walls (Va) are compared in Table 3 with corresponding observed lateral loads at first diagonal cracking (Ve). In this table, P is the total axial load on the wall, including the wall and loading beams’ self weight. A good agreement between analytical and experimental shear strengths (Va/Ve) was observed (Table 3). The ratio Va/Ve varied from 0.97 to 1.07.

The secant stiffness at yielding of the steel longitudinal reinforcement (Ky) of Walls M1 to M6 was equal to 19,959, 8,463, 21,772, 2,737, 5,574, and 6,775 kN/m, respectively. Each yielding stiffness was calculated using the displacements at first yielding (dfy) and only the first positive cycles. For walls with the same axial stress (Walls M1, M2, and M4), the secant yielding stiffness decreased as the aspect ratio increased. For walls with the same aspect ratio (Walls M4, M5, and M6), the secant yielding stiffness increased as the axial stress increased. Normalized stiffness degradation (Ki/Ky) curves for the walls as a function of the displacement ductility (μfy) and drift ratio are presented in Figure 6a and 6b, respectively. The secant stiffness (Ki) of each positive cycle was divided by the secant yielding stiffness (Ky). Load cycles up to the values of displacement capacities of walls (dm; Table 2) were included.
For a given displacement ductility (μfy), the normalized stiffness degradation of walls was similar (Figure 7a). For displacement ductilities (μfy) of 2, 4, and 6, the normalized stiffness degradation was about 55%, 30%, and 20%, respectively. For a given drift ratio, the stiffness degradation of walls was different (Figure 7b). For drift ratios of 0.5% and 1%, the normalized stiffness degradation varied from 18% to 60% and 9% to 33%, respectively. The relationship between displacement ductilities (μfy) and corresponding drift ratios of walls are presented in Figure 7c. For Walls M1, M2, M3, M5, and M6, the displacement ductility capacity of 6 is reached before the drift ratio capacity of 1%. For Wall M4, with the smallest secant stiffness at yielding, the drift ratio capacity of 1% is reached first. Damage of walls associated with displacement ductilities of 2, 4, and 6 are presented in Figure 8. Damage on walls increases as the displacement ductility (μfy) increases from 2 to 6. Walls M4 to M6, which had the smallest displacement ductility capacities (μfy; Table 2), had more damage compared with other walls. Information presented in Figure 8 could be used to select displacement ductility and drift ratio capacities of walls based on different damage levels.
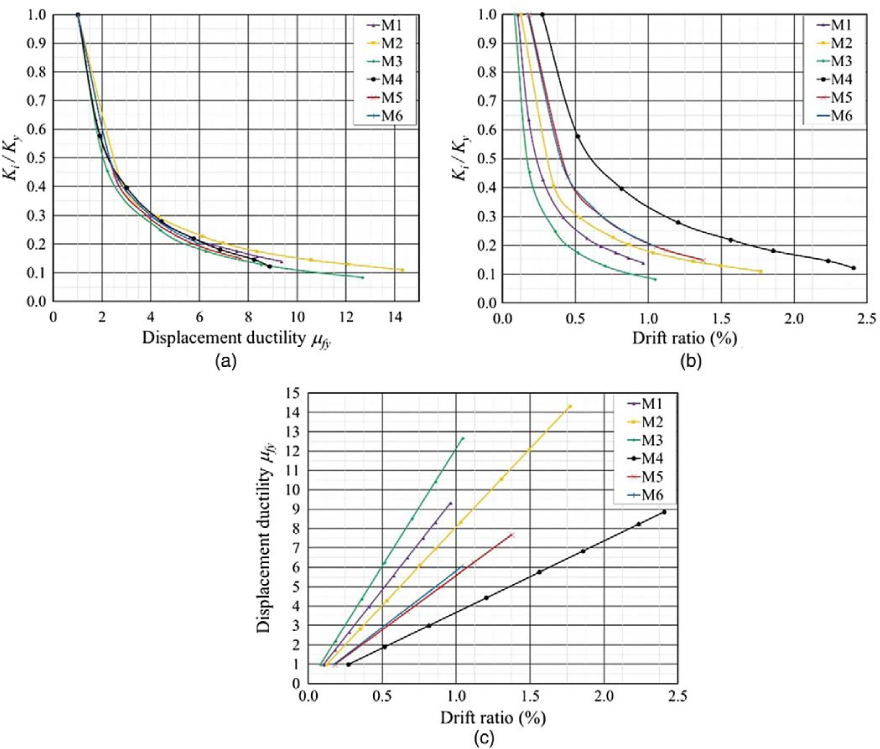
(a) Normalized stiffness degradation as a function of displacement ductility at first yielding, (b) normalized stiffness degradation as a function of drift ratio, and (c) relationship between displacement ductility at first yielding and drift ratio of walls.
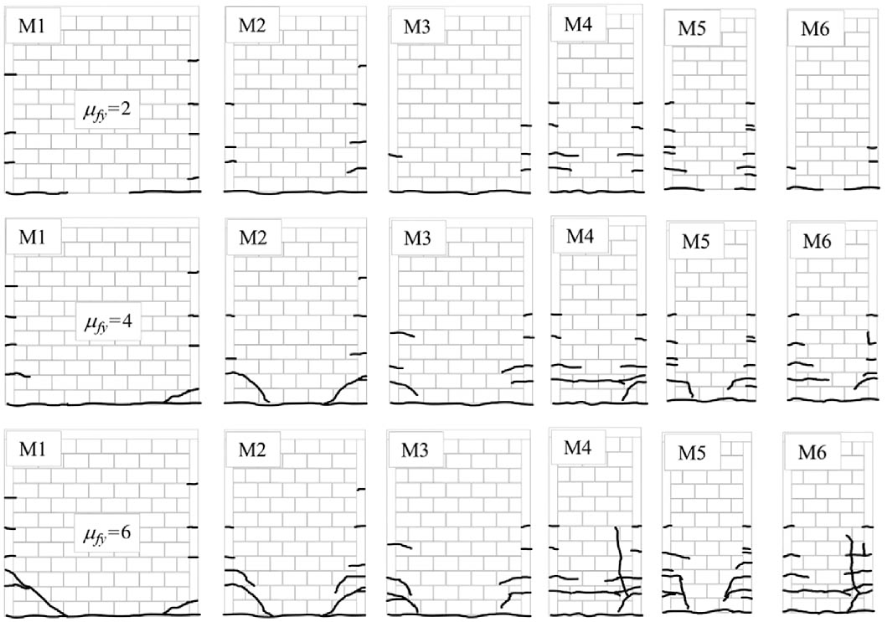
Damage of walls as a function of displacement ductility at first yielding.
Analytical Models
The CA7 hysteretic model (CANNY 1999) was calibrated to represent the flexural behavior of the walls (Figure 9). The bilinear loading branch of the model was defined by the yielding stiffness (Ky) and postyielding stiffness (Kpy) of the walls. The unloading branch was defined by the unloading stiffness (Ku) and the slope of the target straight line U-U ′. Degradation of the unloading stiffness (Ku) was considered as a function of wall displacements.
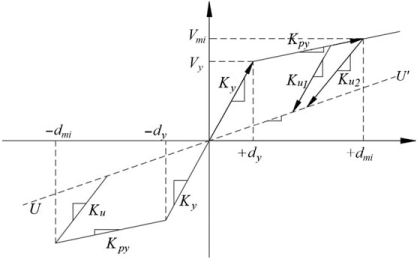
Hysteretic model for walls.
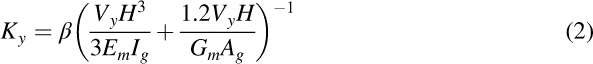
The yielding stiffness of the walls (Ky) was defined by Equation 2. In this equation, β is a hysteretic parameter, Vy is the lateral load associated with yielding of the longitudinal steel reinforcement, Gm is the shear modulus of elasticity of masonry, Ig is the gross moment of inertia of the cross-section area, and Ag is the gross cross-section area. Values of β were backcalculated for Walls M1 to M6 using each corresponding experimental secant yielding stiffness. Values of β are presented in Table 4. For walls with the same axial compressive stress (Walls M1, M2, and M4), the values of β varied between 0.25 and 0.36 with a mean value of 0.30. For walls with the same aspect ratio (Walls M4 to M6), values of β increased as the axial compressive stress increased. The values of β were equal to 0.25, 0.51, and 0.62, respectively. The postyielding stiffness (Kpy) was defined as a function of the initial yielding stiffness (Ky; Equation 3). Values of γ were calculated for Walls M1 to M6 using the loading parts of the lateral load-drift ratio curves after yielding of the longitudinal steel reinforcement. A straight line was fitted in all cases. Values of γ are presented in Table 4. The mean value of γ was equal to 5%.

Hysteretic parameters
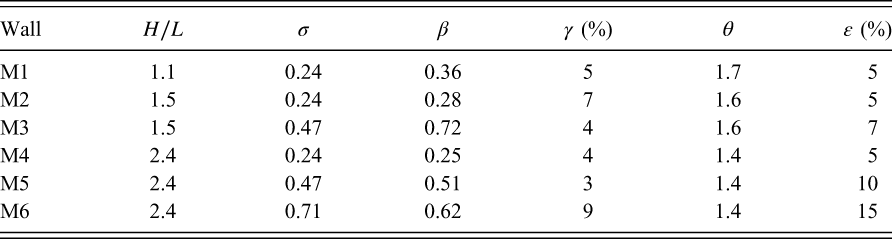
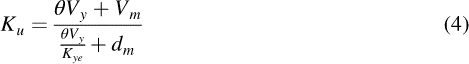
The unloading branches of the lateral load-drift ratio curves of walls were divided into two parts: an elastic unloading branch and a plastic unloading branch. The elastic part of the unloading stiffness (Ku) was defined by Equation 4. In this equation, θ is a hysteretic parameter, Vmi is the lateral force at a given load cycle, and dmi is its corresponding displacement. Values of θ were calculated for Walls M1 to M6 using the elastic unloading parts (positive and negative) of the lateral load-drift ratio curves. Degradation of the unloading stiffness (Ku) was considered by using different horizontal displacements up to the value of displacement capacity (dm; Table 2). A straight line was fitted in all cases. Values of θ are presented in Table 4. It was observed that the values of θ were similar. The average value of θ was equal to 1.5. The plastic part of the unloading stiffness was defined by the slope of the target straight line U-U′ (Figure 9). This slope (stiffness, Ku− u ) was defined as a function of the yielding stiffness (Ky; Equation 5). Values of ∊ were calculated for Walls M1 to M6 using the end points of the elastic unloading parts (positive and negative) of the lateral load-drift ratio curves. Values of ∊ are presented in Table 4. For walls with the same axial compressive stress (Walls M1, M2, and M4), the values of ∊ were the same (5%). For walls with the same aspect ratio (Walls M4 to M6), the values of ∊ increased as the axial compressive stress increased. The values of ∊ were equal to 5%, 10%, and 15%, respectively. For simplicity, pinching of the cycles was not included in the hysteretic models.

A hysteretic model was proposed for the walls with the same axial compressive stress (Walls M1, M2, and M4). The selected hysteretic parameters were β = 0.3, γ = 5%, θ = 1.6, and ∊ = 5%. Experimental and analytical lateral load-drift ratio curves of Walls M1 and M4 are presented in Figure 10. These walls had the minimum and maximum wall aspect ratio, respectively. Experimental and analytical curves are represented by solid and dashed lines, respectively. In general, a good agreement between both experimental and analytical curves up to a value of drift ratio capacity of 1% was observed (Figure 10).
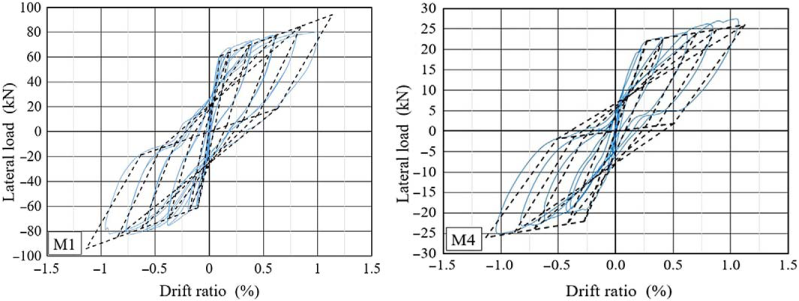
Experimental and analytical lateral load-drift ratio curves for Walls M1 and M4.
Conclusions
Six confined masonry walls with height-to-length ratios greater than 1 were tested in the laboratory under reverse cyclic lateral loads. Walls were designed to induce flexural behavior. Based on the results obtained in this work, the following conclusions are presented:
Flexural behavior of walls was characterized by yielding of the longitudinal steel reinforcement followed by vertical and diagonal cracks. Failure of walls was associated with crushing concrete at the bottom ends of vertical confining elements. As expected, the flexural strength of walls increased as the aspect ratio decreased or the axial compressive stress increased. Flexural strength of walls can be determined using flexural theory (kinematics, constitutive models, and equilibrium). The confined walls that were studied had a good deformation capacity under lateral loads. The displacement ductilities at first yielding varied from 6.06 to 14.31, and the drift ratios varied from 0.96% to 2.41%. Based on the observed minimum values, a displacement ductility capacity of 6 and a drift ratio capacity of 1% are proposed for the walls. For a displacement ductility at first yielding of 6, the normalized stiffness degradation of the wall was about 20%. For a drift ratio of 1%, the normalized stiffness degradation of walls varied from 9% to 33%. The vertical cracks observed on the walls caused a reduction in shear strength. Because of this reduction, diagonal shear cracks were observed in the walls. Vertical cracks were associated with the brick bond pattern used in construction and the nonuniform vertical deformation on the wall. A hysteretic model was calibrated to represent the flexural behavior of walls. In general, hysteretic parameters depended on the wall aspect ratio and the wall axial compressive stress. The proposed hysteretic model represented well the observed flexural behavior of Walls M1 and M4.
Footnotes
Acknowledgements
Bricks used in this study were provided by NOVACERAMIC. Former graduate students received scholarships from Consejo Nacional de Ciencia y Tecnología.