





Abstract
This paper presents a novel methodology to combine ambient vibration-based operation modal analysis with three-dimensional ground-based lidar data to study damage on the Nyatapola Temple, which is a Bhaktapur UNESCO World Heritage Site that was damaged during the 2015 Gorkha, Nepal, earthquake. The post-earthquake ambient vibration data, collected via accelerometers placed on various levels of the temple, are used to estimate the vibrational properties via operational modal analysis. These properties are then compared to the pre-earthquake dynamic characteristics collected in 2002. The lidar data provide a geometric assessment of the current condition of the temple, capturing post-earthquake drift as a function of height as well as significant cracks present in the facade. The lidar data also inform the numerical models implemented for the post-earthquake condition assessment of the temple.
Introduction
A Mw 7.8 earthquake occurred within the Gorkha district of central Nepal on 25 April 25 2015 at a focal depth of 15 km, resulting in various levels of ground shaking throughout Nepal as well as regions of India, Bhutan, Bangladesh, Tibet, and China. Significant after-shocks of Mw 6.6 and 6.7 occurred within a few days followed by a particularly strong aftershock of Mw 7.3 on 12 May 2015 (Rai et al. 2015). The earthquake resulted in heavy damage to the historic villages in the Kathmandu Valley, including Bhaktapur, an eighteenth-century Newari village. This village is home to the Bhaktapur Durbar Square Monument Zone UNESCO world heritage site, one of the most popular tourist and cultural destinations of Nepal (Lamichhane 2009).
Within Durbar Square, exists the Nyatapola Temple (Figure 1a), which is a five-tiered pagoda-style unreinforced brick masonry with mud-mortar structure completed in 1702. This temple, the tallest pagoda-style temple in Nepal, previously had survived the 1934 Nepal-Bihar earthquake; however, the topmost level collapsed and was rebuilt between 1951 and 1955. Previous research had emphasized the seismic vulnerability of pagoda-style temples (e.g., Shakya et al. 2014). In addition, Jaishi et al. (2003) characterized the Nyatapola Temple based on dynamic properties identified under ambient excitation, measured dimensions, and material properties adapted from the Indian National Building Code. These dimensions and material properties, along with the lidar survey from 2015, were used to guide the pre-earthquake dynamic characteristics of the temple.
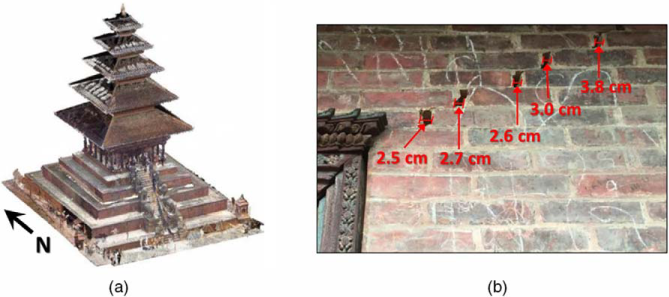
Nyatapola Temple: (a) isometric view from the plaza and (b) significant crack on the first level above the five-tiered plinth in the north wall with dimensions.
Following the 2015 event, significant cracks were observed in the masonry walls at the base level (Figure 1b). In this paper, the post-earthquake damage assessment is performed using ambient vibrations and ground-based lidar (GBL) data during June 2015. The vibration data, collected via accelerometers placed on various levels, are used to estimate the vibrational properties via operational modal analysis. The GBL data provide a geometric assessment of the current state of the temple, quantifying post-earthquake drift as a function of height and identifying significant cracks present in the facade.
Structural Details
Story heights of the approximately 22.0-meter-tall Nyatapola Temple range from approximately 3.0 m to 7.0 m. The main peculiarities of this pagoda temple in comparison to other Nepali pagodas are its considerable wall thickness, symmetrical plan, multi-tiered roof, and a five-tiered plinth height of nearly 7 m. The main lateral resisting system is the brick masonry walls varying from 2.2 m at the second level to 0.66 m at the uppermost level. Changes in wall thickness per level are achieved via heavy timber crossbeams. At the first level, above the five-tiered plinth, a walkway exists with timber columns surrounding the inner core. The temple itself only has floors at the base and first level (L1 and L2 in Figure 2a), constructed of timber planks with mud mortar. The roof structures contain symmetrical pitches that extend from the masonry core.
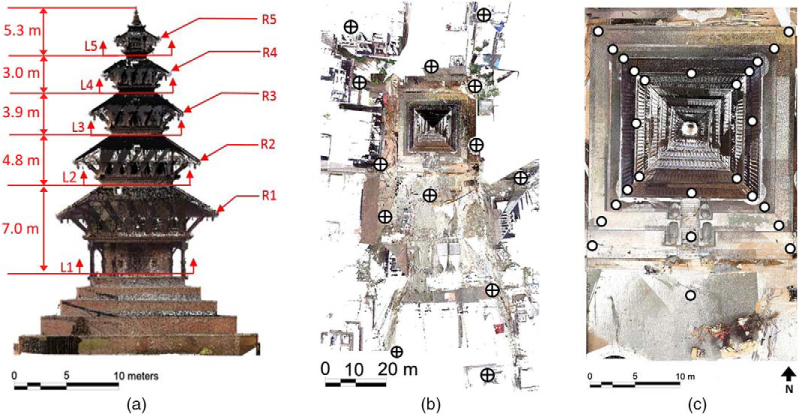
Nyatapola Temple: (a) south side view with floor level cross sections (L) and roof nomenclature (R) as well as the plan views indicating (b) Riegl scan and (c) Faro scan locations.
Gbl Data Collection
GBL technology is an efficient and cost-effective platform to collect highly accurate and resolute spatial information for objects within a scene. In the context of structural engineering applications, the spatial data collected by such platforms have been used to capture complex geometries and deformations (e.g., Wittich et al. 2016), perform detailed change or damage detection (e.g., Olsen 2015), or provide documentation following extreme events [e.g., earthquakes (Olsen and Kayen 2012) or tornadoes (Womble et al. 2016)]. GBL scanners measure distances and angles to points across the surface of surrounding objects to obtain a set of three-dimensional (3-D) vertices or point clouds. Typical GBL point clouds have subcentimeter to centimeter accuracies; however, the accuracy will vary depending on user experience, surveying strategy, equipment specifications, and environmental conditions.
The team surveyed the temple with two GBL platforms, including the Faro Focus3D X130 and Riegl VZ-400. To optimize the surveying process, the team conducted the longer range, overview scans with Riegl scanner to capture the global setting in conjunction with close, detailed scans (including overhead scans) using the Faro scanner. A total of 38 scans at various locations were collected as indicated in Figure 2b and 2c. For the Riegl scans, a combination of black and white pattern targets and cloud-to-cloud surface matching was utilized for registration with an average relative error of 0.7 cm (3-D). In addition, static GNSS coordinates were obtained for each Riegl scan placement to georeference the data into UTM coordinates (Z45 North, WGS84) with an average georeferencing error of 3.3 cm (3-D). The Faro lidar unit collected 25 detailed scans from the tiered plinth and of the base level of the structure (located at L1) within 1 m from the walls. To minimize any occlusion, no artificial targets were placed in these scans. These scans were registered to the Riegl scans using cloud-to-cloud optimization techniques, resulting in an average relative error for the unified point cloud of 1.0 cm (3-D).
Damage Characterization Using Gbl
During the earthquake sequence, the structure sustained numerous large shear diagonal cracks (up to 20 mm wide) above door openings and adjacent piers throughout its base level (Figure 1b), and being more pronounced in the north, east, and south walls in decreasing order of severity. Similarly, the interior walls experienced extensive shear cracks near timber elements and in the seam of the wall piers. Using the GBL data collected, a damage detection algorithm was implemented for the point cloud of the base level (L1) to analyze the significant cracking that was observed at this location, indicated as crack C1 in Figure 3. This algorithm identifies surface variation based on changes in the orientation of surface normal, likely indicative of surface defects. First, surface normal vectors were computed directly for each vertex (point) using an area weighted-average method (Jin et al. 2005). Then, the algorithm computes the global, best-fit reference plane to each predominately planar masonry wall. Last, the angle of deviation between each vertex normal and the global reference plane is computed through the dot product and a Kernel probability distribution of these deviation angles between each vertex and the global reference normal is constructed.
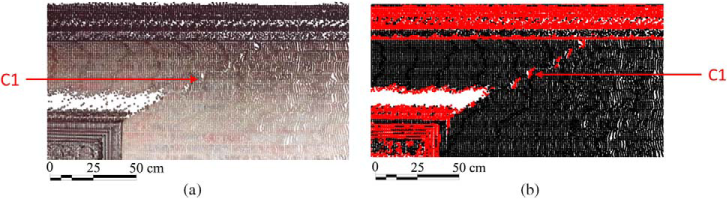
North wall crack: (a) RGB point cloud and (b) detected defects shown in red (gray).
These computations were completed for each wall. As an example, in Figure 3, significant defects (red/gray) were identified as the 55% threshold from the Kernel probability distribution function. Undamaged (or consistent) sections of the wall remain as black. Note, however, ornate architectural features are also identified through this technique and should not be interpreted as damaged. Ideally, baseline scans prior to the event would be available such that these areas could be quickly screened. At the first level, the north and east walls exhibited one significant shear crack detected from the GBL data; whereas, the west wall exhibited three significant cracks, defined as a width and length of 20 mm or larger. No discernable damage was identified on the south (entrance) wall. Corresponding attributes are computed including the length of crack (observed maximum length of 81 cm at the east wall) and width (average width along a single crack up to 3 cm at maximum). This detailed crack information and geometry is then input into the linear finite element updating process to resemble the post-earthquake damage.
Additional global assessment of the point cloud reveals a permanent clockwise torsional drift in the aftermath of the 2015 earthquake. To estimate the torsional drift profiles, a 2-cm cross section of the point cloud is extracted for each level, and best-fit lines are computed for all sides. Each cross section was examined relative to the base level cross section (just above the plinth) and quantified as a relative angle of drift (Figure 4a). Estimated residual torsional drifts consistently increase with height to a maximum value of 3.25° clockwise. Note these residual torsional drifts assume a perfectly aligned, rectangular structure prior to the earthquake, which is unlikely to be the case because of construction; however, the nonsymmetrical cracking observed likely indicates that much of this drift resulted from the earthquake.
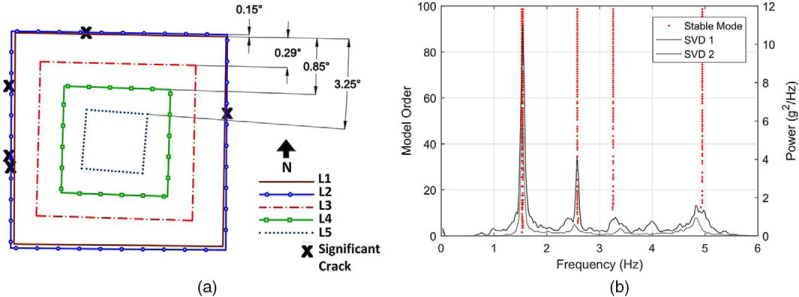
(a) Estimated torsional permanent drift profiles. (b) Stability diagram.
Damage Characterization Using Ambient Vibrations
During June 2015, the authors collected approximately 75 minutes of ambient recordings on various roof levels in three setups. The accelerometers were placed on the walls immediately above the pagoda roof overhangs by local climbers because the authors were not granted access to the elevated areas in the interior or exterior of the temple. While accelerometers were placed on the central location of each edge of the walls, data from numerous sensors were observed to be noisy because of faulty cabling and voltage spikes. To this end, only ten sensors are utilized to estimate frequencies, damping ratios, and type of modes using operational modal analysis. In the processing of vibrations, high voltage spikes were minimized using a Hampel identifier and a finite impulse response filter implemented of order 4,096 over a frequency range of 1.0 Hz to 8.0 Hz. System identification was conducted using the ARTeMIS platform and the Extended Unweighted Principal Component Analysis technique (Döhler and Mevel 2013). The first four modes were estimated as 1.507 Hz, 1.524 Hz, 2.554 Hz, and 3.262 Hz, and 1.5%, 1.9%, 1.0%, and 2.6% for frequencies and damping ratios, respectively. Figure 4b presents the stability diagram illustrating two singular-value decompositions (SVD) of the covariance matrix. The stability diagram depicts the mean values of the natural frequencies of the estimated modes with respect to selected model dimensions. SVD is a mathematical routine related to the eigenvalue solution of the covariance matrix where matrix is decomposed into its singular vectors and values. The identified modes were mainly translational (N-S and then E-W) for the first two modes and torsional for modes 3 and 4. From the pre-earthquake fundamental frequency of 1.677 Hz, a frequency shortening of nearly 11% observed and exhibited on the structure as large shear cracks at the first level above the plinth.
Linear Finite Element Model Updating
Linear finite element modeling (FEM) in SAP2000 v19.1 was implemented to quantify and understand the dynamic characteristics of the temple before and after the 2015 Gorkha earthquake via eigenvalue analyses. A macromodeling strategy is implemented where the mud-mortar masonry walls and the heavy timber beams and columns are considered as the primary structural elements. Timber joists, struts, and sloping roofs are considered as nonstructural components; hence, only their mass was considered in the analysis. The wall elements are discretized as 3-D, eight-node solid elements, whereas, the floor beams are represented using line elements. At each floor level, rigid diaphragm constrained the horizontal degrees of freedom because of the high concentration of the timber elements that compose the floors. The base of the structure was fixed, neglecting any soil-structure interaction effects as well as the dynamic response of the plinth.
The initial FEM was calibrated to represent the pre-earthquake condition in accordance with the ambient vibration studies by Jaishi et al. (2003). To tune the initial model for the fundamental mode (f pre ), Young's Modulus value for the masonry elements was iterated to reach a value of 485 MPa, which falls within the range of values suggested by Jaishi et al. (2003) and other works available in the literature (e.g., Shakya et al. 2014). Other assumed material properties include Poisson's ratios of 0.25 and 0.12 for the masonry and timber materials, respectively. In addition, the unit weight of the timber materials is set to 9 kN/m3, and a value between 18 kN/m3 and 20 kN/m3 is selected for the masonry wall because of the variation within the traditional construction process and other influencing factors in the material properties expected at the various times when the temple was built and retrofitted after the 1934 earthquake (Parajuli et al. 2010, Shakya et al. 2014).
The post-earthquake FEM linear model updating was guided by the cracks detected from the GBL analysis of the surface geometry. With knowledge of significant crack locations, damage to the integrity of the masonry units is simulated through a reduction of Young's modulus in the regions where the significant cracks were identified (Aras et al. 2011, Chen et al. 2012, Gentile and Saisi 2007). Additional damage, as evidenced via a large torsional drift, occurred in the uppermost masonry walls. The Young's modulus was reduced at various percentages up to a maximum of 25% to represent the dislodged state of the bricks and loss of grout on the fifth level. Frequencies of the post-earthquake FEM (f post ) closely resemble ambient vibrations (Figure 5). After model updating, no substantial changes were noted in the modal assurance criteria (MAC) values (0.99) for modes 1 and 2 for the simulated pre- and post-earthquake finite element models.
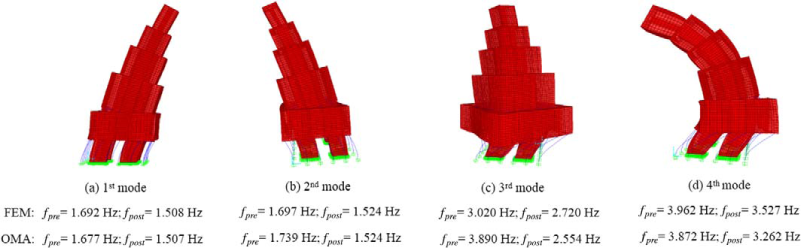
FEM frequencies and mode shapes for pre- and post-earthquake models.
Conclusions
Following the 2015 Gorkha earthquake, the authors assessed the Nyatapola Temple to understand the damage mechanisms and quantify the influence of the observed damage. Utilizing ground-based lidar and ambient vibrations, local and global damage was quantified along with modal properties, enabling construction of a high-fidelity linear finite element model. When comparing to the pre-earthquake state to the post-earthquake state, a frequency decrease of 11% was observed in the fundamental mode and notable torsional drift was identified. The substantial level of damage observed is evident through cracking in the mud-mortar masonry walls, highlighting the seismic vulnerability of these pagoda structures.
Footnotes
Acknowledgments
This work was partially supported by the University of Nebraska Foundation, NSF CMMI Award #1545632, and the Kearney Faculty Scholar funds. Supratik Bose (University at Buffalo), Patrick Burns (Oregon State University, OSU), Matthew Gillins (OSU), Matthew O'Banion (OSU), and the Bhaktapur Municipality assisted with the fieldwork or data processing. Accelerometer equipment was generously provided by Prof. Babak Moaveni (Tufts University). Leica Geosystems and David Evans and Associates provided hardware and software used in the GBL analysis at OSU.