
Abstract
Laser-induced breakdown spectroscopy (LIBS) is evaluated as a potential analytic technique for rapid screening and quality control of anti-diabetic tablets. This paper proposes a simple LIBS-based method for the quantitative analysis of two active pharmaceutical ingredients (APIs): metformin (Met) and glybenclamide (Gly). In order to quantify both APIs, chlorine (Cl) concentration was estimated by employing the Cl/Br optical emission ratio, where Br was introduced as internal standard. Calibration curves were prepared, achieving linearity higher than 99%. On the other hand, for comparison to the proposed method, an isocratic reversed-phase high-performance liquid chromatography (RP-HPLC) method was also developed for quantitative determination of the same analytes by ultraviolet (UV) detection. The chromatographic separation was achieved on a Phenomenex Hypersil C18, 250 mm X 4.6 mm, 5 μm column. The mobile phase was K2HPO4/H3PO4-CH3OH and flow rate was 1.0 mL min−1. The method is linear over a range of 10-60 μg mL−1 for Gly and 5-30 μg mL−1 for Met and the correlation coefficients were >0.99. Recoveries were found to be in the range of 95-101%. Furthermore, four different commercial brands of each active agent were evaluated by both proposed LIBS and chromatographic methods and results were compared with each other. The comparison was satisfactorily validated by analysis of variance (ANOVA).
Keywords
INTRODUCTION
Diabetes is a chronic disease that not only affects people's health but also imposes a large economic burden on individuals, families, national healthcare systems, and economies worldwide. Type 2 diabetes is characterized by high glucose concentration in the blood, which is caused by both low pancreas secretion and reduced sensitivity to insulin. Currently, there is a wide variety of oral agents clinically available to help regulate glucose levels in blood such as sulfonylureas, meglitinides, biguanides, and thiazolidinediones.1,2 Sulfonylureas, such as glybenclamide (Gly), interact with sulfonylurea receptors on pancreatic β-cells to enhance insulin secretion and decrease blood-glucose levels. On the other hand, metformin (Met), the most common biguanide clinically available, decreases hepatic glucose production and increases the sensitivity of peripheral tissues to insulin. 3 At present, the blend of Gly/Met is the oral drug combination of choice in clinical practice. 4 Nowadays more than 220 million people worldwide have diabetes and the World Health Organization (WHO) projects that diabetes deaths will double between 2005 and 2030. 5 Besides the increase of diabetes, the production of both counterfeit and low-quality drugs is increasing and this fact also affects human health and results in loss of profit to pharmaceutical industries. 6 Control of the active agent content in commercial products is important to guarantee the quality of pharmaceuticals worldwide.
Laser-induced breakdown spectroscopy (LIBS) represents a powerful atomic analytical technique because of its intrinsic characteristics such as simple pretreatment or none at all, speed, and availability of multi-elemental analysis. LIBS requires no additional chemical compounds or solvents at all, and consequently, the analysis is environmentally friendly. At present, LIBS-based analysis of food, agricultural, geological, environmental, and biomedical solid samples for macro and micro elemental determination has emerged as an important analytical field because of its viability.7,–13 LIBS is a technique based on the analysis of the optical emission of a plasma plume containing individual neutral and ionic species from elements present in a sample. In general, a pulsed laser vaporizes and excites the surface of the sample in order to produce time-dependent emission lines. Emission line intensities indicate the relative population of each species, allowing a qualitative and quantitative analysis of solid, liquid, and gaseous samples. In the pharmaceutical field, some works have shown the effectiveness of applying the LIBS technique mostly for qualitative determination of some active ingredients in solid and liquid formulations.14,–16 Quantitative analysis of pharmaceutical products has been reported using noble gas environments to produce plasma that enhances the sensitivity to halogen elements present in active pharmaceutical ingredients (APIs). 17 Lubricants, coating characterization, thickness, and uniformity of the pharmaceutical tablets have also been analyzed using LIBS.18,–20
On the other hand, chromatography is the most frequently used technique for pharmaceutical analysis, and for anti-diabetic drugs, several high-performance liquid chromatography (HPLC) methods have been reported for Met and a bit less for Gly analysis but all of them are restricted for their determination in biological fluids, which involve exhaustive and complicated solvent extraction, pre-concentration, or dilution processes.21,–30 The reported methods are strongly dependent on the sample preparation, which is a critical and the most time-consuming step, and thus, they are not economically feasible for routine analysis in pharmaceutical industries; in addition, the adverse environmental impact of these analytical methods can be reduced by minimizing the amount of solvents employed in sample pretreatment. However, the downscaling is not straightforward because this enhances the risk of errors such as incomplete analyte extraction, which manifests in poorer analytical performance.
The aim of this study was to develop new rapid, accurate, precise, economic, and environmentally friendly methods based on spectroscopic and chromatographic methods for industrial analysis of anti-diabetic active pharmaceutical ingredients, i.e., Met and Gly present in tablet formulations, by the addition of internal standards, to improve the analytical performance and thus control undetermined changes in API concentration and instrument response fluctuations, and also to reduce the problem of the many-fold dilution required in the classical batch procedures. All experiments were performed at ambient conditions. For both methods, calibration curves were obtained by plotting the ratio of analyte signal to internal standard signal as a function of analyte concentration, and for the quantitative analysis of eight different commercial anti-diabetic brands the results were compared with each other. Furthermore, excipients such as calcium carbonate (CaCO3), lactose (C12H22O11H2O), talc (3MgO 4SiO2 H2O), and starch were studied by LIBS and Raman spectroscopy to characterize them and to select an adequate excipient for synthetic sample preparation.
EXPERIMENTAL
In addition, four commercial samples for each active agent were prepared as follows: ten commercial tablets from the same box were ground and mixed in order to obtain an appropriate sampling process. Then, 400 mg of ground pharmaceutical product and 100 mg of internal standard were homogenized in ethanolic suspension, as described in the previous paragraph. Three replicates were made for all different samples (both synthetic and commercial).
Pulses at 532 nm from an Nd:YAG laser (10 ns pulse duration at 10 Hz) were used for the experiment. Pulse energy was in the range of 10 to 20 mJ. The laser pulse was focused perpendicularly on the sample surface using a bi-convex lens (50-mm focal length). Samples were held in a custom-made aluminum holder that kept a constant lens-to-sample distance over all tablets. The sample holder was mounted on an X–Y stage allowing several shots at different places on the tablet surface. Light was collected and focused into a Czerny–Turner spectrograph (Spectra Pro 500i Action Research Corp.). Then light was spectrally dispersed by a 1200 grooves/mm grating and detected by an intensified charge-coupled device (ICCD) camera (Princeton Instruments, Inc.). The 1024×256 pixel array covered a spectral window of 35 nm with central wavelength at 830 nm. The laser pulse and detection system were synchronized in order to avoid bremsstrahlung and early plasma emission. Typical delay time td and gate time tg were on the microsecond scale. The possible non-uniformities of the laser energy and heterogeneities on the sample surface were minimized by averaging ten spectra acquisitions for 50 different places on each tablet surface. For a given sample the average of 500 spectra took less than one minute, giving a single spectrum for each analyzed tablet. Repeatability was observed by analyzing each sample three times. The background continuum emission was subtracted from the line integrated intensity. Spectral correlation was performed using homemade software on the Matlab platform via the atomic spectral database from NIST. 31 Data processing and calculations were made in OriginPro software. Lorentzian fit was performed before the intensity ratio analysis.
Four different brands labeled to contain 5 mg of Gly and another four containing 500 mg of Met, all them with excipients, were used. For each brand, 10 tablets were weighed and finely powdered. In the case of Met, an accurate weight of the powder equivalent to one tablet's content was transferred into a 100 mL volumetric flask, diluted with ultrapure water, and then sonicated for 10 min. Then, a 1 mL aliquot was taken from the previous solution and centrifuged to 10 000 rpm for 10 min. Afterward, 30 μL of supernatant was used for desired dilutions with the mobile phase and triplicate 20 μL injections were made for each sample. For Gly, an accurate weight of the powder equivalent to one tablet's content was transferred into a 10 mL volumetric flask, diluted with IS solution, and then sonicated for 5 min. Later, a 1 mL aliquot was taken and centrifuged to 13 000 rpm for 5 min. Then, 300 μL of supernatant was dried by a stream of nitrogen and re-dissolved with 600 μL of methanol, and finally, this solution was sonicated for 5 min and centrifuged to 13 000 for 5 min and triplicate 20 μL injections from supernatant were made for each sample.
The experiments were carried out using a PerkinElmer series 200 liquid chromatograph equipped with an autosampler, a pump, a diode-array detector, and an oven attached to the PerkinElmer TotalChrom Workstation V 6.2.1 (PerkinElmer Instruments LLC, Shelton, Connecticut, USA) and connected to an ultraviolet-visible (UV-Vis) detector operating at 230 nm. The chromatographic separation was performed at 40 °C using a Phenomenex Hypersil C18, 250 mm X 4.6 mm, 5 μm analytical column (Waters Corp., Milford, MA). The mobile phase was K2HPO4/H3PO4 10 mM pH 3.5-CH3OH (40 + 60, v/v) at a flow rate of 1.0 mL min−1.
RESULTS AND DISCUSSION
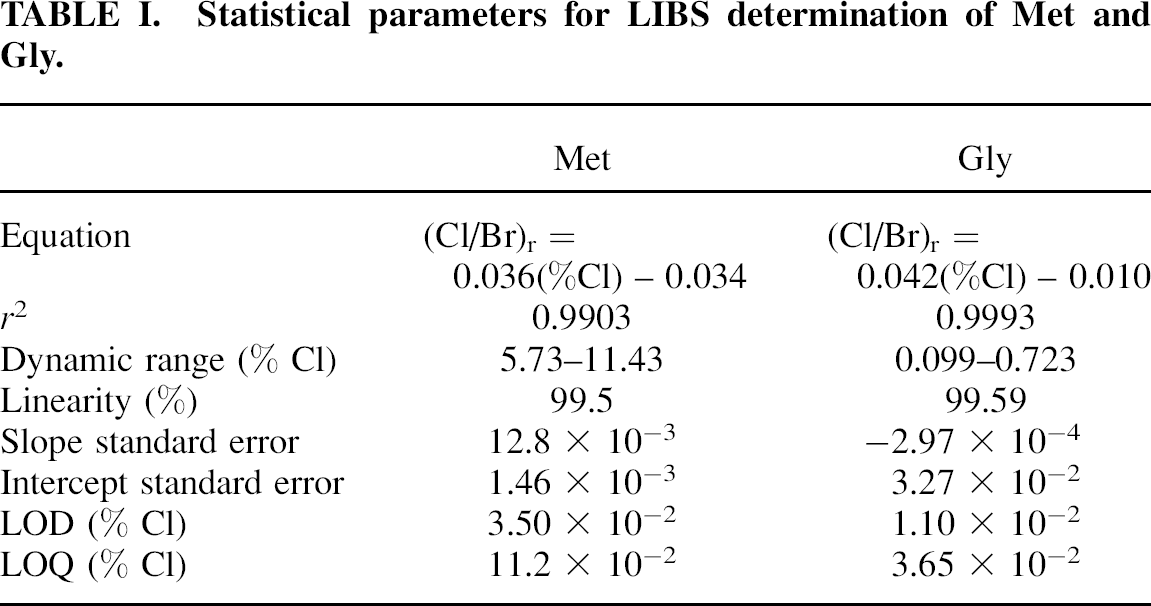
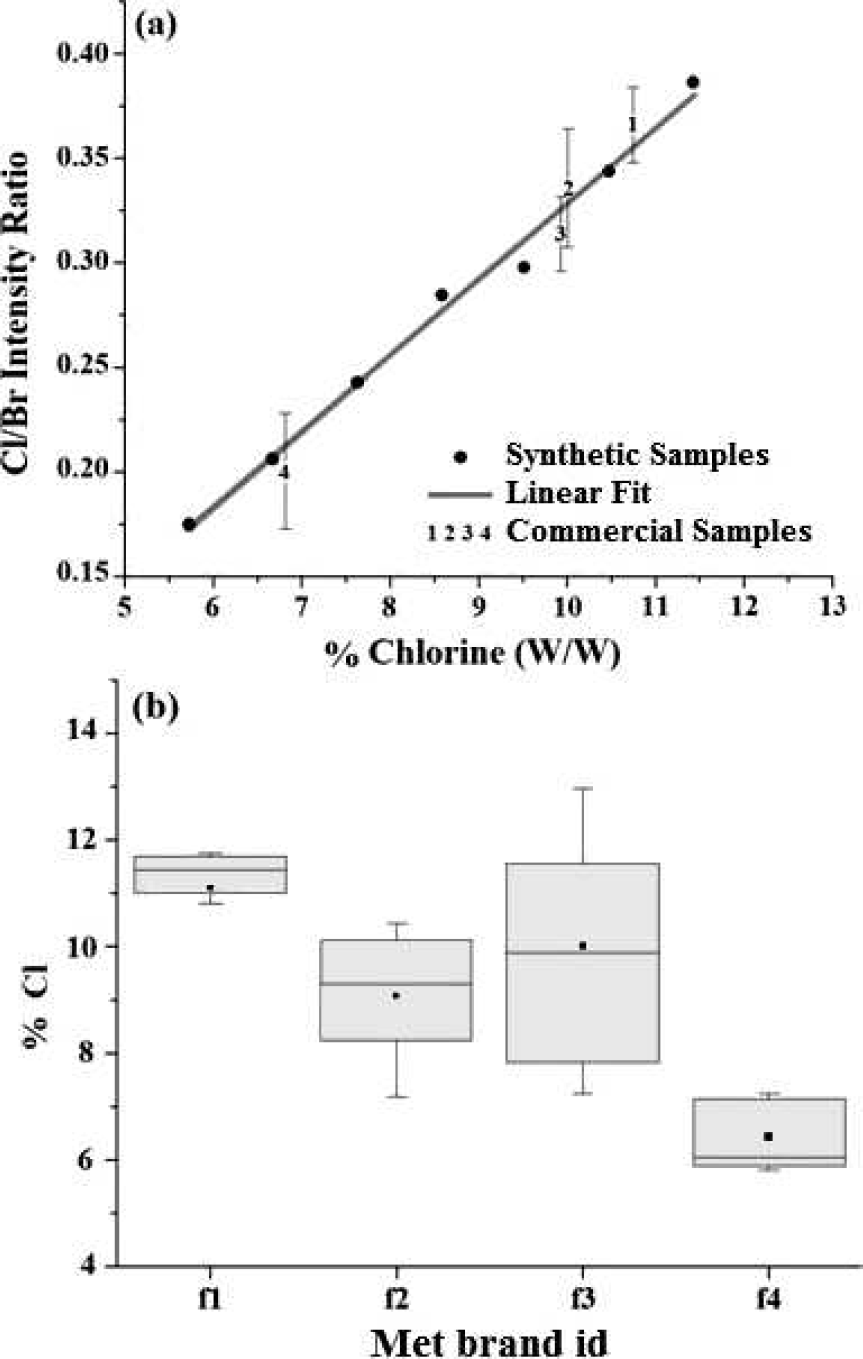
Synthetic samples may be divided in two sets depending on the target analyte used, that is: Met and Gly sets. For each set, an average calibration curve was obtained by using the Cl-Br ratio and the Cl concentration. The dynamic range of calibration curves was chosen to cover the Cl concentration from commercial samples. Statistical parameters from calibration curves are summarized in Table I. In this work, typical ranges of concentration from commercial samples lie between 6 to 11% and 0.1 to 0.2% for Met and Gly, respectively.
Statistical parameters for LIBS determination of Met and Gly.
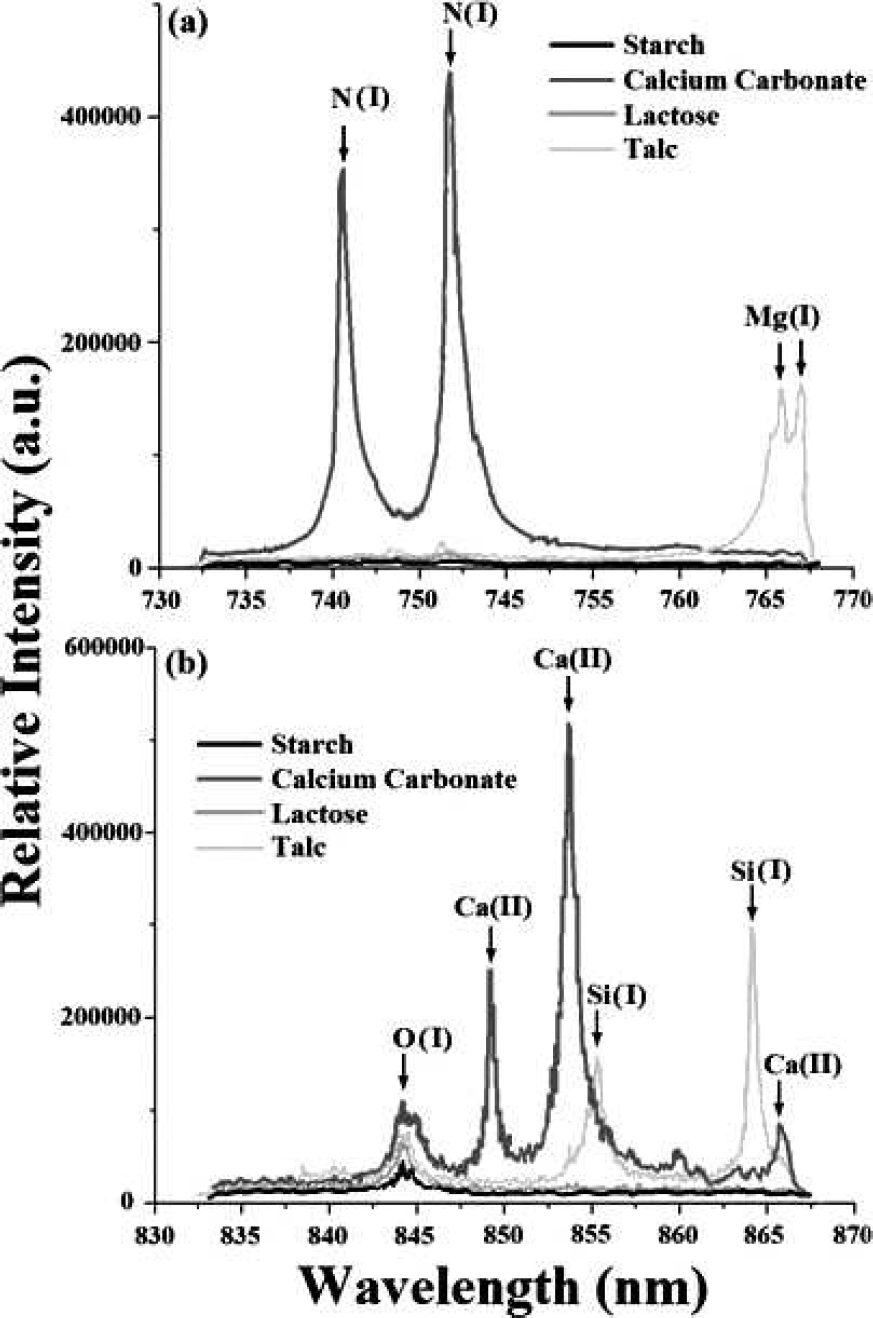
Typical excipients used in anti-diabetic tablets show spectral differences between each other over the visible–IR region. As an example, two spectral windows are shown at (
Emitted spectra from (
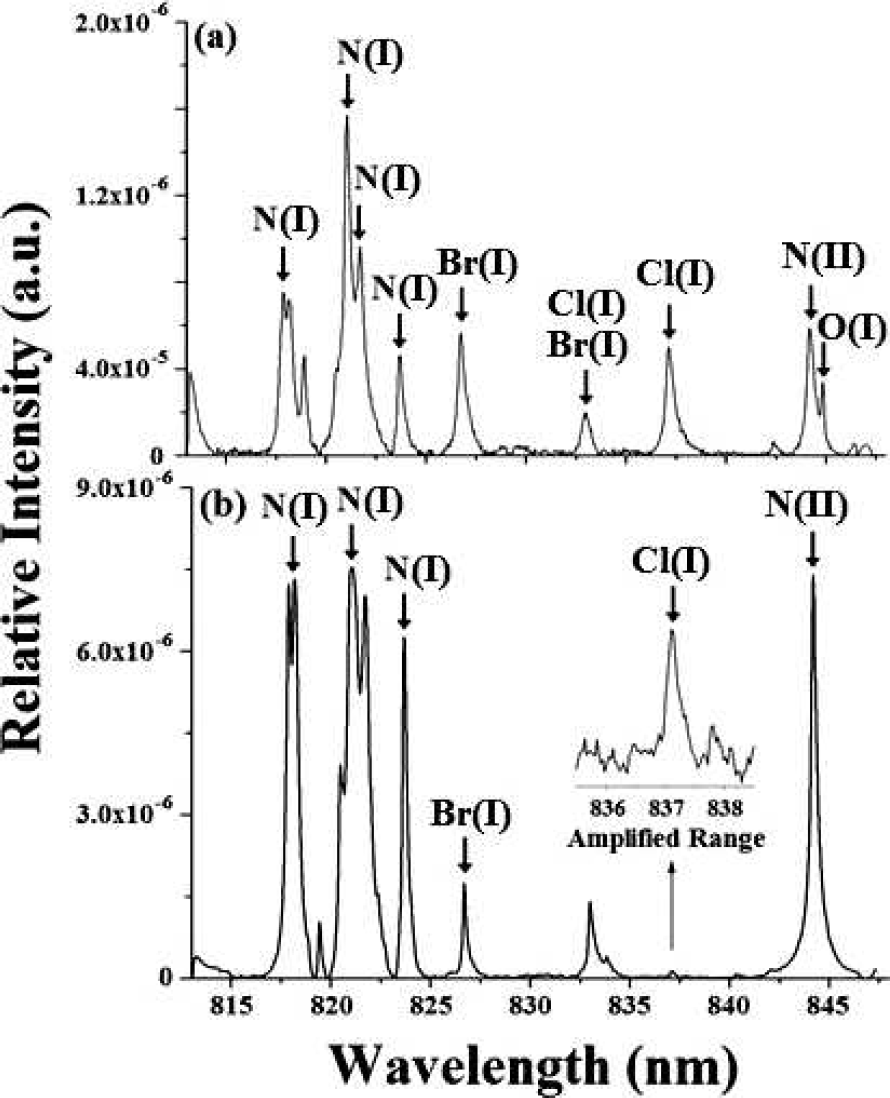
Calibration Curves and Analytical Parameters. The Cl/Br emission ratio was measured under optimum physicochemical conditions. The calibration curves were obtained for different standard samples containing between 5.73 and 11.43% for Met and between 0.09 and 0.72% for Gly. For each standard sample, three replicates were made. Statistical parameters and analytical characteristics for the determination of both Met and Gly are summarized in Table I. The calibration curves were linear for all concentrations tested. A linearity ⩾99.50% was obtained (Table I). It is worth noting that a high linearity was achieved despite the fact that halogen elements, such as Cl, are spectrally difficult to detect due to their high excitation energies (>10 eV) and neither saturation nor linear deviations were observed. With the proposed method, quantitative information for Cl can be easily obtained within the tested range. For this experiment, the optimal temporal acquisition parameters were 0.20 μs (td) and 1.00 μs (tg), producing the optimal signal-to-noise ratio (SNR).
It must be taken into account that besides the high energies necessary for Cl excitation, the Gly samples have relatively low Cl concentration. It has been shown by other authors that the sensitivity in the case of halogen elements and SNR can both be enhanced by producing the induced breakdown in a noble gas atmosphere.14,32,33 St-Onge et al. reported an improved factor of 7.3 for signal detection when they analyzed the emitted Cl line at 837.59 nm using a helium flow over pharmaceutical samples. Nevertheless, in this work, the Cl concentration in pharmaceutical samples was sufficiently high to be detected under atmospheric conditions (around *0.035% using the same line at 837.59 nm).33,34 In order to quantify the lowest content of Cl in Gly samples (*0.1 %), experimental parameters were optimized (laser pulse energy between 16 and 20 mJ per pulse, 2.0 μs tg, and 0.25 μs td) to maximize the signal-to-background ratio. With the parameters mentioned above, the achieved linearity for Gly was 99.59%.
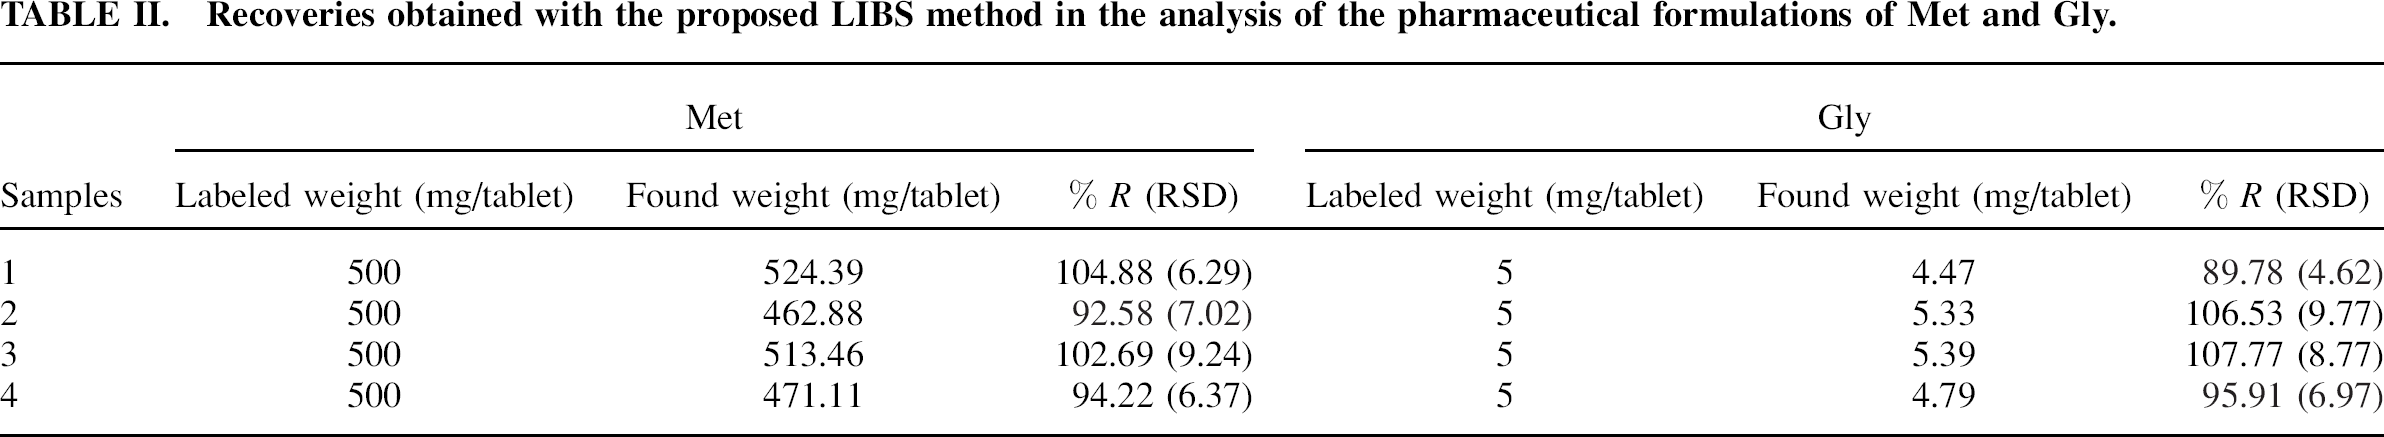
Recoveries obtained with the proposed LIBS method in the analysis of the pharmaceutical formulations of Met and Gly.
(
For the case of samples containing Gly as the active agent, typical values of Cl concentration are about 0.18% of the total mass, which corresponds to 5 mg of API over 160 mg of the total tablet mass. Figure 4a shows four commercial samples labeled from 1 to 4 and the respective calibration curve. In the case of the Gly LIBS results, no matrix effect is expected because both synthetic and commercial samples contain lactose as excipient. The four Gly brands show normal distribution and no outliers are present, as can be seen in Fig. 4b. Boxes of brands 1 and 4 are smaller because those brands present smaller standard deviations than brands 2 and 3 (Table II). Results based on LIBS and the simple preparation steps suggest the use of this method for a rapid on-line/in-situ monitoring of APIs due to their elemental composition in the pharmaceutical industry with an acceptable level of accuracy.
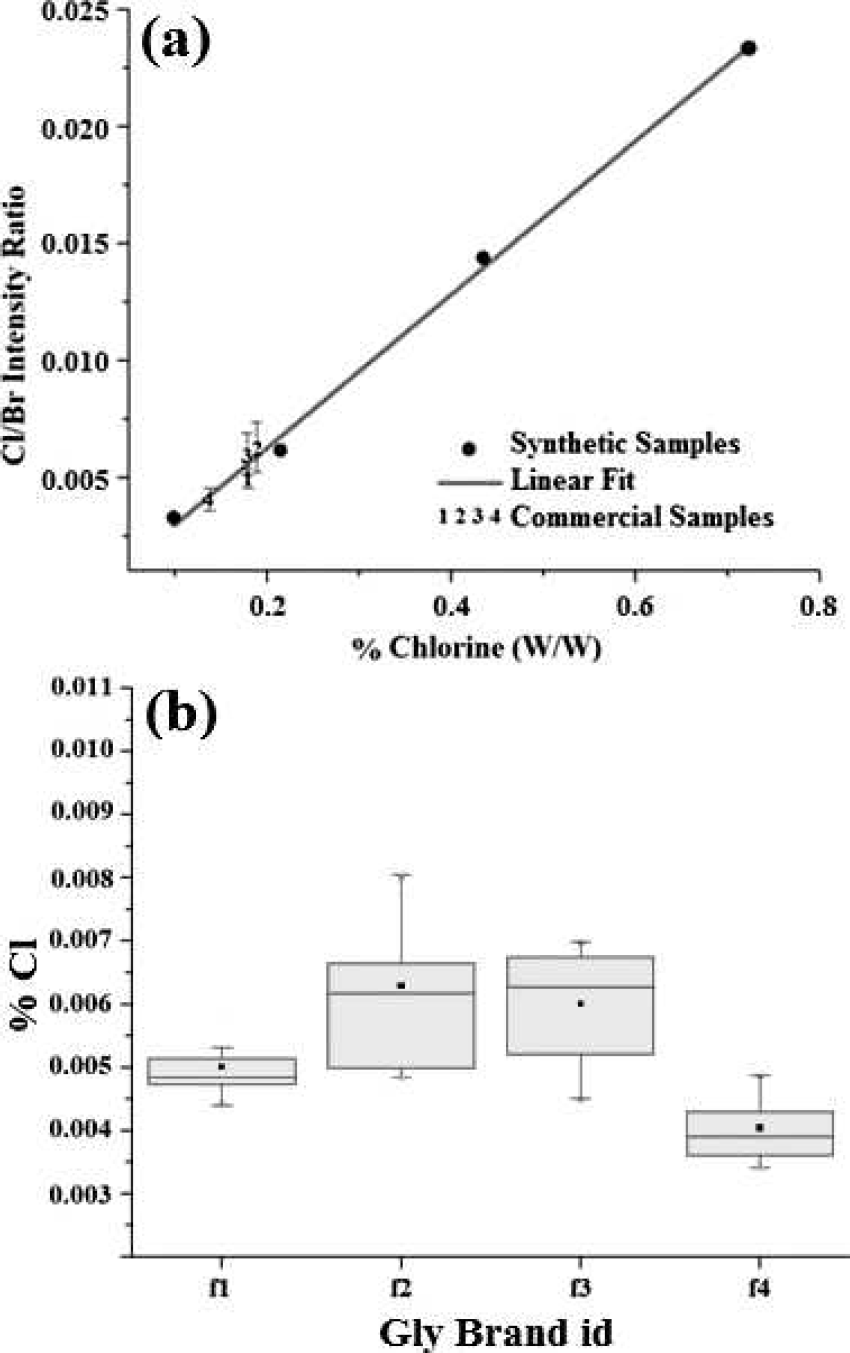
(a) Glybenclamide-containing commercial samples (1–4) are well predicted according to their respective calibration curve analysis. For the sake of clarity, only a fraction of the curve containing commercial samples is shown (*0.1–0.5%). Achieved linearity is higher than 99%. (
Statistical parameters for RP-HPLC determination of Met and Gly.
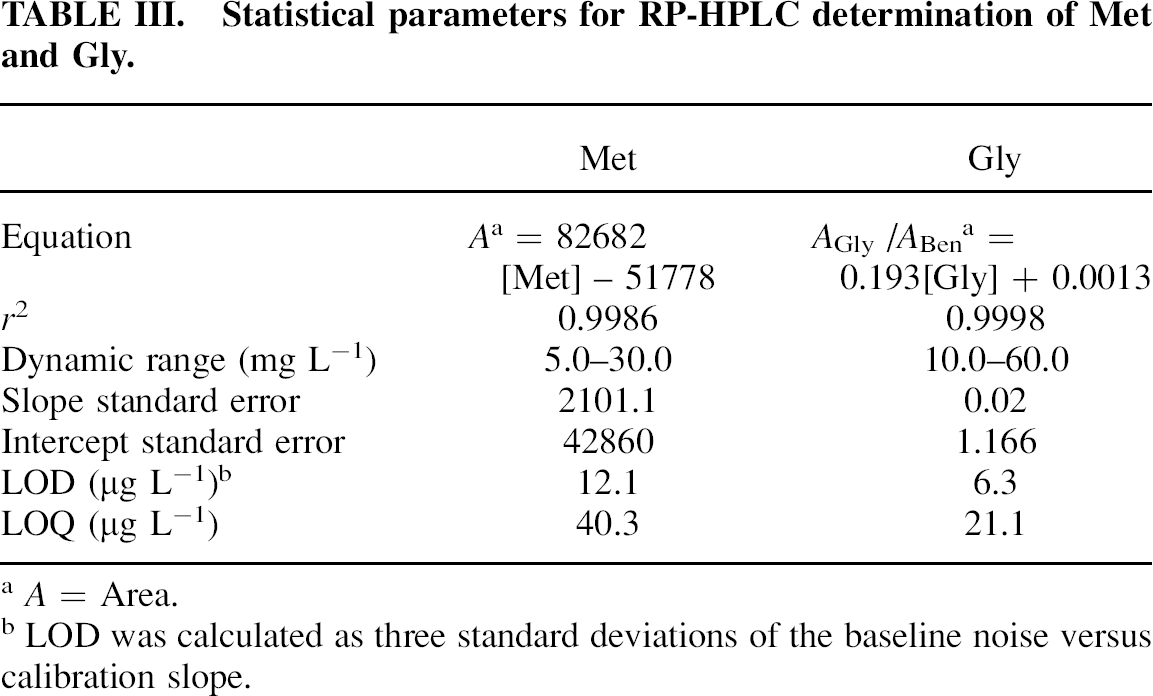
A = Area.
LOD was calculated as three standard deviations of the baseline noise versus calibration slope.
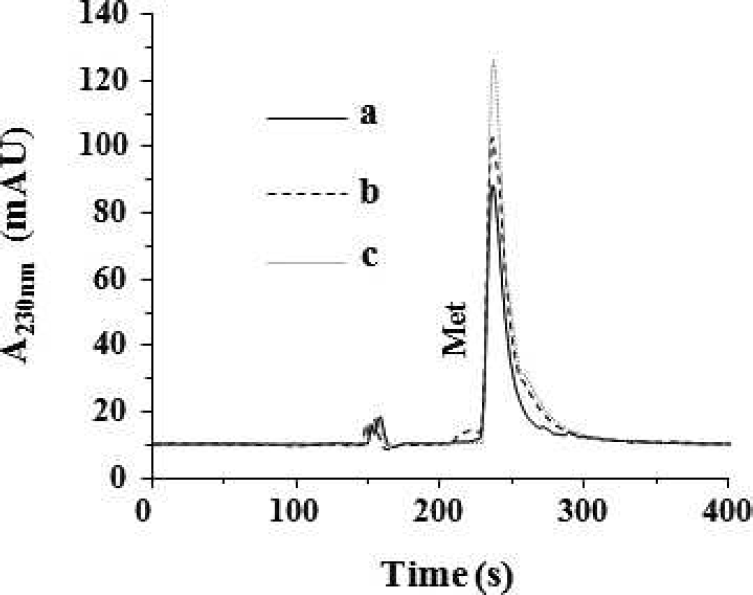
Typical chromatograms obtained from standard solutions of Met at (
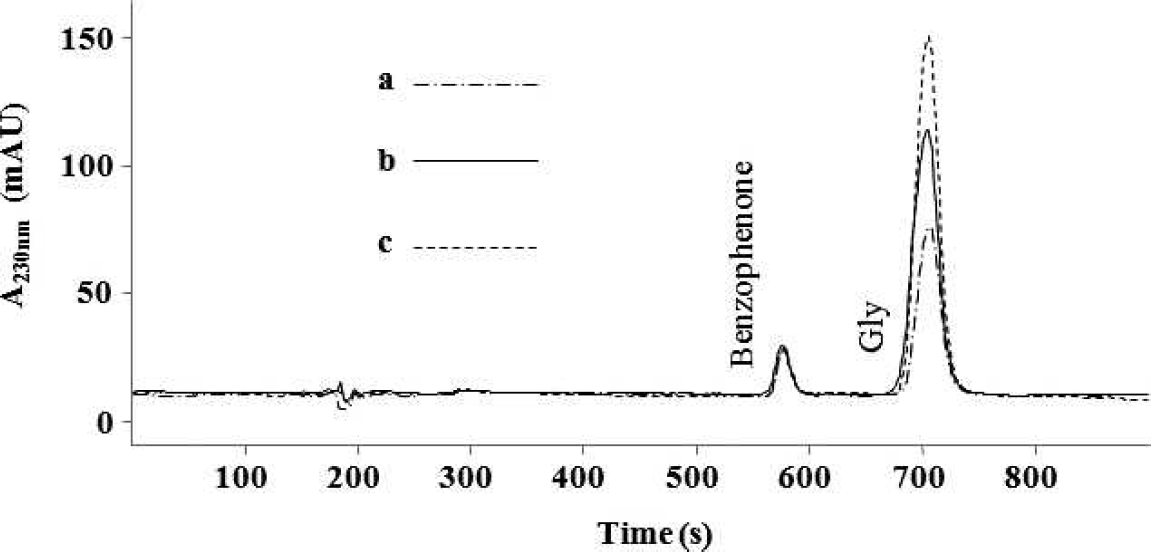
Typical chromatograms obtained from standard solutions of (
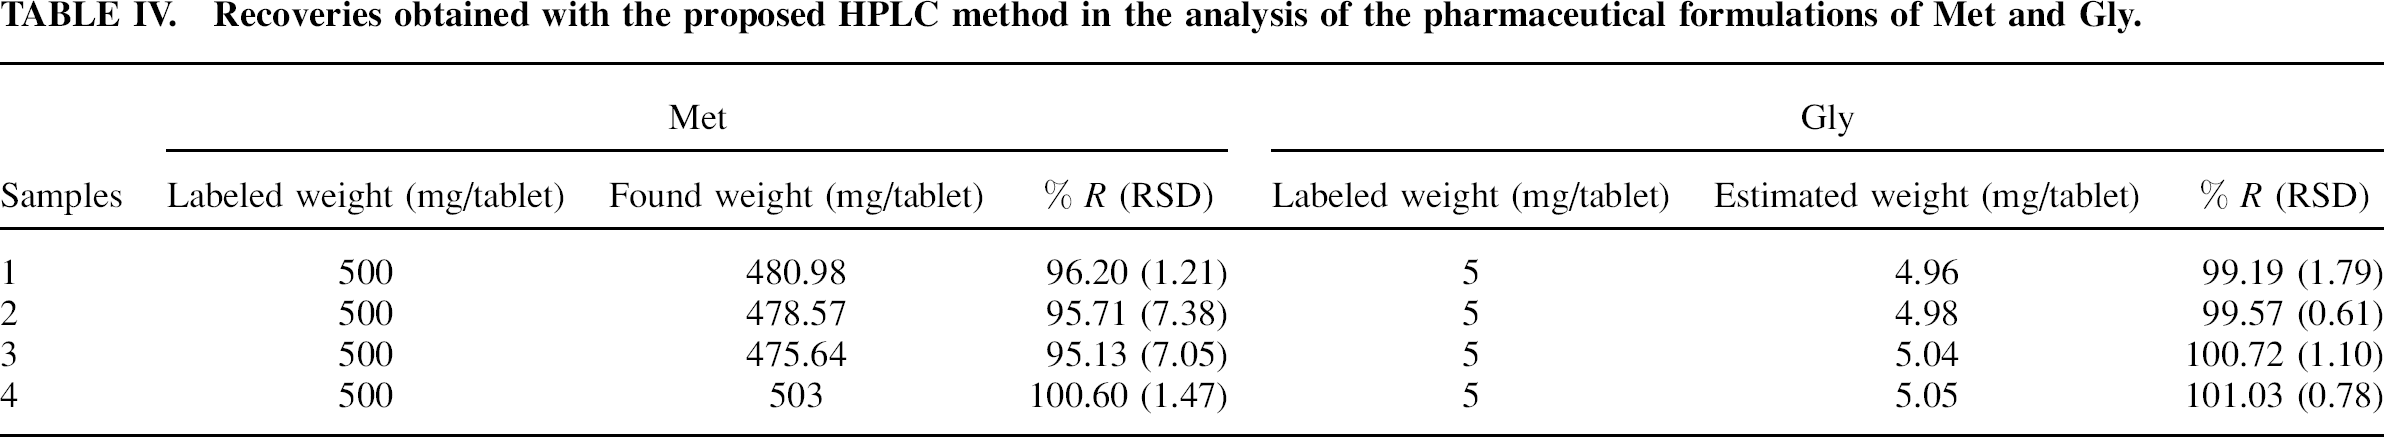
Recoveries obtained with the proposed HPLC method in the analysis of the pharmaceutical formulations of Met and Gly.
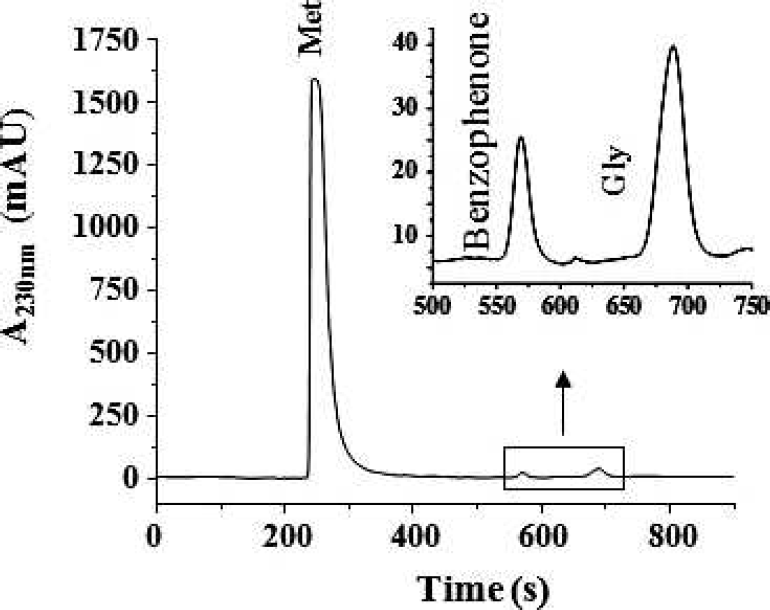
Chromatogram obtained from laboratory-prepared mixture containing 500 mg L−1 Met, 5.25 mg L−1 Gly, and 100 mg L−1 benzophenone.
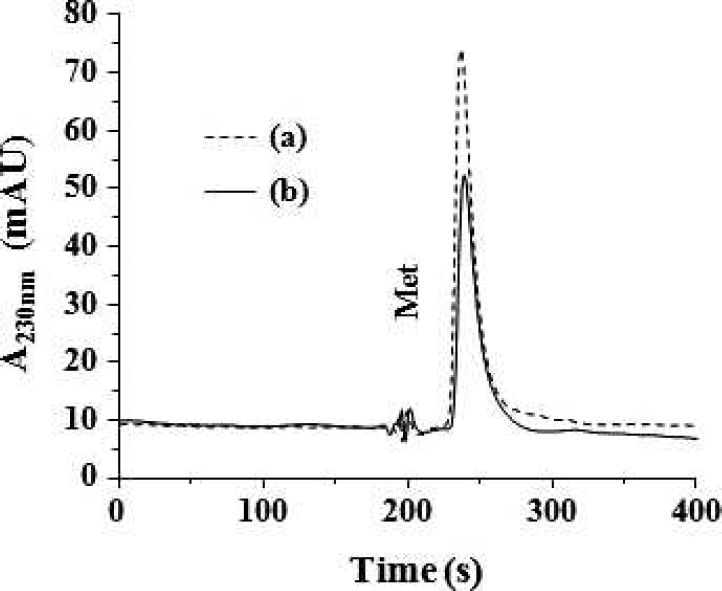
Typical HPLC chromatogram obtained from two different pharmaceutical tablets of Met: (
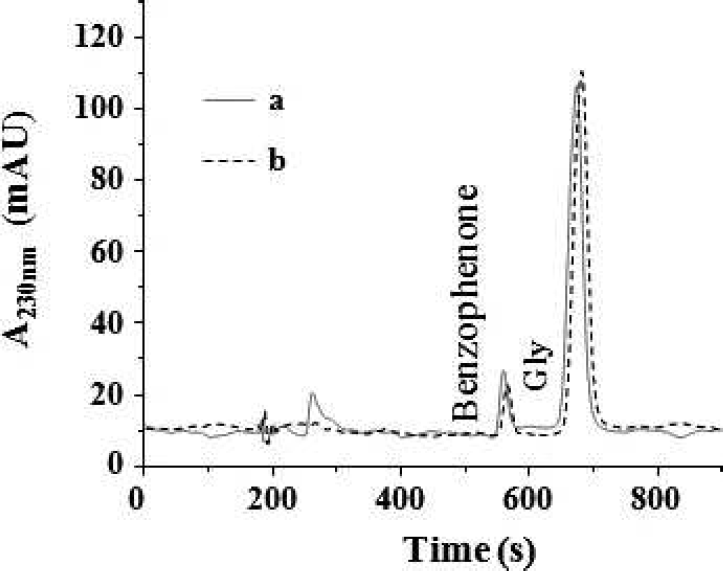
Typical HPLC chromatogram obtained from two different pharmaceutical tablets of Gly: (
CONCLUSIONS
Time- and spectral-resolved optical emissions of a pharmaceutical sample can be used to characterize its atomic composition and quantify an analyte in a faster and more practical way than conventional methods. Also, no additional chemicals are used in the proposed LIBS method, making it safe and environmentally friendly. Results obtained in this work show that the proposed LIBS method is able to quantify pharmaceutical ingredients in solid dosages by monitoring specific elements such as Cl. Results can be obtained in just a few minutes with simple sample preparation using small amounts of pharmaceutical dosage (grams). Therefore, the proposed methodology can be implemented to monitor the pharmaceutical production process in situ in real time and qualitative and quantitative analysis could be used for inspection and recognition of authenticity. On the other hand, the reported HPLC method enables the quantification of Met and Gly with superior accuracy and precision compared to the LIBS method, but it is not suitable for use as a screening method. Although the data acquisition time could be improved, avoidance of the use of expensive and environmentally harmful solvents in the mobile phase was preferred. On the other hand the extraction of Met is done only with ultrapure water. All of these HPLC procedures are relatively rapid and work without solving equations or performing separation steps. The proposed HPLC method provides good separation of Met and Gly from matrix within a relatively short analysis time. It is simple and accurate for the determination of Met and Gly in raw material and pharmaceutical formulations. The proposed methods are suitable for QC laboratories. High recovery shows that the methods are free from the interference of commonly used excipients and additives in the formulations of drugs.
Footnotes
ACKNOWLEDGMENTS
The authors acknowledge the financial support from Council of Science and Technology of the State of Guanajuato, CONCyTEG, Mexico (Project 09-04-K662-072-A02).