
Abstract
Amyloids are self-assembled protein structures implicated in a host of neurodegenerative diseases. Organisms can also produce “functional amyloids” to perpetuate life, and these materials serve as models for robust biomaterials. Amyloids are typically studied using fluorescent dyes, Fourier transform infrared (FT-IR), or Raman spectroscopy analysis of the protein amide I region, and X-ray diffraction (XRD) because the self-assembled β-sheet secondary structure of the amyloid can be easily identified with these techniques. Here, FT-IR and Raman spectroscopy analyses are described to characterize amyloid structures beyond just identification of the β-sheet structure. It has been shown that peptide mixtures can self-assemble into nanometer-sized amyloid structures that then continue to self-assemble to the micrometer scale. The resulting structures are flat tapes of low rigidity or cylinders of high rigidity depending on the peptides in the mixture. By monitoring the aggregation of peptides in solution using FT-IR spectroscopy, it is possible to identify specific amino acids implicated in β-sheet formation and higher order self-assembly. It is also possible to predict the final tape or cylinder morphology and gain insight into the structure's physical properties based on observed intermolecular interactions during the self-assembly process. Tapes and cylinders are shown to both have a similar core self-assembled β-sheet structure. Soft tapes also have weak hydrophobic interactions between alanine, isoleucine, leucine, and valine that facilitate self-assembly. Rigid cylinders have similar hydrophobic interactions that facilitate self-assembly and also have extensive hydrogen bonding between glutamines. Raman spectroscopy performed on the dried tapes and fibers shows the persistence of these interactions. The spectroscopic analyses described could be generalized to other self-assembling amyloid systems to explain property and morphological differences.
INTRODUCTION
Under certain conditions, peptides and proteins have been shown to aggregate into structures known as “amyloids.” All amyloids have one distinct feature: that the constituent peptides or proteins transform from a non-β-sheet secondary structure, i.e., random coil and/or α-helix, to a β-sheet secondary structure. There is a large body of work on the aggregation of spontaneously misfolded proteins into amyloids associated with neurodegenerative “prion” diseases such as Alzheimer's, Parkinson's, and Huntington's diseases.1,2 There is another, less studied class of amyloid in nature termed the “functional amyloid” that barnacles, bacteria, and fungi use as a method of self-preservation by facilitating attachment of the organism to a substrate or into a biofilm.3–10 It is generally accepted that any peptide or protein is capable of misfolding into an amyloid given the right conditions, which are usually denaturing.1,3,11–20 Thus, in vitro techniques can be used to mimic nature's amyloid self-assembly processes either to study prion disease progression or to design new biomaterials.21,22
Amyloids can exist as amorphous aggregates, which are random globules of self-assembled, β-structured proteins. 23 Amorphous aggregates are important to prion disease progression. 2 Amyloids can also exist as self-assembled fibrils 2–10 nm wide and >100 nm long.11,14,16,23–48 These nanometer-sized fibrils are the most studied amyloid because of relevance to prion disease progression and potential use as nanomaterials. In some instances, amyloid tapes and fibers >150 nm wide and many millimeters long have been predicted and observed.20,22,49–52 From a materials science perspective, the in vitro self-assembly of amyloid fibrils is interesting because they have a modulus similar to spider silk and a specific modulus rivaling steel.5,53–55 Amyloid fibrils can be distinguished by the fact that the protein chain axis in the β-sheet is perpendicular to the fibril axis, which can be discerned by rotating the specimen in an X-ray diffraction (XRD) or polarized infrared or Raman experiment to reference the chain axis.56–59 In contrast, native silk and β-keratin fibers containing β-sheets have the protein chain axis oriented along the fiber axis.56,59 To differentiate the two, the amyloid fibril β-sheet has been termed the “cross-β” structure. Chrysopa silk is a protein fiber with the cross-β structure.56,57,60 Protein isolated from the gland of this insect also forms the cross-β structure. However, a water swollen Chrysopa stalk will align its protein chains along the axis of deformation when stretched. 56 Other proteins have shown similar behavior. 59 Thus, silk and β-keratin proteins are aligned along the fiber axis because of the pultrusion or extrusion deformation, respectively, required for fiber formation. 61
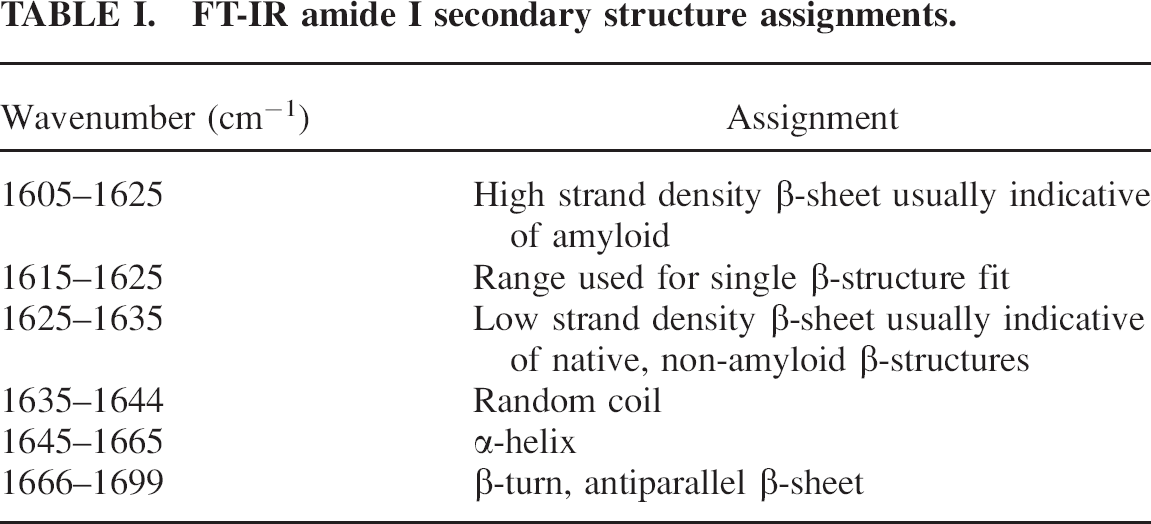
A number of techniques have been employed to study amyloid structures. In disease pathology, dyes such as Thioflavin-T, Thioflavin-S, and Congo Red have been used because they specifically bind to available hydrogen bonding sites inside β-sheets.33,62,63 Once the dyes bind they are excited with a laser of a designated wavelength and fluoresce to reveal amyloid structures in vivo and in vitro.64,65 However, this technique only reveals the presence of aggregated β-structures and their location, which is advantageous in identifying disease pathology. More complete analysis of the amyloid structure can be performed using XRD, especially on fibrils with preferential molecular orientation.11,56,57,59,60,66,67 Unfortunately, XRD is not very convenient. Using Fourier transform infrared (FT-IR) spectroscopy, protein secondary structure can be determined by studying the amide I absorbance, which is much more convenient and, when done correctly, can be quite powerful. 68 The protein amide I absorbance describes the state of the carbonyl in the peptide bond.69,70 The position of the amide I absorbance has been shown to correspond to the different protein secondary structures, which are summarized in Table I.59,71–75 These assignments have been confirmed with XRD and circular dichroism (CD).66,67,76–78 Amyloid formation can be characterized by a shift in the amide I absorbance from the random coil and/or α-helix conformation to the β-sheet conformation, which is a shift to lower wavenumber. 11 Although not absolute, on average, the amide I position appears at lower wavenumber for amyloids (∼1615 cm−1) than for native β-sheets (∼1630 cm−1).79,80 The difference does not arise from the amount of β-sheet or the ratio of antiparallel to parallel β-sheet, but differences in the β-sheet twist angle and number of protein chains or “strands” per β-sheet.55,81 The lower wavenumber position of amide I for amyloids originates in lower β-sheet twist angle and more strands per β-sheet. 79 Secondary structure can also be analyzed using Raman spectroscopy. Assignments are similar to those found with FT-IR except for the β-sheet, which appears at a Raman shift of ∼1670 cm−1.82–87 Explicit information about the β-sheet amyloid core has been obtained using deep ultraviolet resonance Raman (DUVRR) spectroscopy. 88 Hydrogen–deuterium exchange DUVRR can isolate the β-sheet core, which will not have an easy exchange, from chemical groups outside of the β-sheet that can readily exchange. 89 The same technique showed the influence of peptide amino acid sequence on the core amyloid β-sheet structure. 90 Aβ34–42 and Aβ1–40 are peptides important in Alzheimer's disease. Aβ34–42 fibrils had an antiparallel β-sheet structure similar to globular proteins, while Aβ1–40 had a parallel β-sheet structure significantly different from globular proteins. 91
FT-IR amide I secondary structure assignments.
Recent research shows that it is possible to spontaneously self-assemble micrometer-sized amyloid fibers from (1) tryptic hydrolysates of wheat gluten (WG) and (2) a mixture of trypsin-hydrolyzed gliadin and unhydrolyzed myoglobin (Gd:My).21,22,65 WG is a combination of gliadin and glutenin proteins, and the peptides produced from hydrolysis self-assemble into cylindrical fibers of high modulus. Replacing the hydrolyzed glutenin fraction with unhydrolyzed myoglobin results in rectangular tapes of low modulus. By themselves, the glutenin peptides and myoglobin protein do not self-assemble. The morphological and property differences result from amino acid sequence differences that manifest during aggregation in solution and upon drying. Here, FT-IR and Raman spectroscopy analysis techniques are described that highlight the amino acid differences that influence aggregation and final fiber morphological differences. These systems were chosen because they are able to spontaneously assemble into micrometer-sized amyloid fibers at near physiological conditions,21,22,65 which is 1–3 orders of magnitude greater than previous reports.5,19,40–42,52,54,55 Furthermore, these spectroscopic methods are capable of discerning the role of different amino acids in the self-assembling peptide mixtures and their contributions that affect the final fiber morphology and modulus. Thus, thorough observation of amyloid formation is possible over many orders of magnitude of scale, including the small scales relevant to disease pathology and the large scales important in “functional” amyloids. The techniques would prove useful to those working in the field of amyloid formation and prion disease, which would better highlight protein features important in β-sheet aggregation.
EXPERIMENTAL
RESULTS AND DISCUSSION
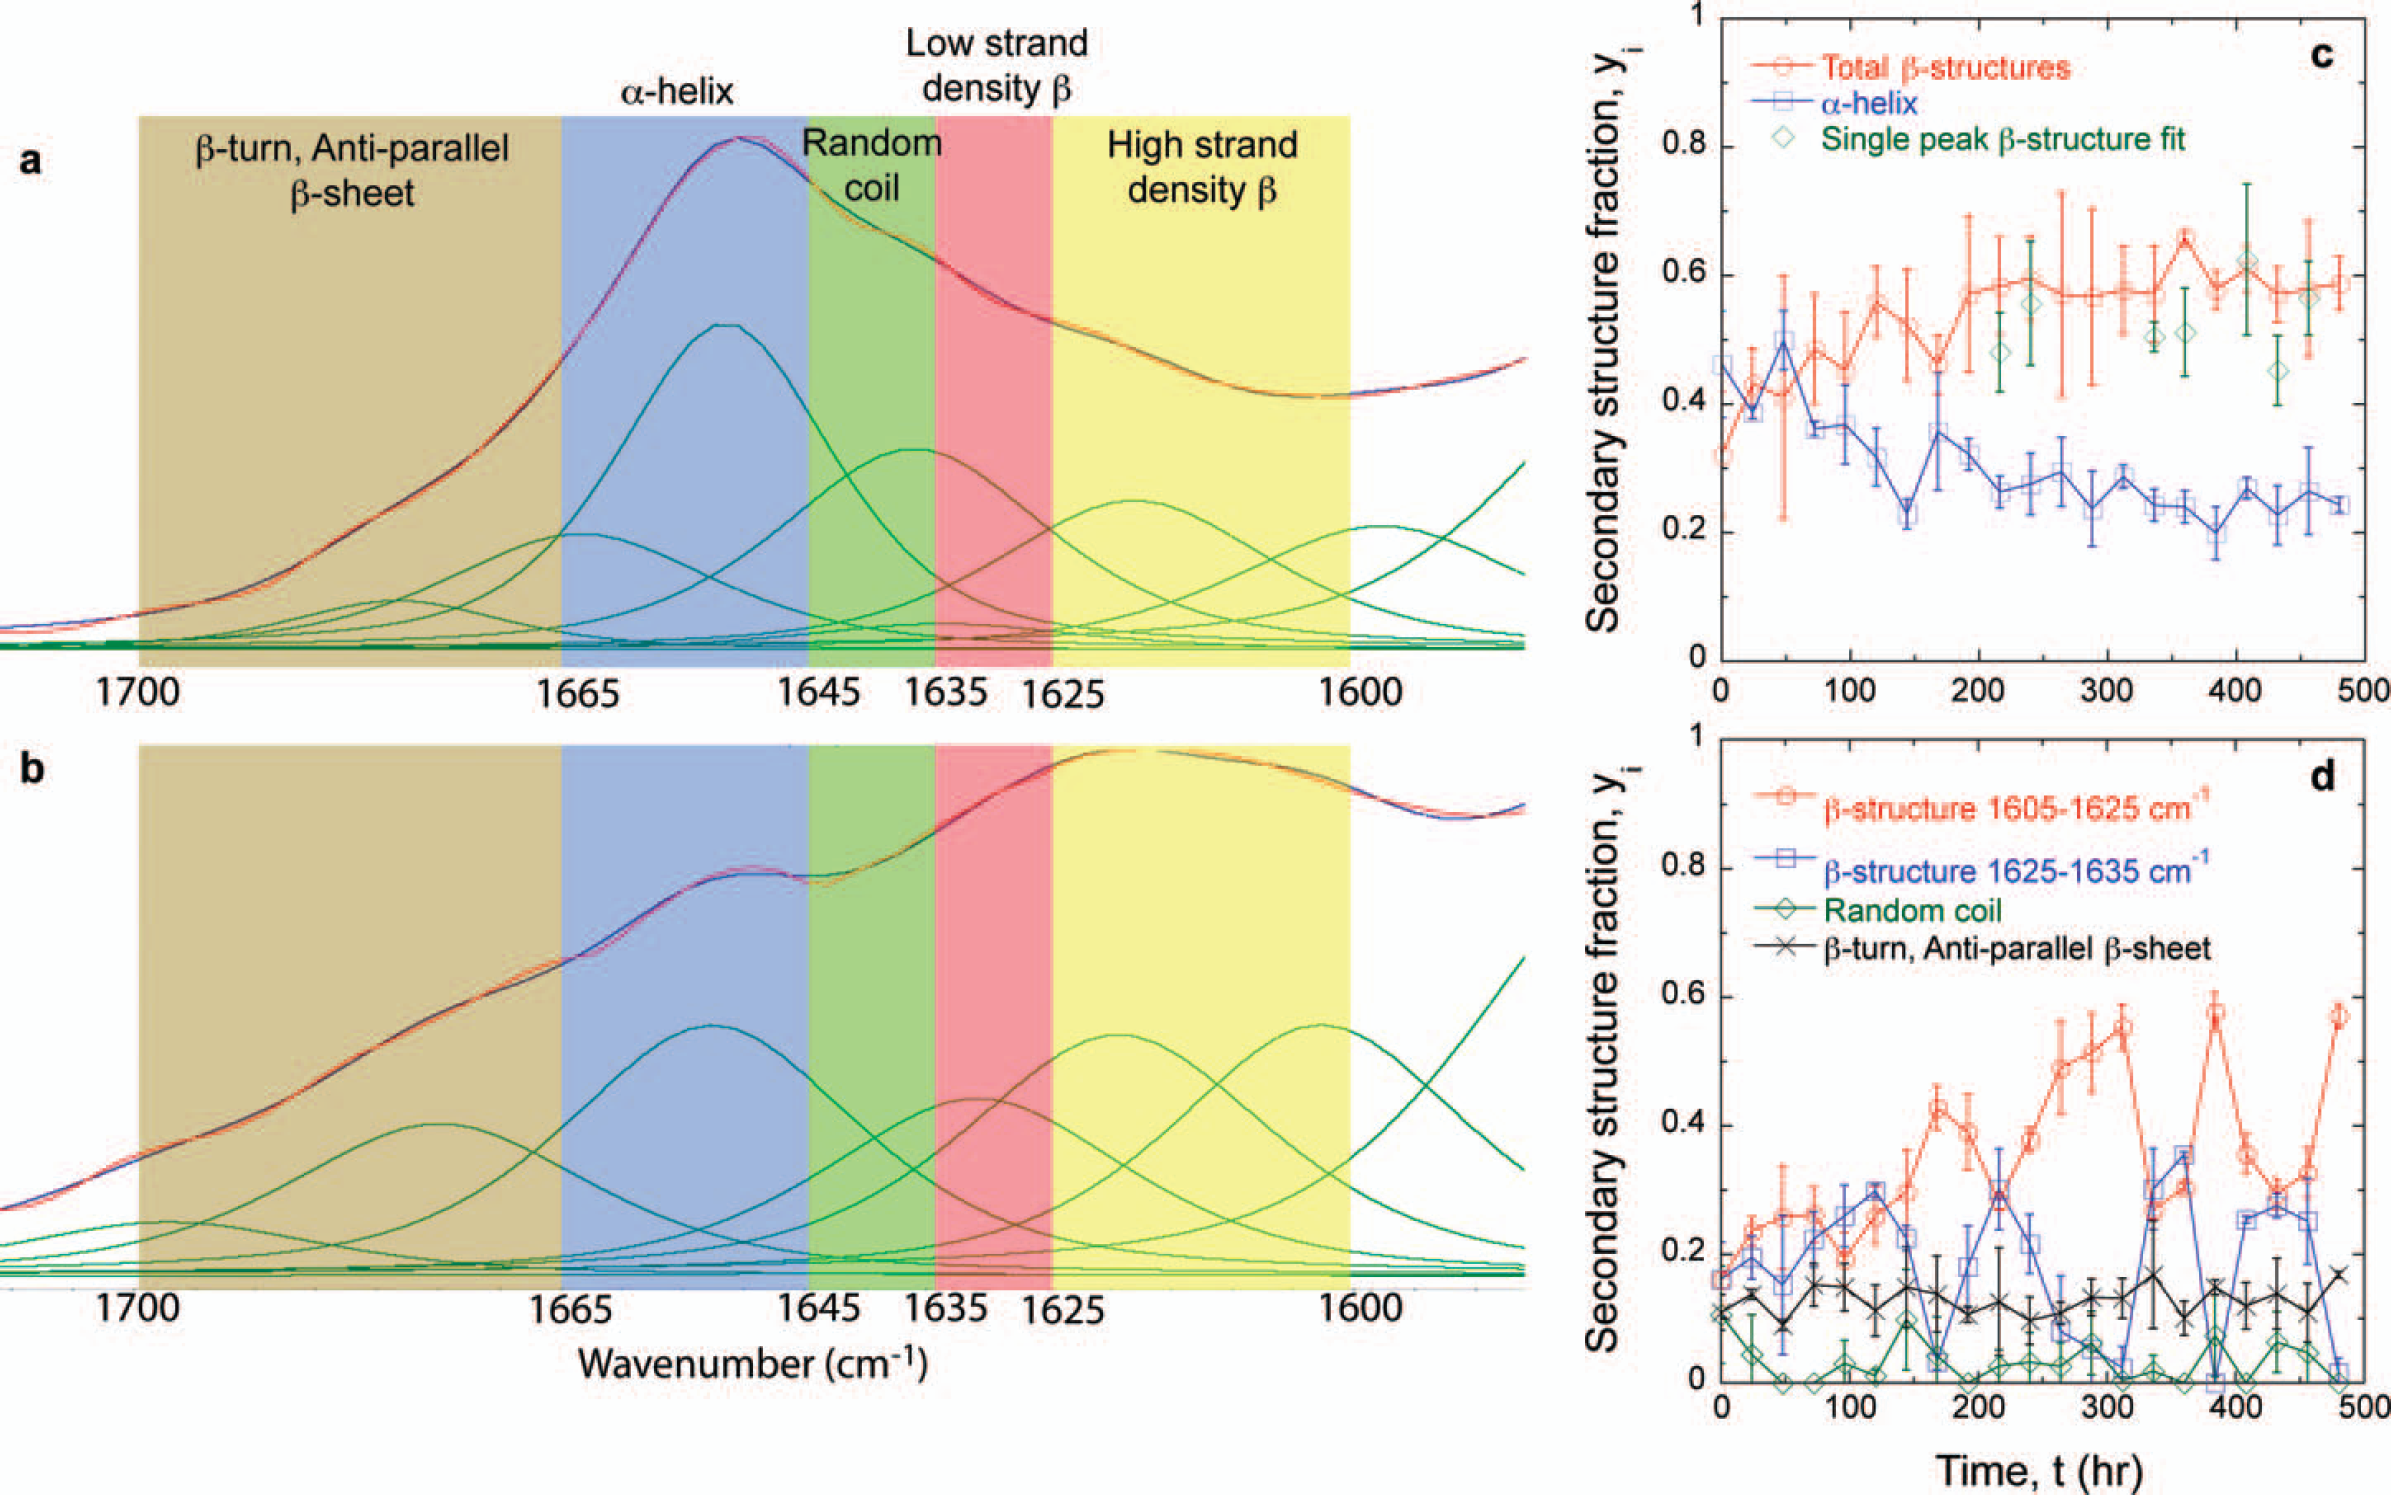
Gd:My amide I absorbance represented as a sum of Gaussian/Lorentzian peaks (green curves) at (

where
The amide I absorbance primarily originates from the peptide bond carbonyl stretch, ν(C=O) and is commonly used to assign protein secondary structure. 68 As shown above, the overwhelming majority of studies on proteins, and specifically protein aggregation, have involved analysis of the amide I absorbance. However, FT-IR spectroscopy gives information about the state of other chemical groups in proteins and may help to delineate amino acids important in amyloid formation. Part of the problem may originate in a lack of meaningful literature data assigning absorbances to specific amino acid side chains in the region below 1500 cm−1. 107 For WG and Gd:My mixtures, it is also observed that the 1360 cm−1 absorbance progressively increases relative to the 1410 cm−1 absorbance (Figs. 2a, 2b). The 1360 cm−1 absorbance can be assigned to the CH3 symmetric deformation, δs(CH3), and the 1410 cm−1 absorbance to the asymmetric CH3 deformation, δas(CH3), on the side groups of the hydrophobic amino acids alanine (A), isoleucine (I), leucine (L), and valine (V) also summarized in Table II.69,108,109 A, I, L, and V are predominant in the α-helices of WG peptides and myoglobin according to secondary structure predictions using PSIPRED.107,108,110 Considering δs(CH3) as a measure of up and down movement and δas(CH3) as a measure of side to side movement of the CH3 amino acid side groups, the increase in the ratio δs(CH3)/δas(CH3) indicates that A, I, L, and V side groups are laterally constrained in the amyloid structure because they are more able to vibrate up and down relative to side to side (Fig. 2c). Previous reports support this conclusion.21,65 This would indicate that hydrophobic interactions are an important driving force in protein conformation change and amyloid formation.
FT-IR absorbance assignments for amino acid side groups.
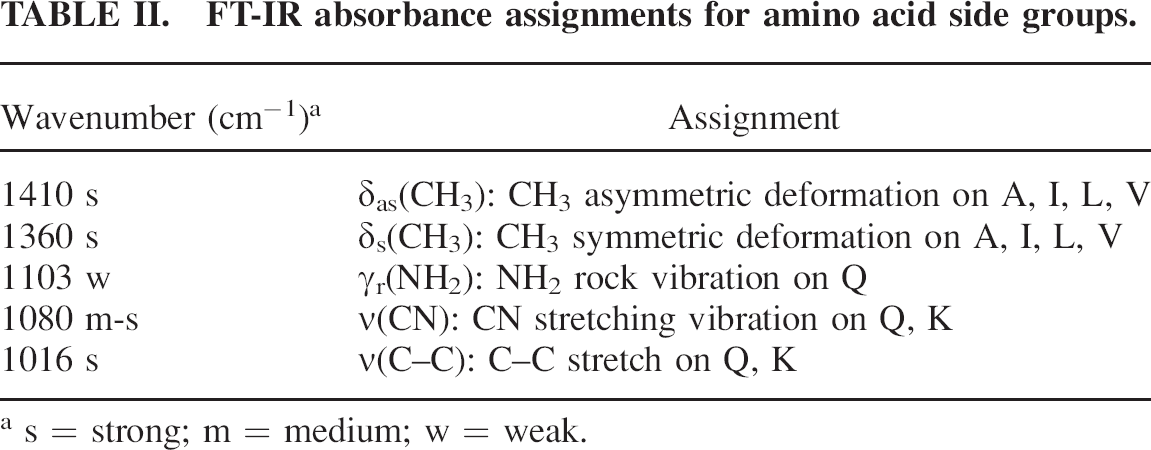
s = strong; m = medium; w = weak.
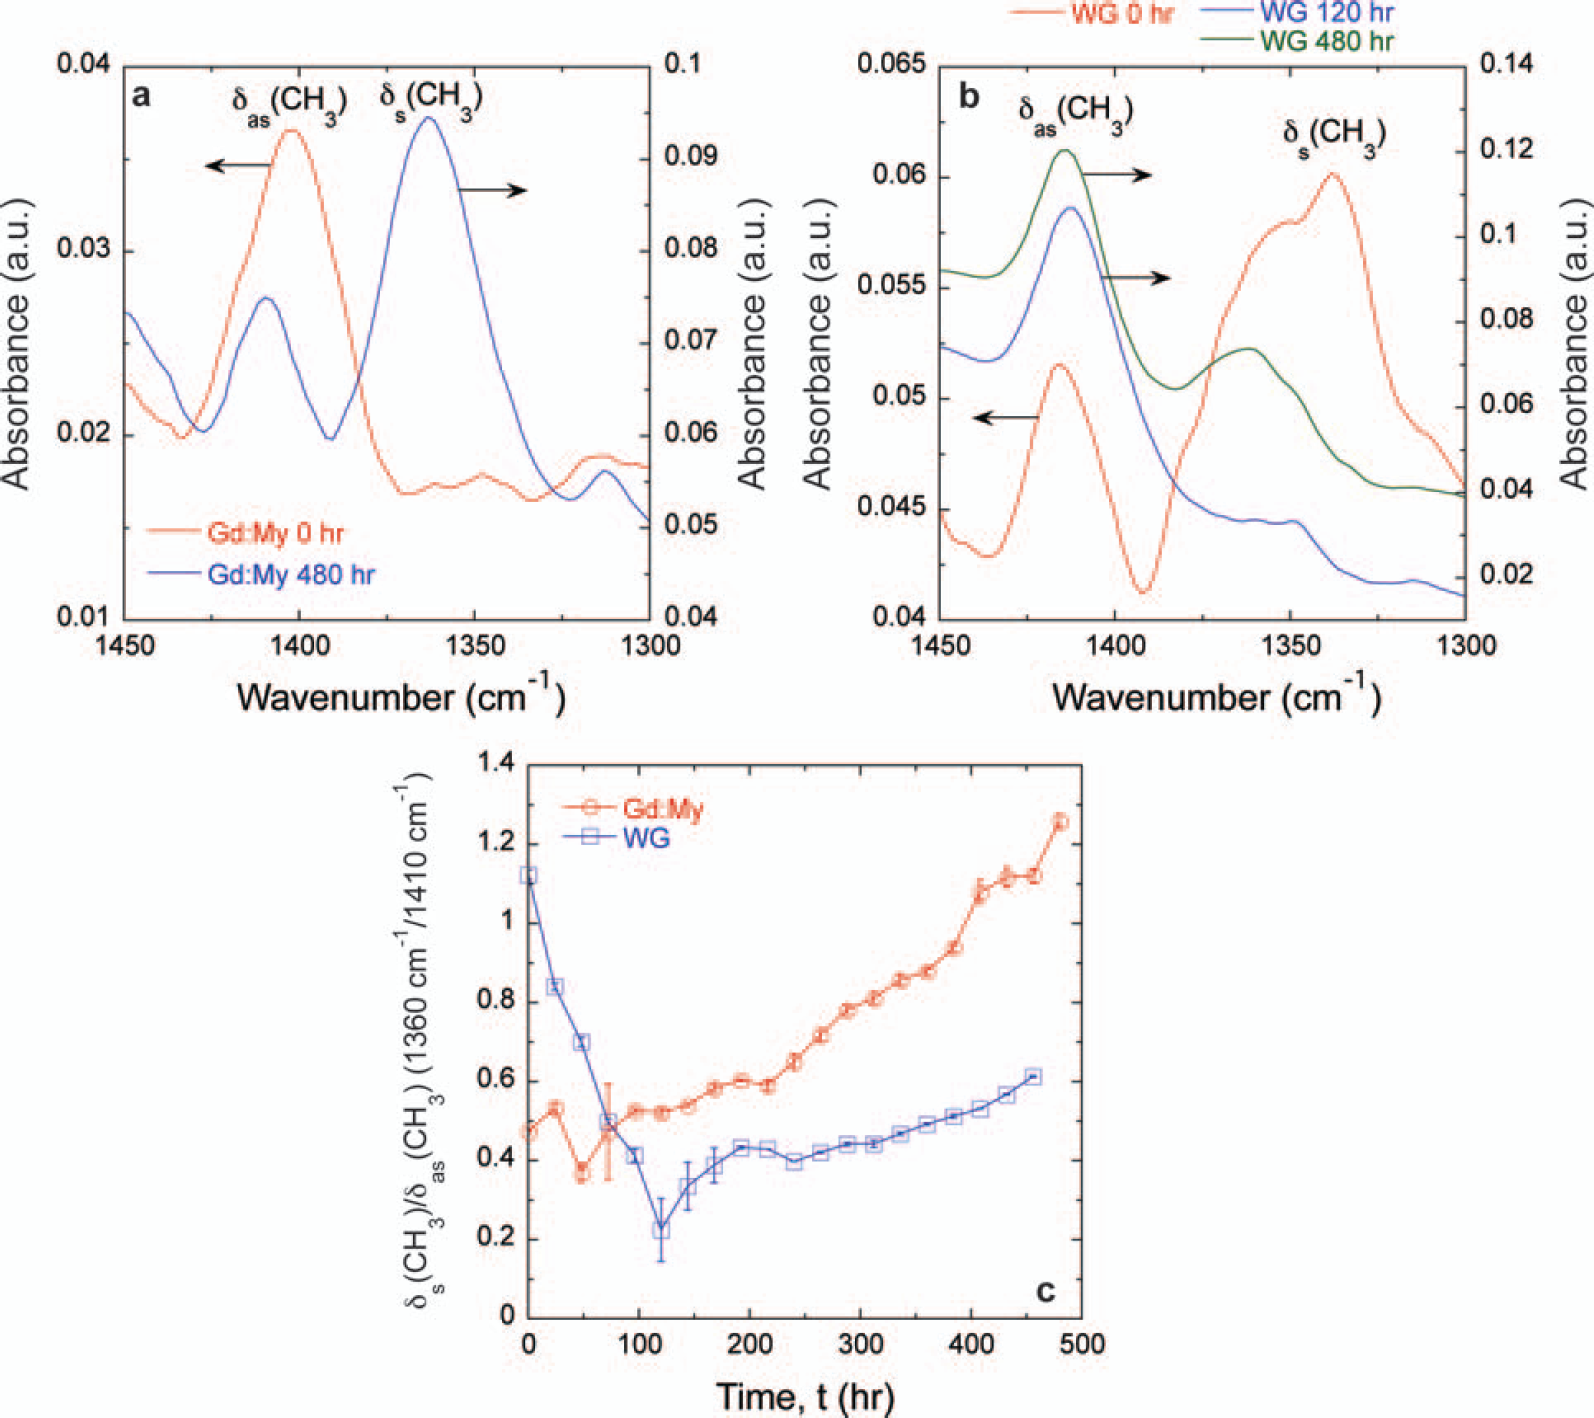
Spectra of (
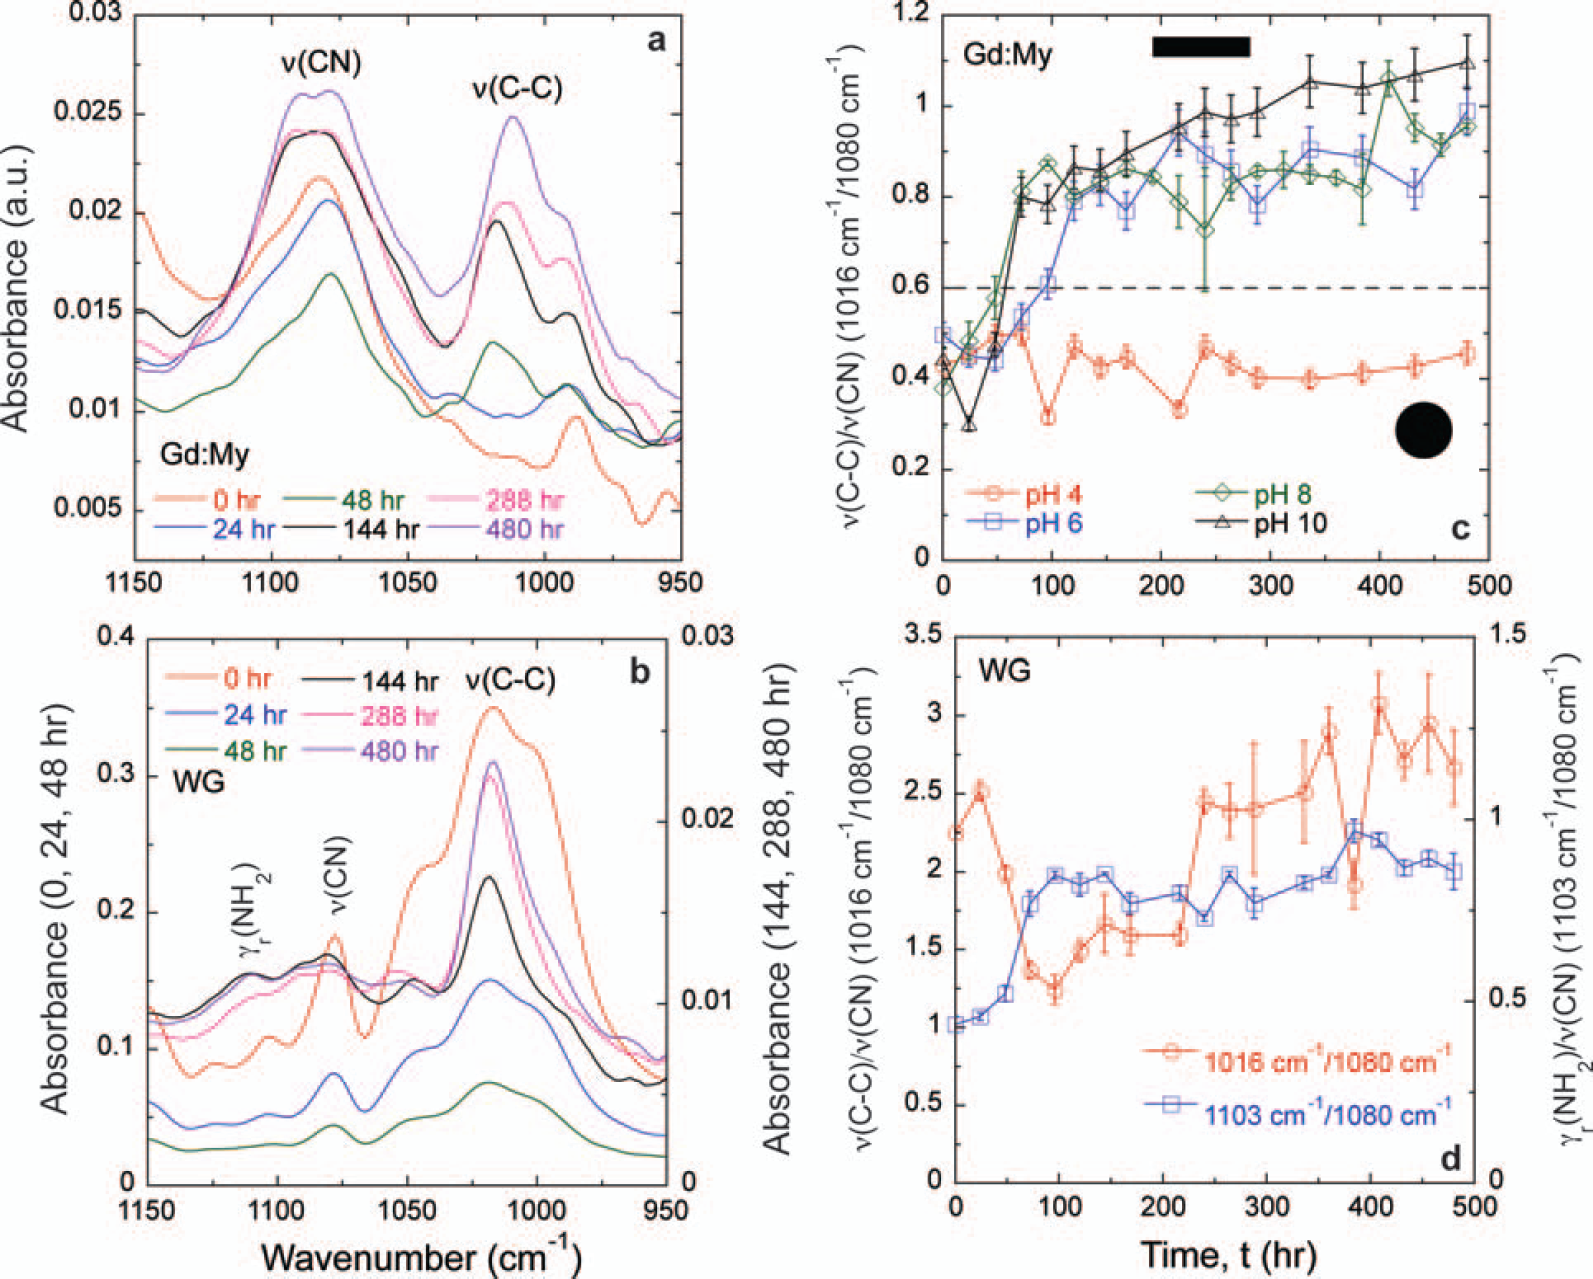
While WG and Gd:My systems both display a core aggregated β-sheet amyloid structure and hydrophobic interactions, there are structural differences in their full self-assembled structures that need to be explored. 65 At pH 8 and 37 °C, WG results in 10–20 μm diameter cylindrical fibers, whereas Gd:My results in 10–20 μm wide and 5 μm thick rectangular tapes. 65 Amyloid fibrils of tape and twisted tape morphologies have also been observed.41,42,44,52 This raises the question of whether there are other amino acid contributions that can differentiate self-assembled protein structures. The FT-IR spectrum reveals changes in the 950–1150 cm−1 region (Figs. 3a, 3b). The absorbance around 1080 cm−1 can be assigned to the CN stretching absorbance, ν(CN), and the absorbance around 1016 cm−1 can be assigned to the C–C stretching absorbance, ν(C–C), both on amino acid side chains.108,109 Rocking of NH2, γr(NH2), can be assigned around 1103 cm−1 (Figs. 3a, 3b). 108 These assignments have also been shown in the Raman spectrum, 111 and the similarities between the Raman and FT-IR spectra for amino acids have been directly shown. 112 Gd:My mixtures of the same molar ratio have been studied under various solution conditions, and the ratio ν(C–C)/ν(CN) could differentiate the final morphology of the amyloid structure early in the self-assembly process (Fig. 3c). 21 Rectangular cross-section tapes show an increase in ν(C–C)/ν(CN) before reaching an asymptote of 0.8–1. Twisted Gd:My tapes, some twisted so tightly that they result in a cylindrical cross-section, show an approximately constant, low value of ν(C–C)/ν(CN) = 0.4. On the other hand, the ratio ν(C–C)/ν(CN) for WG at pH 8 and 37 °C oscillates between 1.5 and 3 over all time and results in a cylindrical fiber (Fig. 3d). The different behavior for ν(C–C)/ν(CN) in each system, especially in describing cylindrical fiber morphologies, intimates these absorbances originate in different amino acids.
Spectra of (
Wheat gluten peptides contain a large amount of glutamine repeats or “Q-blocks” and are 38% Q overall, whereas myoglobin contains no Q-blocks and is 4% Q overall. Glutamine contains an amide group at the end of its side group connected to the peptide bond by two CH2 groups. Myoglobin contains 12.3% lysine (K), while WG proteins, gliadin (1.5% K), low molecular weight glutenin (0.7% K, UniProt P10386), and high molecular weight glutenin (1.2% K, UniProt P10387) contain very little lysine. The lysine side group has a primary amine connected to the peptide bond by four CH2 groups. Given the amounts in each mixture, ν(C–C) and ν(CN) originate in lysine and glutamine for Gd:My and WG mixtures, respectively. Rocking of NH2, γr(NH2), is discernible in WG probably because the amide on the Q cannot change its protonation state, but NH2 on lysine can, and its absorbance position can change. The data in Fig. 3c would suggest that as the NH+3 on the lysine side chain is more protonated at decreasing pH, lysine side chains gain enough positive charge to repel each other and twist the self-assembled structure into a cylinder. The charge repulsion mechanism has been shown to twist amyloid tapes into cylinders. 42 Charge repulsion keeps the C–N group at the end of the lysine side chain from hydrogen bonding, so it is able to vibrate more relative to the (CH2)4 portion of the side chain, resulting in a lower ν(C–C)/ν(CN) ratio. The limited vibration of the (CH2)4 portion is probably from pH-insensitive hydrophobic interactions, which are important in amyloid self-assembly, as shown here and in previous literature.21,42,44,65,113 The importance of hydrophobic interactions on lysine in β-sheet formation has been shown for a lysine substituted β2-microglobulin peptide at near physiological conditions. 114 Screening the positive charge on lysine for a series of KL-containing peptides also shows the importance of lysine hydrophobic interactions in β-sheet aggregation.115,116 For WG the large ν(C–C)/ν(CN) ratio suggests that the C–N group at the end of the glutamine side chain does not vibrate as much as the (CH2)2 portion of the side chain (Fig. 3d). The γr(NH2)/ν(CN) ratio increases for the first 100 h then reaches an asymptote. It is also observed that the δs(CH3)/δas(CH3) ratio decreases for the first 100 h of WG self-assembly before increasing (Fig. 2c). Taken together, this may suggest that hydrogen bonding of the end of the glutamine side chain is more important than hydrophobic packing in WG self-assembly at early times and that most of the hydrogen bonding is through the carbonyl on the amide because NH2 is able to vibrate more relative to C–N. The increase of ν(C–C)/ν(CN) and δs(CH3)/δas(CH3) and constant γr(NH2)/ν(CN) from 100 to 480 h indicates that hydrophobic packing is more important to self-assembly at long times. Instead of charge repulsion, the amyloid fiber is twisted from Q–Q hydrogen bonding. Indeed, Q–Q hydrogen bonding in Q–blocks has been shown to facilitate amyloid β-sheet formation and is implicated in prion diseases such as Huntington's disease.24,117–120 An engineered peptide containing Q-blocks has been shown to be highly twisted relative to an engineered peptide of the same length without Q-blocks. 51
Raman shift assignments.
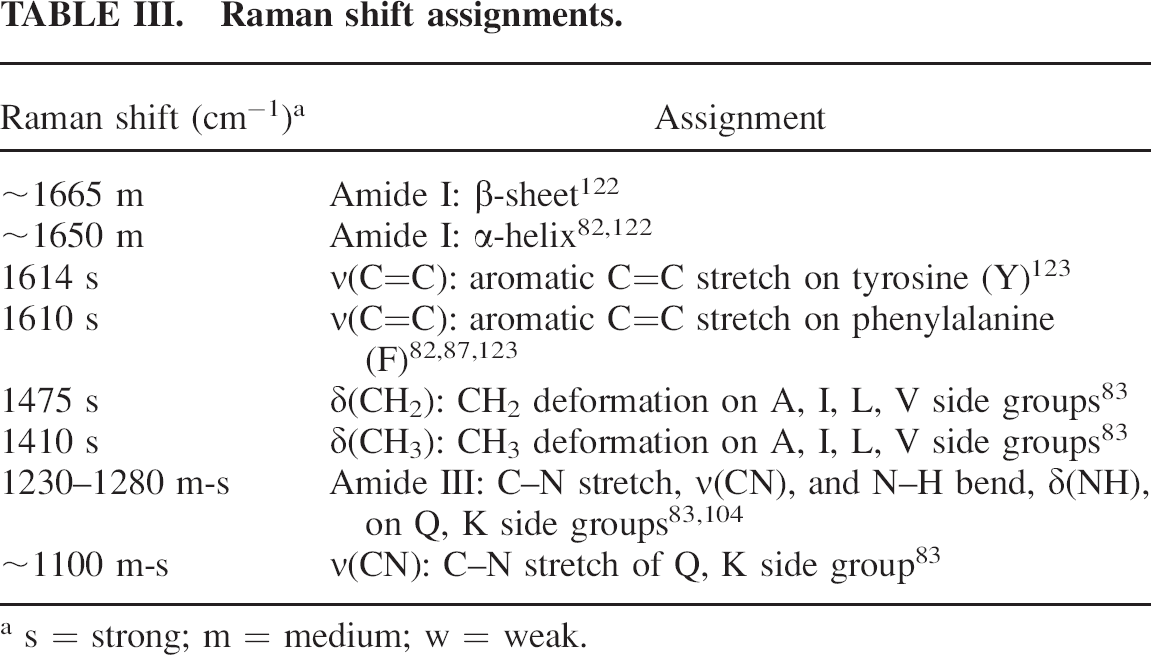
s = strong; m = medium; w = weak.
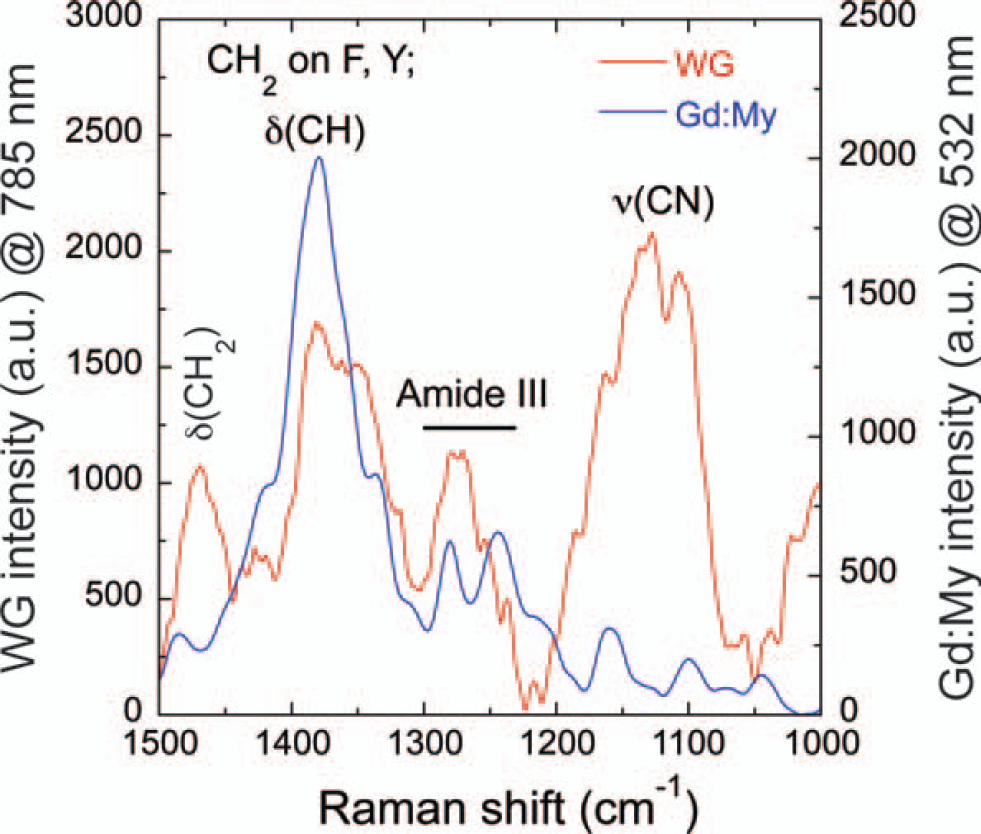
Raman spectra of WG and Gd:My dried amyloid fibers and tapes with the fiber or tape at 0° to the polarization direction depicting the deformation of CH2, δ(CH2), at ∼1475 cm−1, deformation of CH, δ(CH), and CH2 on F and Y at ∼1380 cm−1, vibration of CN, ν(CN), at ∼1140 cm−1. The amide III peak is used to determine the secondary structure: α-helix at ∼1280 cm−1, random coil at ∼1244 cm−1, and β-sheet at ∼1216 cm−1.
Polarization experiments can be performed with Raman spectroscopy to note the direction of chemical groups and secondary structure in protein fibers.130,132,137,138 When the amyloid fiber axis is aligned perpendicular to the laser polarization direction (90°) the spectrum shows the highest ratio of β-sheet intensity (∼1665 cm−1) relative to CH3 and CH2 deformation intensity (1420 cm−1 and 1475 cm−1, respectively), which is indicative of the β-sheet or protein chain axis being oriented perpendicular to the fiber axis (Fig. 5). As the polarization direction is rotated 45° and 0° relative to the fiber axis the ratio decreases. This shows that side groups of amino acids A, I, L, and V (CH3 and CH2 deformations at 1420 cm−1 and 1475 cm−1, respectively, but the 1420 cm−1 Raman shift is obscured by F and Y) and phenylalanine and tyrosine (1420, 1610, and 1614 cm−1) are oriented perpendicular to the β-sheet axis (Fig. 5; Table III) revealing that the self-assembled WG and Gd:My fibers and tapes have a cross-β structure.
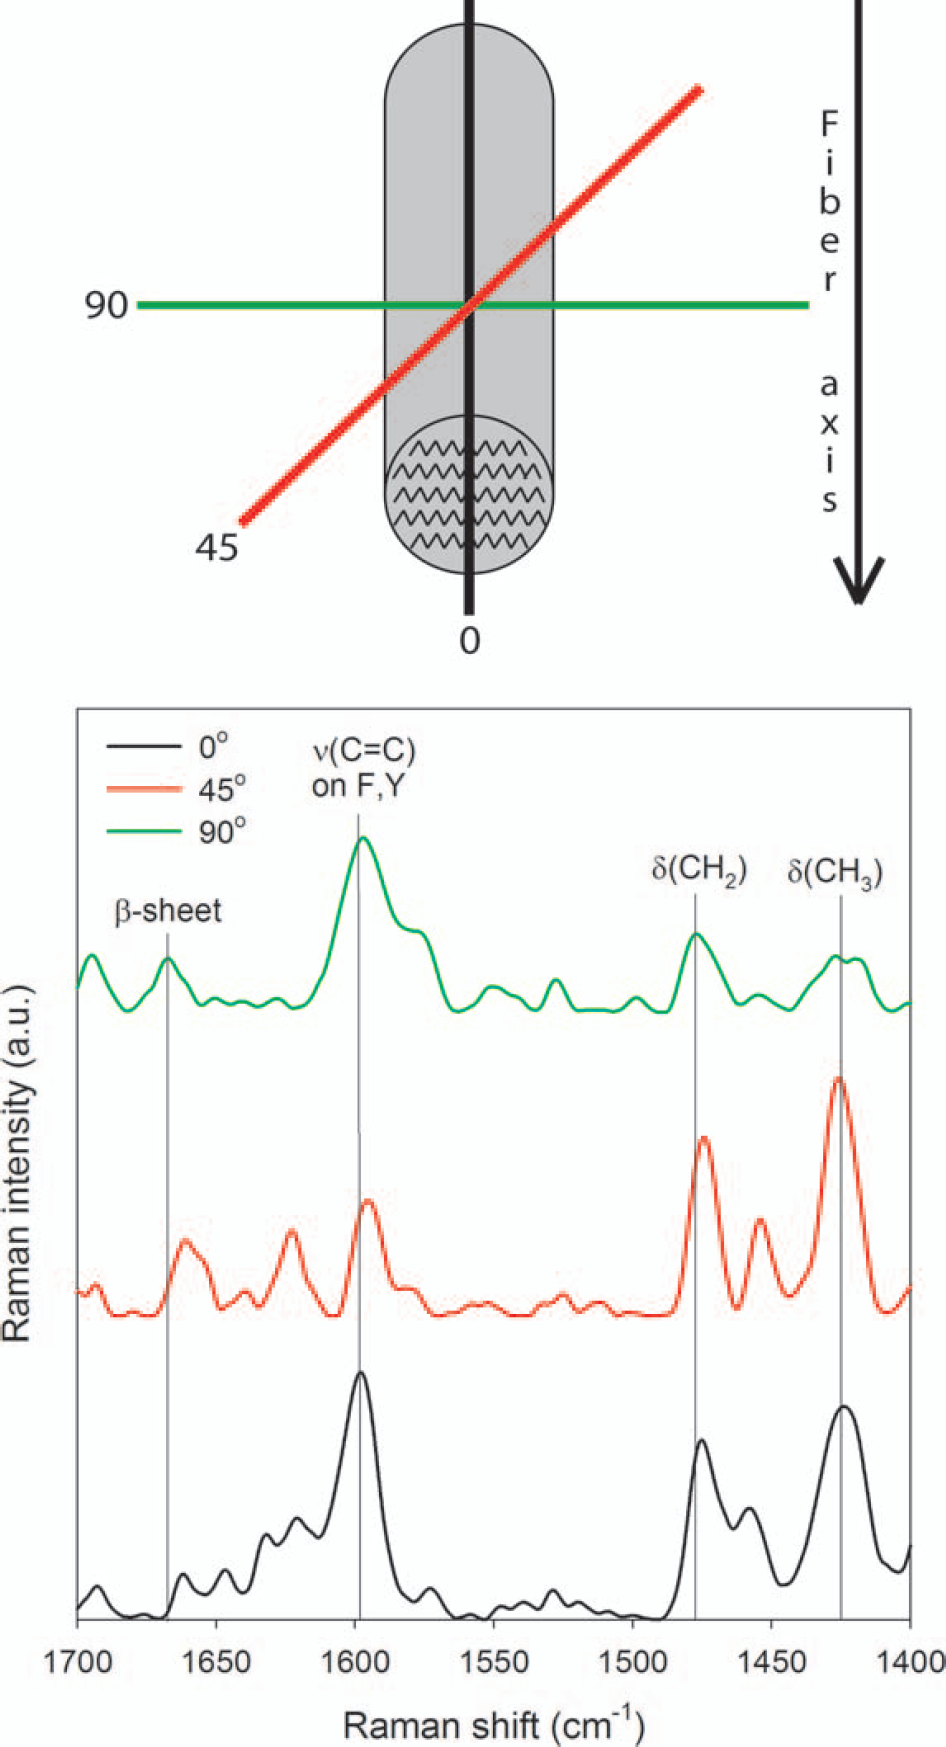
Raman spectra of a dried WG fiber oriented 0°, 45°, and 90° with respect to laser polarization direction. Laser wavelength is 785 nm.
CONCLUSION
By using FT-IR and Raman spectroscopy, β-sheet formation in self-assembled amyloid structures can be monitored over time in aqueous solution and in the final structure upon drying. Secondary structure change and development can be accomplished through analysis of the amide I region originating from stretching of the carbonyl on the peptide bond. Beyond simple analysis of the amide I region, analysis of the behavior of plentiful amino acids with hydrophobic side groups, A, I, L, and V, illustrates the role of hydrophobic interactions in driving secondary structure change and β-sheet formation. Further, Q in WG mixtures and K in Gd:My mixtures can be isolated in the FT-IR and Raman spectra and their influence on the self-assembled structure delineated. Through polarization of the Raman excitation, the molecular orientation of amino acid side groups relative to the protein chain axis in the β-sheets and fiber axis can be determined. Techniques such as these could be generalized to other amyloid systems to show the effect of hydrophobic interactions and specific amino acids on aggregation behavior.
Footnotes
ACKNOWLEDGMENTS
Generous funding through NSF-CMMI-0856262 and the Virginia Tech Biodesign and Bioprocessing Research Center are greatly appreciated.