
Abstract
Sales induced through price promotions depend heavily on discount depth, so firms create mechanisms to influence perceptions of discount depth. Typically, consumers compute discount depth as the difference between the sale price and the original price, with this difference compared against the original price. But thus far, no research has examined the effect of reframing this difference by comparing the discount depth against the sale price. Multiple studies, including a field study across four grocery stores, show that framing the discount depth by comparing it against the sale price increases consumers’ discount depth perceptions and thus increases purchase intentions. As evidence of the underlying process, the authors identify boundary conditions related to both individual differences (numeracy) and managerially relevant factors (discount depth size). In addition to contributing to research on price promotions, behavioral pricing, and numeric processing, the article offers implications for both practitioners and policy makers focused on consumer welfare.
Price promotions drive sales. They improve consumers’ utility by reducing the economic sacrifice associated with purchases (Aydinli, Bertini, and Lambrecht 2014), and so perceptions of greater discount depth are associated with more sales (Urbany, Bearden, and Weilbaker 1988). Firms adopt various tactics in their attempts to increase consumers’ perceptions of discount depth, such as inflating reference prices (Tuttle 2016) or stacking discounts (The Economist 2012; also see Chen and Rao 2007). Typically, consumers perceive the discount depth as the difference between the original price and the (reduced) sale price, compared against the original price. If the original price is $10 and the sale price is $8, the price promotion advertisement (hereafter, promotional ad) highlighting this discount likely reads “20% off” or emphasizes that the sale price is “20% lower” (discount = $10 – $8 = $2; discount depth = $2/$10 = 20%).
However, discount depth might also be presented as a comparison against the sale price. In the example in the previous paragraph, reframing the discount depth by comparing it against the sale price would involve the use of a numerically higher number. That is, because this version of discount depth divides the discount by the (lower) sale price, the reframed promotional ad then would indicate that the original price was 25% higher ($2/$8 = 25%) than the sale price. Even though the absolute dollar value of savings is unchanged ($2), we propose that because of the use of a higher number (in this case, 25% vs. 20%), reframing of the promotional ad may increase consumers’ discount depth perceptions.
Prior work on numeric cognition suggests that individuals may be influenced more by the absolute value of the numbers they view than by the economic value implied by those numbers. For example, when promised a monetary reward for drawing a red bean from an opaque jar, individuals prefer to draw from ajar that contains 100 beans, of which 9 are red (success odds = 9/100), than from ajar that contains 10 beans, of which 1 is red (success odds = 1/10, objectively greater than 9/100) (Denes-Raj and Epstein 1994). Participants in these studies appear drawn more to the numerically higher number in the numerator (9 vs. 1) and less drawn to actual, objectively better success odds. Similarly, behavioral pricing research indicates that for an item initially priced at Mex$480, consumers prefer a Mex$120 discount over an economically equivalent 25% discount (Gonzalez et al. 2016), likely because the number 120 is greater than the number 25. Similar findings emerge when examining between-product comparisons (in attribute domains like warranty length, processing speed, memory, screen size, and price comparisons; Kruger and Vargas 2008) and in work that compares price promotions with bonus packs (Chen et al. 2012; Mohan, Chandon, and Riis 2015). These findings originate in different literatures, yet the effects described are consistent and convergent.
Nevertheless, we anticipate more nuance in the effects that we study due to both individual differences in consumers’ numeracy (i.e., ability to process basic probability and numerical concepts; Peters et al. 2006) and variations in discount depth. First, we distinguish between more versus less numerate consumers. Even though most people spend substantial time learning the mechanics of math in school, they may not fully understand how to apply those mechanics, even as adults (Dehaene 1997). Work in numeric cognition suggests that the likelihood of such application increases with numeracy, such that when they must make judgments, more numerate individuals are less influenced by alternative frames of the same number. Thus, the effects we predict may be mitigated among more numerate consumers. Second, at low discount depths (e.g., discount depths ∼ 10%), regardless of whether the promotional ad is framed as “now 10% lower” or (equivalently) “was 11% higher,” both ad frames employ similar-value numbers, so they are unlikely to have a differential impact on purchase intentions. This line of reasoning suggests that low discount depth promotions constitute a boundary condition for the effects we propose.
In establishing these effects and their boundary conditions, we contribute to research on price promotions, behavioral pricing, and numeric processing. First, we detail a new type of price framing, applicable to promotional advertising, that may lead to a sales lift. Price promotions are a key driver of sales, so our research advances an important, substantive domain. Second, we contribute to research into how consumers process price promotions, by providing insights into how consumers form perceptions of discount depth. Third, this article advances understanding of numeric processing, by revealing a systematic bias in processing percentage information, as well as by outlining some limitations to this bias. Furthermore, this study has direct applications to pricing practice. Using the promotional ad framing “was X% higher” (vs. “now Y% lower”) may lead to a sales lift, but policy makers focused on consumer welfare may call for caution with regard to the implementation of such promotional frames.
Conceptual Development
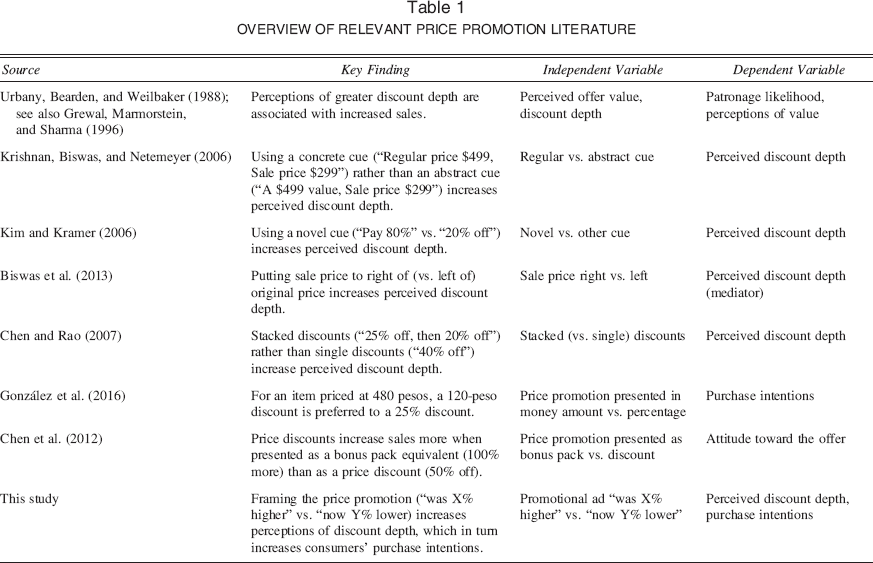
Consumers usually purchase products that yield the highest utility per dollar spent. Given this, price promotions improve consumers’ utility by reducing the economic sacrifice they make for a purchase (Aydinli, Bertini, and Lambrecht 2014). The depth of the discount associated with the price promotion is thus a key driver of sales (Urbany, Bearden, and Weilbaker 1988), so substantial research focuses on how best to present a price promotion to maximize people's perceptions of the discount depth (Grewal, Marmorstein, and Sharma 1996). For example, the presence of a semantic cue, and that cue's plausibility, concreteness, novelty, and location all may increase discount depth perceptions. Explicitly cuing a high but plausible comparison price (i.e., original price) increases perceived discount depth (Urbany, Bearden, and Weilbaker 1988), as do using a concrete cue (e.g., “Regular price $499, Sale price $299”) rather than an abstract cue (e.g., “A $499 value, Sale price $299”; Krishnan, Biswas, and Netemeyer 2006) and offering a novel cue (Kim and Kramer 2006). In addition, putting the original price to the left (vs. right) of the sale price can increase consumers’ propensity to calculate discount depth, and thereby increase perceptions of discount depth (Biswas et al. 2013). Finally, using multiple, stacked price discounts (vs. a single financially equivalent discount) may increase perceived discount depth (Chen and Rao 2007), and the order of the stacked discounts may increase or mitigate such effects (Bagchi and Davis 2015). An overview of relevant price promotion research is presented in Table 1.
In price promotions, the consensus thus far is that discount depth evaluation involves the difference between the original price and the sale price, and then the comparison of this difference against the original price. With this definition of discount depth, prior research (Table 1) has focused on how to increase perceptions of discount depth, but without ever examining the implications of reframing discount depth by comparing the discount difference against the sale price. With this reframing, a promotional ad would note that the original price “was X% higher” than the sale price, whereas a more conventional but financially equivalent framing might indicate that the sale price is “now Y% lower” than the original price. To predict how consumers may interpret a “was X% higher” promotional framing, we turn to research related to numeric cognition and to behavioral pricing.
Overview of Relevant Price Promotion Literature
How Consumers May Interpret the Reframed Promotional Ad
Cognitive experiential self-theory (CEST) (Pacini and Epstein 1999) provides guidance on how consumers may interpret these reframed promotional ads. According to CEST, individuals process stimuli via either a cognitive system (which is analytical and effortful) or an experiential system (which is more “associationalistic” and intuitive). The experiential system can more easily process and attend to concrete bits of information, like absolute numbers, than abstract information, such as ratios, percentages, and other relations between numbers. Furthermore, when people process absolute numbers, the experiential system gives processing primacy to factors like numerosity (Reyna and Brainerd 2008), which then prevails over other considerations linked to these absolute numbers, like ratios and percentages. In essence, to the extent that individuals use the experiential system, they are (1) more likely to be swayed by a stimulus that indicates a “more numerous,” or higher, number and (2) less likely to be swayed by a stimulus involving a lower but (after adjusting for ratio or percentage transformations) more beneficial number.
CEST helps provide the conceptual underpinnings for why consumers are influenced (or biased) by absolute numbers, as has been demonstrated in a variety of domains, such as price discounts, evaluation of foreign currencies, evaluation of fractions, and work on ratio biases. In the domain of price discounts, behavioral pricing research has demonstrated that for an item priced at Mex$480, a discount of Mex$120 was perceived as more valuable than a discount of 25%, but for an item priced at Mex$48, discounts of 25% and Mex$12 were perceived similarly (González et al. 2016). These results suggest that consumers use an absolute number heuristic, preferring price promotions involving a higher-value (vs. lower-value) number, irrespective of the economic value implied by these numbers.
We now pivot to the research domain involving how consumers evaluate foreign currencies. When evaluating prices labeled in foreign currency, individuals exhibit face value bias and focus on nominal values (Raghubir and Srivastava 2002; Wertenbroch, Soman, and Chattopadhyay 2007). More specifically, Wertenbroch, Soman, and Chattopadhyay (2007) find that consumers were more likely to buy more expensive items when priced in a less numerous currency (e.g., dollars, euros) versus a more numerous currency (e.g., pesetas, lira). In effect, consumers perceive the price to be significantly larger when described using a more numerous currency that results in numeric responses involving higher absolute values.
When examining information involving fractions, individuals generally pay more attention to the information in the numerator and underweight the denominator. Expanding on this point, Burson, Larrick, and Lynch (2009) indicate that that there is a bias toward using foreground information (numerator) because it is more salient than background information (denominator). This idea is termed “denominator neglect.” Consistent with the theme of denominator neglect, consumers may not adjust for the fact that the “was X% higher” framing involves a higher-value number only because it is linked to the sale price, a lower-value starting point.
These results extend into the realm of consequential choices. For example, research in numeric cognition and ratio bias shows that when incented to draw a winning item, individuals preferred to draw from a bag with 9 winning items out of 100 items than to draw from a bag with 1 winning item out of 10 items (Denes-Raj and Epstein 1994). The post facto rationales offered included statements such as, “I picked the bag with the more red jelly beans because it looked like there were more ways to get a winner, even though I knew the 'percents’ were against me” (p. 823). In effect, individuals appear to be influenced more by the numbers with higher absolute value and less by the ratios/percentages implied by these numbers.
Work in diverse literatures, such as behavioral pricing and numeric cognition, shows that when evaluating numeric information presented as ratios or percentages, consumers exhibit an absolute number heuristic. Building from this point, we posit that consumers may perceive that a “was X% higher” promotional framing (vs. financially equivalent “now Y% lower” framing) implies higher levels of discount depth because the number represented by X is greater in absolute value than the number represented by Y. Furthermore, upon perceiving greater discount depth, these consumers might perceive increased purchase intentions. Therefore, we propose:
H1: Versus the “now Y% lower” discount frames, financially equivalent “was X% higher” discount frames increase both (a) purchase intentions and (b) perceptions of discount depth, with (c) the latter effect mediating the former.
Figure 1 presents these points pictorially.
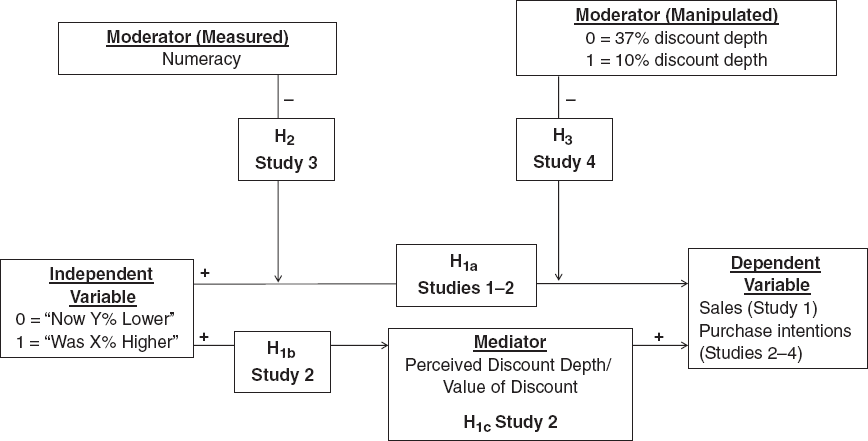
Overall Process Model and Associated Studies
Moderating Influence of Numeracy
Numeracy is the “ability to understand and use numbers” (Dieckman, Slovic, and Peters 2009, p. 1474) “to process basic probability and numerical concepts” (Peters et al. 2006, p. 407). Individuals differ substantially in their numerical ability (Paulos 1988), and data from a National Literacy Survey suggest that about half of the U.S. population finds it difficult to understand and use numbers embedded in print material (Kirsch et al. 2002). Although we note that prior research has found that need for cognition is a key antecedent to numeracy (De Bruin et al. 2015), numeracy is distinct from need for cognition. To be highly numerate, individuals not only must have a high need for cognition but also must possess the cognitive competence to manipulate numbers (Reyna and Brainerd 2008). In this article, we focus on numeracy instead of need for cognition because numeracy reflects an information-processing skill specific to numerical information, rather just the motivation to process information in general. As such, we expect numeracy to be more relevant to understanding how consumers process discount percentages.
When evaluating numerical information, many adults cannot apply the mechanics of math suitably (Dehaene 1997), but the likelihood of suitable application increases as numeracy increases. To investigate this, Peters et al. (2006) rerun the experimental design used by Denes-Raj and Epstein (1994), wherein individuals are incented to draw a winning item and choose between drawing from a bag with 9 winning items out of 100 items versus a bag with 1 winning item out of 10 items. Peters et al. (2006) find that more numerate individuals were less likely to make a suboptimal decision, that is, were less likely to draw from the bag with 9 winning items.
It appears that when more numerate individuals make judgments, they (vs. less numerate individuals) are less impacted by alternative frames surrounding objectively similar numbers. For example, when encountering numeric information, more numerate individuals are more likely to retrieve and apply the appropriate numerical principle and then use this principle to transform numbers suitably. Accordingly, we propose (as shown pictorially in Figure 1):
H2: Numeracy levels moderate the relationship between promotional ad frames and purchase intentions, such that more numerate people exhibit smaller differences in purchase intentions when the promotional ad is framed as “was X% higher” versus the financially equivalent “now Y% lower.”
Moderating Influence of Discount Depth Size
Building on work on price promotion thresholds (Grewal, Marmorstein, and Sharma 1996; Gupta and Cooper 1992), recent behavioral pricing research (Biswas et al. 2013) indicates that, relative to a case without promotions, promotional ads signaling discount depth at about 30% or greater increase purchase intentions because this discount depth is large enough for consumers to perceive differences vis-à-vis the original price. However, promotional ads signaling low discounts (about 10% discount depth) may not increase purchase intentions because the discounts are not large enough for consumers to perceive significant differences. Accordingly, we consider two discount depth levels. At the discount depth levels of 30% or better, for example, the promotional ad would display either “now 37% lower” or the objectively equivalent “was 59% higher.” The numerical difference between these numbers is relatively large, so use of different promotional frames should induce significantly different purchase intentions. However, at low discount depths, for example, the promotional ad might indicate either “now 10% lower” or “was 11% higher.” The numerical difference between “10%” and “11%” is relatively small, so use of different promotional ad frames should lead to less difference in purchase intentions. In effect, we anticipate that discount depth levels moderate our predicted effects. Formally, we propose (shown pictorially in Figure 1):
H3: Discount depth levels moderate the relationship between promotional framing and purchase intentions, such that when the discount depth is low (vs. high), consumers exhibit smaller differences in purchase intentions when the promotion is framed as “was X% higher” versus the financially equivalent “now Y% lower.”
Overview of Studies
We present four studies (Figure 1). In Study 1, we investigate H1a in a field setting, across four grocery stores in Sweden. In Study 2, using mediation analyses, we examine H1a–c in the lab and test some alternative explanations for our effects. Moderation analyses then help reveal boundary conditions for these effects, and we use moderators that are both conceptually grounded in theory (numeracy) and managerially relevant (discount depth levels). Specifically, in Study 3, we test H2 by examining whether the proposed effects might be mitigated among more numerate consumers. Then, in Study 4, we test H3 by examining whether the proposed effects diminish when promotions involve low discount depths. Appendix A shows stimuli exemplars, Appendix B shows scale details, and Appendix C shows data across all studies. For all stimuli, see the Web Appendix.
Study 1: Initial Field Examination
Method
As an initial examination, we conducted a field study in four stores of a leading grocery chain in Sweden, using four household products (shampoo, napkins, coffee, and fresh cream). In week 1, all products were sold at their original prices; we noted some slight price differences across stores (e.g., for shampoo, prices ranged between SEK 24.90 and SEK 26.90). For each product, the stores provided information about daily unit sales. Then, in week 2, the four products went on sale. One of the authors worked with the four store managers to ensure that the sale prices were the same across stores for each product (e.g., shampoo was SEK 18 in each store, for a discount depth of about 30%). With this consistent sale price, we manipulated two types of promotional frames. In all cases, the promotional ad signage showed both the original price and the sale price, but half of them were phrased (for example) as “now 31% lower,” while the other half were phrased as “was 44% higher” (for Swedish-language signage exemplars, as used by the retailer, see Appendix A).
Designating the four products as A–D and the four stores as 1–4, the experimental design during week 2 was as follows: In stores 1 and 2, signage for products A and B used the “now Y% lower” format, while the signage for products C and D used the “was X% higher” format. Conversely, in stores 3 and 4, signage for products C and D used the “now Y% lower” format, while the signage for products A and B used the “was X% higher” format. By gathering information about daily unit sales for each of the four products across the four stores, across seven day's unit sales in week 2, we had 112 data points.
Results
We analyze daily unit sales. The key independent variable is promotional ad framing (where 0 = “now Y% lower” and 1 = “was X% higher”). While presenting the findings, we present an unadjusted mean comparison first and then a more formal regression analysis. In the first analysis, the dependent variable is daily (unit) sales in week 2, so we test whether the different promotional ad frames increase sales, while controlling for week 1 sales. At the aggregate level, daily unit sales were higher when the ad framing read “was X% higher” (Mwas = 42.73 vs. Mnow = 20.77; t(1 10) = 2.56, p < .05). Moving to a formal regression analysis, we regressed daily unit sales against promotional ad framing, controlling for week 1 daily unit sales as also using other control variables, namely, discount depth and store dummies. The beta coefficient for promotional ad framing was positive and significant (b = 10.95, SE = 3.78; t = 2.89, p < .05), consistent with the aggregate-level results and with H1. These regression results held even after we included further control variables, such as (1) square term, relating to week 1 daily unit sales, and (2) dummy variables for the products and dummy variables for the day of the week.
We also analyzed sales lift, that is, the difference in daily (unit) sales (week 2 Monday unit sales – week 1 Monday unit sales). At the aggregate level, the difference in sales lift was higher when the promotional ad framing read “was X% higher” (Mwas = 30.68 vs. Mnow = 14.05; t(110) = 2.75, p < .05). This result persisted in a subsequent regression analysis (not reported here, for brevity), which mirrored the regression analysis presented earlier.
These results are consistent with H1a; using the “was X% higher” frame increased daily unit sales. This field study provides an initial test of theory in a domain in which consumers made actual choices and purchases.
Study 2: Underlying Mediation Process
We present two lab studies that test the mediation sequence outlined in H1a–c in different product domains. Further, we address some alternative explanations, such as whether our results (1) might reflect novelty effects or (2) might relate merely to the “was X% higher” framing, independent of the actual numerical information used.
Study 2a: Examining H1a–c
Method
Participants (N = 82 undergraduates, 48.8% women) were randomly assigned to a two-cell design wherein they considered purchasing an upscale living room chair. The chair had been originally priced at $1,199.00 but was offered at the (reduced) sale price of $755.37. The promotional ad framed the discount depth as either “was 59% higher” or (equivalently) “now 37% lower” (for stimuli exemplars, see Appendix A). Participants responded to two measures (three-item, seven-point scales), related to their purchase intentions (PI; from Dodds, Monroe, and Grewal 1991) and perceptions of the discount depth (DD; adapted from Grewal, Marmorstein, and Sharma 1996). As we noted, the “was 59% higher” promotional frame is a cue that consumers are unlikely to have encountered before, so we also asked the participants whether they perceived the framing as novel, using a single-item scale (Cox and Cox 1988). Finally, we elicited participants’ perceptions of perceived complexity (two-item, seven-point scale; Cox and Cox 2002). All scale details are shown in Appendix B. In a manipulation check, we asked whether the advertisement had featured the “was 59% higher” or the “now 37% lower” frame. Finally, we elicited demographics.
Results
The majority (98.8%) of participants answered the manipulation check question correctly, suggesting they generally paid attention to the stimulus. Moving forward, we report results for all respondents. 1 Also, we note that although participants perceived the “was 59% higher” frame as more novel (M = 4.83) than the “now 37% lower” frame (M = 4.05; t(80) = 2.15, p < .05), they did not perceive the “was 59% higher” frame as more complex (Mwas = 4.31 vs. Mnow = 4.26; t(80) = .11, p > .9).
In this and subsequent studies, we report results for 100% of participants. In general, results persist irrespective of whether we include or exclude participants who did not suitably respond to the manipulation check question.
Participants perceived discount depth as greater and expressed higher purchase intentions when the discount framing read “was 59% higher” (DD: Mwas = 5.01 vs. Mnow = 3.94; t(80) = 3.62, p < .05; PI: Mwas = 4.37 vs. Mnow = 2.78; t(80) = 4.60, p < .05). As seen in Figure 2, using PROCESS (Model 4), we found evidence of partial mediation, in that the use of the “was 59% higher” (vs. “now 37% lower”) frame increased discount depth perceptions, which then enhanced purchase intentions. The 95% confidence interval (CI) for the indirect effect (promotional ad framing → perceived discount depth → purchase intentions) did not include 0 (.36, 1.35). These results are consistent with H1a–c.

Study 2A Results
An alternative explanation for our results recognizes that novel price cues can increase purchase intentions (Kim and Kramer 2006). Thus, noting that the correlation between novelty and purchase intentions was significant (r = .33, p < .05), our reported effects may be (at least partially) related to the novelty associated with the “was 59% higher” ad framing. Therefore, we tested (in multiple ways) the role of novelty.
First, the mediation results presented earlier persisted, even when we controlled for perceived novelty; the 95% CI for the indirect effect (promotional ad framing → perceived discount depth → purchase intentions) continued to exclude 0 (.25, 1.24). Second, we reanalyzed Study 2a data, using both perceived novelty and perceived discount depth as (potential, multiple) mediators (Figure 2). For perceived discount depth, the 95% CI for the indirect, mediated effect excluded 0 (.30, 1.33). For perceived novelty, however, the 95% CI for the indirect, mediated effect did include 0 (–.07, .33), indicating nonsignificant mediation.
Study 2b: Reexamining H1a–c
Motivation
Although in Study 2a we found that the promotional ad frame (“was 59% higher” vs. “now 37% lower”) increased perceptions of discount depth and thus increased purchase intentions, an alternative explanation exists. That is, rather than reflecting the numerical difference between 59% and 37%, perhaps the increases in perceived discount depth and purchase intentions could be related to differences in the phrasing between “was … higher” and “now … lower.” We therefore develop a 2 (promotional phrasing: “now … lower” vs. “was … higher”) × 2 (stated discount depth: 37% vs. 59%) design. Our theorizing suggests that the difference between “37” and “59” drives the Study 2a findings, so purchase intentions should be (1) high across the “now 59% lower” and “was 59% higher” conditions and (2) low in the “now 37% lower” and “was 37% higher” conditions. This point is consistent with the conjecture that consumers may use an absolute number heuristic, as discussed earlier.
Method
This study, conducted with 271 undergraduate students (60.5% women), uses a 2 (promotional phrasing: “now … lower” vs. “was … higher”) × 2 (stated discount depth: 37% vs. 59%) between-subjects design. Participants examined a scenario involving the purchase of a box of instant-coffee single-serve sachets (for stimuli exemplars, see Appendix A). In all cases, the sale price was similar ($10.25). The original prices were suitably adjusted to comport with the discount phrasing, for example, in the case of the “now 37% lower” phrasing, the original price was $16.25. Participants indicated PI, using the scale used in Study 2a, and also indicated value of discount (VOD; scale details in Appendix B). Finally, we asked manipulation check questions relating to the promotional phrasing used and the stated discount depth; we also elicited demographics.
Results
The majority (85.6%) of participants answered the manipulation check questions correctly, suggesting they generally paid attention to the stimulus. The analyses of variance (ANOVAs) for PI and VOD were similar, indicating a significant main effect for stated discount depth (PI: F(1, 267) = 12.43, p < .05; VOD: F(1, 267) = 24.11, p < .05), but they indicated no significant main effect for promotional phrasing (PI: F(1, 267) = .63, p = 43; VOD: F(1, 267) = 3.43, p = .07) and no significant interaction effects (PI: F(1, 267) = .03, p = .86; VOD: F(1, 267) = 1.62, p = .20). Consistent with the ANOVA results our prior theorizing, PI and VOD were (1) high across the “now 59% lower” (MPI = 6.69; MVOD = 4.28) and “was 59% higher” conditions (MPI = 6.46; MVOS = 3.95) and (2) low in the “now 37% lower” (MPI = 5.82; MVOD = 3.63) and “was 37% higher” (MPI = 5.68; MVOD = 3.57) conditions.
Given that there were no interaction effects, we collapsed across cells and compared the two cells that had stated discount depth of 37% with the two cells that had stated discount depth of 59%. We tested for mediation, using PROCESS (Model 4) (Figure 3). The impact of the independent variable (stated discount depth: 37% vs. 59%) was significant for both PI (t = 3.54, p < .05) and VOD (t = 4.91, p < .05). Furthermore, when both the independent variable and VOD were present in the regression for PI, the impact of the independent variable was nonsignificant (t = .37, p = .71), whereas the impact of VOD remained significant (t = 14.49, p < .05). In addition, the 95% CIs for the indirect effect of the independent variable on PI via VOD did not include 0 (46, 1.07). Finally, considering all four two-cell comparisons (“now 37% lower” vs. “was 59% higher”; “now 37% lower” vs. “now 59% lower”; “was 37% higher” vs. “was 59% higher”; “was 37% higher” vs. “now 59% lower”), the 95% CIs for the indirect effect of the independent variable on PI via VOD did not include 0. These results are consistent with H1a–c and with the results of Study 2a.
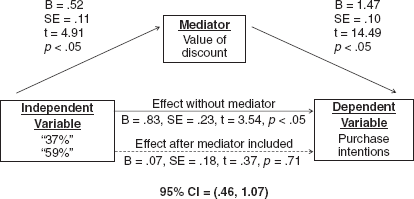
Study 2B Results
In Study 2a, the use of the “was 59% higher” (vs. “now 37% lower”) promotional ad framing increased purchase intentions. These effects might stem either from the comparison between “59” and “37” or from the comparison between the wording “was … higher” and “now … lower.” Study 2b PI results showed (1) no significant main effect for promotional phrasing (“now … lower” vs. “was … higher”), but (2) a significant main effect for stated discount depth (37% vs. 59%). Therefore, Study 2b indicates that our effects have less to do with wording differences in promotional ad framing than with the comparison between the absolute numbers used across the promotional ad framings. Also, consistent with the results in Study 2a, it is unlikely that novelty drives our effects, as mere use of the “was X% higher” promotional ad framing (i.e., mere use of the novel promotional ad framing) did not increase PI.
Study 3: The Role of Numeracy
Method
Study 3 tests H2, that is, whether our effects are mitigated among more numerate consumers. Participants (234 undergraduate students, 50.4% women) were randomly assigned to a 2 (promotional framing: “was 59% higher” vs. “now 37% lower”) × continuous (numeracy) between-subjects design. In a behavioral lab, participants examined a scenario involving the purchase of a queen-sized mattress (for stimuli exemplars, see Appendix A). The original price had been $1,597.99, and the sale price was $1,006.73. The promotional framing read either “was 59% higher” or “now 37% lower.” We elicited PI (as in Study 2a; α = .95) and numeracy scores, using a numeracy scale by Peters et al. (2006). This numeracy scale involved 11 questions (M = 8.96) that required participants to calculate some basic probabilities (e.g., “If person A's risk of disease is 1% in ten years, and person B's risk is double that of A's, what is B's risk?”). The full numeracy scale is shown in Appendix B. We asked a manipulation check question (as in prior studies) and elicited demographics.
Results
The majority (90.2%) of participants answered the manipulation check question correctly, suggesting they generally paid attention to the stimulus. Similar to the results in Studies 1 and 2, PI was greater in the “was 59% higher” condition (Mwas 59% higher = 4.69 vs. Mnow 37% lower = 3.61; t(232) = 5.55, p < .05). Using the MODPROBE macro (Hayes and Matthes 2009), we tested whether numeracy scores (M = 8.96) moderated the impact of promotional framing on purchase intentions. To facilitate interpretation of regression coefficients, in the analyses that follow, we use mean-centered numeracy scores.
The regression for PI showed a significant main effect for both promotional framing (b = 1.08, SE = .19; t = 5.63, p < .05) and mean-centered numeracy scores (b = .54, SE = .20, t = 2.64; p < .05) and also showed a significant interaction effect (b = –.42, SE = .13; t = −3.27, p < .05). The MODPROBE output showed that the Johnson–Neyman point was 10.3 (note that upon mean-centering, the Johnson–Neyman point was 1.34), at which b = –.51, SE = .26, t = 1.97, andp = .05. Specifically, for more numerate participants (i.e., the 14.5% of the sample with numeracy scores > 10.3), differences in promotional ad framing did not prompt significantly different PI elicitations. These results are consistent with H2.
Study 4: Role of Discount Depth Size
Method
Study 4 tests H3, that is, whether our effects are mitigated when discount depth is low. This lab study, conducted with 198 undergraduate students (45.1% women), used a 2 (ad framing: “was X% higher” vs. “now Y% lower”) × 2 (discount depth: high vs. low) between-subjects design. We also included a fifth control cell, described subsequently. Participants examined a scenario involving the purchase of a queen-sized mattress, originally priced at $1,597.99. In the high discount depth condition (consistent with Study 2a), the sale price was $1,006.73, so the promotional ad read either “was 59% higher” or, in a financially equivalent version, “now 37% lower” (for stimuli exemplars, see Appendix A). In the low discount depth condition, the sale price was $1,438.19, so the promotional ad read either “was 11% higher” or the financially equivalent “now 10% lower.” In the control cell, we used the same sale price as in the high discount depth condition ($1,006.73) but used a lower original price ($1,379.22), so that the promotional ad read “was 37% higher.” We elicited purchase intentions, then asked manipulation check and demographic questions (similar to Study 2a).
Results
The majority (95.5%) of participants answered manipulation check questions correctly, suggesting they generally paid attention to the stimulus. Excluding (for now) the control condition, the ANOVA for purchase intentions revealed main effects for both promotional ad framing and discount depth (F(1, 154) > 17.03, p < .05), as well as a significant interaction effect (F(1, 154) = 10.44, p < .05). Simple contrasts (Figure 4) showed that in the high discount depth condition, purchase intentions were significantly higher for the “was 59% higher” frame (M = 4.84) versus the “now 37% lower” frame (M = 3.54; F (1, 154) = 27.06, p < .05), in line with prior results. However, in the low discount depth condition, purchase intentions were not significantly different across the promotional ad frames (Mwas 11% higher = 3.19; Mnow 10% lower = 3.03; F (1, 154) = .40, p = .53), consistent with H3.

Study 4 Results
In a separate, supplementary analysis, we conducted a oneway ANOVA for purchase intentions, across the control cell (“was 37% higher”) and the two discount depth cells (“now 37% lower” and “was 59% higher”) wherein the sale price was the same. The ANOVA for PI was significant (F(2, 116) = 29.12, p < .05). In key contrasts, PI was significantly higher for the condition with the discount frame “was 59% higher” (M = 4.84) than in either the “was 37% higher” condition (M = 3.38; t(116) = 6.98, p < .05) or the “now 37% lower” condition (as specified previously). We also found no significant difference in PI across the “was 37% higher” and “now 37% lower” conditions (t(116) = .79, p = .43). This supplementary analysis buttresses the results of Study 2b, in that use of the “was … higher” ad framing alone does not appear to drive our effects. Rather, it appears that our effects stem from the use of the numerically higher number 59 (vs. 37).
Discussion
Summary
We refer back to our process model (Figure 1). In Study 1, we ran a field study that showed that when promotional advertising for price discounts was framed as “was X% higher” (vs. the financially equivalent framing of “now Y% lower”), sales increased. In Study 2, across two lab studies using different product types, we find that when promotional advertising was framed as “was X% higher” (vs. the financially equivalent framing of “now Y% lower”), discount depth perceptions increased, which subsequently increased purchase intentions. In Study 3, we examined the moderating role of numeracy, showing that the effects were relatively lower among more numerate consumers. Finally, in Study 4, we examined the moderating role of discount depth size, showing that the effects were relatively lower when discount depth was low. These studies spanned a variety of product domains (e.g., grocery items, mattresses, coffee sachets, furniture), involved both real and hypothetical situations, and employed a broad range of variables (actual sales, purchase intentions, perceived discount depth, and perceived value of discount). In aggregate, these results confirmed a robust effect, tested across field and lab studies, and tested using both mediation and moderation analyses.
A supplementary study is presented in the Web Appendix, wherein we examine what happens when the price promotion is withdrawn. This is an important question because price promotions are typically withdrawn after some period (Kahn and Louie 1990). The supplementary study showed that there was no follow-on negative effect when the “was X% higher” (vs. “now Y% lower”) promotional ad was withdrawn.
Contributions to Theory
This article contributes to multiple streams of research, notably, those on price promotions, behavioral pricing, and numeric processing. First, prior investigations of price promotions assume that discount depth evaluations refer to the difference between the original and sale prices, compared against the original price. We examine a different type of promotional ad frame that highlights the discount depth by comparing the discount difference against the sale price. As a key finding, across a field study and multiple lab studies, we show that using the promotional ad frame “was X% higher” increases perceptions of discount depth and thus increases purchase intentions, subject to some boundary conditions.
Second, behavioral pricing research has considered various ways semantic cues (and their concreteness, novelty, or location) can increase perceptions of discount depth and purchase intentions (see Table 1). This article offers the first evidence of how (re)framing the discount depth, by comparing against the sale price, can increase discount depth perceptions and thus enhance purchase intentions. Our effects are consistent with the idea that when consumers evaluate advertisement information involving percentages, they tend to use an absolute number heuristic. As the absolute value of the number in the promotional ad increases, consumers are more swayed by this absolute value and less swayed by the economic value of the numeric information in the promotional advertising.
Third, this article contributes to research on numeric processing. It shows a systematic bias wherein consumers make errors when processing percentage information. Specifically, consumers appear to be influenced more by the face value of the number that appears in the percentage information and influenced less by the economic value that is represented by that percentage information.
Contributions to Practice
This research has direct applicability to the practices that marketers and retailers use to present their price promotions. First, retailers can make selective use of the “was X% higher” promotional ad frame to increase consumers’ purchase intentions. This practice is relatively simple to implement, requiring a change only in the signs displaying promotional ads, and not requiring changes in, for example, actual prices.
Second, Study 3 shows that the “was X% higher” promotional ad frame is less impactful among substantially numerate consumers (see Study 3). Put another way, while this ad frame may be generally impactful, it is likely to be especially impactful for retailers who primarily serve consumer segments that are less numerate (e.g., those who are older, those less educated, those with lower income; see Ciampa et al. 2010; De Bruin et al. 2015). From a public policy perspective, this point appears especially relevant as these (less numerate) segments are precisely the segments that public policy researchers may perceive as worthy of increased protection via policy prescriptions.
Third, the “was X% higher” promotional ad frame is likely to be less impactful when discount depth is low (see Study 4). Given that prior research has shown that low discount depths are generally less impactful (Grewal, Marmorstein, and Sharma 1996; Gupta and Cooper 1992), retailers tend not to use low discount depth levels. For example, Bogomolova et al. (2015) examine discount depths in the United States, across two retail chains and 16 product categories. The average discount depth was 25%, and in 12 (of the 16) categories, the average discount depth exceeded 25% (28%–32%; see Table 5 of Bogomolova et al. [2015]). This suggests that, in general, there are several product categories wherein discount depth levels are “not low,” so there are opportunities for retailers to implement the suggested promotional ad frame (“was X% higher”) and thereby increase sales.
Finally, the Federal Trade Commission has provided regulation, “Guides Against Deceptive Pricing,” to prevent deceptive pricing practices (16 Code of Federal Regulations 233; reproduced in Grewal and Compeau 1992, p. 53). Notably, Section 233.1 of the rule pertains to former price comparisons and states that the practice of comparing an advertised sale price with a former price is acceptable if the former price is the actual price at which the good regularly sold for a reasonable amount of time. The promotional ad frame (“was X% higher”) that we examine would not conflict with these guidelines.
Nevertheless, even though the promotional ad frame (“was X% higher”) we examine is objectively correct, it may represent a method for taking advantage of consumers’ biases, suggesting the need for more research into these types of promotional frames. Some research has focused on protecting consumers from marketing practices that, although legal, take advantage of consumers’ unconscious biases (e.g., Grewal and Goodstein 1993). For example, when seeking to increase their margins, manufacturers may reduce package sizes (which consumers are less likely to notice) rather than increase prices (Adams, Di Benedetto, and Chandran 1991). To guard against this, Brazilian regulatory authorities have mandated that any quantity reductions must be displayed on the front of packaging (Neves and Itacarambi 2008). Consumer welfare researchers might similarly examine the promotional ad framing that we delineate herein to evaluate whether specific guidelines addressing such promotional ad frames are necessary for consumers’ protection.
Limitations and Future Research
We have not examined whether the effects persist at very high discount depth levels (e.g., “now 67% lower” vs. “was 200% higher”). As an initial prediction, building from Gupta and Cooper (1992), we anticipate that consumers may be skeptical upon encountering a number that is valued at more than 100%. More generally, it may be useful to examine a wide range of discount depth levels, ranging from very low to very high, to better understand the discount depth range in which the effects proposed in H1 are most likely to occur.
The question of whether these effects will persist in the long run is an empirical one. If many or all retailers adopt this type of ad framing, the sales lift from using “was X% higher” promotions might diminish as consumers get better at calculating discount depth. Finally, drawing from work on prospect theory, we note that individuals tend to process losses more carefully than gains (Chatterjee et al. 2000). Thus, while our effects may persist in price promotion (gain) domains, they may be mitigated in price increase (loss) domains. This point is consistent with other work (e.g., Grewal, Gottlieb, and Marmorstein 1994) that also draws from prospect theory, which has shown that price cues are processed differently when advertising messages are framed negatively (vs. positively).
Finally, the implications of this work may extend beyond sale prices. The work in this article indicates that when firms advertise any attribute or outcome in which “less is better,” they may be better off using the presentation discussed here. For example, if a laptop manufacturer advertises that its new model is 30% lighter, then perhaps the promotional ad should state that the prior year's model was 42% heavier. The framing discussed in this article may also be used to promote healthier food choices. For example, some manufacturers make the front-of-package claim that canola oil-based shortening has “25% less sodium than butter”; such claims might have a stronger impact if manufacturers reframed the message as “butter has 33% more sodium.” Future research may extend the scope of this work beyond pricing to other elements of the marketing mix.
Footnotes
Stimuli Exemplars
Scale Items
The likelihood that I would buy the [product] at the sale price is ___. The probability that I would consider buying the [product] is ___. My willingness to buy the [product] at the sale price is ___. Study 2a: α = .95; Study 2b: α = .92; Study 3: α = .95; Study 4: α = .85 The discount offered by the retailer for the [product] is very fair. The discount at which the [product] is offered by the retailer provides very good value. The discount offered by the retailer for the [product] is very attractive. Which of the following numbers represents the biggest risk of getting a disease? [1 in 100,1 in 1,000,1 in 10] Which of the following represents the biggest risk of getting a disease? [1%,10%,5%] If the chance of getting a disease is 10%, how many people would be expected to get the disease out of 100? If the chance of getting a disease is 10%, how many people would be expected to get the disease out of 1000? If the chance of getting a disease is 20 out of 100, this would be the same as having a ___% chance of getting the disease. If person A's risk of disease is 1% in ten years, and person B's risk is double that of A's, what is B's risk? If person A's risk of disease is 1 in 100 in ten years, and person B's risk is double that of A's, what is B's risk? In the BIG BUCKS lottery, the chances of winning a $10 prize is 1%. What is your best guess about how many people would win a $10 if 1000 people each buy a single ticket from BIG BUCKS? Imagine that we roll a fair, six-sided die 1000 times. Out of 1000 rolls, how many times do you think the die would come up even (2, 4, or 6)? The chance of getting a viral infection is .0005. Out of 10,000 people, about how many of them are expected to get infected? In the ACME PUBLISHED SWEEPSTAKES, the chance of winning a car is 1 in 1000. What percent of tickets of ACME PUBLISHING win a car?
Scale
Items
Endpoints
Reliability (by Study)
Purchase intentions (PI) (items from Dodds, Monroe, and Grewal 1991)
1 = “very low,” and 7 = “very high”
Discount depth perceptions (DD) (items adapted from Grewal, Marmorstein, and Sharma 1996)
1 = “strongly disagree,” and 7 = “strongly agree”
Study 2a: α = .88
Perceptions of novelty (from Cox and Cox 1988)
• The discount presentation format “Was X% higher”/'Now Y% lower” was ___.
1 = “old,” and 7 = “new”
N.A.
Perceived complexity (Cox and Cox 2002)
• The discount presentation format “Was X% higher”/'Now Y% lower” was ___.
1 = “complicated,” and 7 = “simple”; 1 = “complex,” and 7 = “not complex”
Study 2a: r = .93, p < .05
Value of discount (VOD) (items adapted from DelVecchio, Lakshmanan, and Krishnan 2009)
• The total discount offered is very valuable/The total discount makes the offer a good deal
1 = “strongly disagree,” and 5 = “strongly agree”
Study 2b: r = .64, p < .05
Numeracy (from Peters et al. 2006)
N.A. (scores: M = 8.96; SD = 1.48)
Results across all Studies
Notes: Standard deviations are shown in parentheses.
A: Study 1 (Field Study; Domain = Grocery Products)
I. “Now Y% Lower” (n = 56)
II. “Was X% Higher” (n = 56)
Daily unit sales
20.77 (23.18)
42.73 (59.68)
Contrast between cells I and II
t-test: t(110) = 2.56, p < .05; regression: b = +10.95, SE = 3.78, t = 2.89, p < .05
B: Study 2a (Lab Study; Domain = Furniture)
I. “Now 37% Lower” (n = 40)
II. “Was 59% Higher” (n = 42)
PI
2.78 (1.70)
4.37 (1.40)
DD
3.94 (1.50)
5.01 (1.15)
Contrast between cells I and II
PI: t(80) = 4.60, p < .05; DD: t(80) = 3.62, p < .05
C: Study 2b (Lab Study; Domain = Coffee Sachets)
I. “Now 37% Lower” (n = 67)
II. “Now 59% Lower” (n = 69)
III. “Was 37% Higher” (n = 68)
IV. “Was 59% Higher” (n = 67)
PI
5.82 (2.04)
6.69 (1.83)
5.68 (1.99)
6.46 (1.85)
VOD
3.63 (1.06)
4.28 (.69)
3.57 (.92)
3.95 (.75)
Contrast between cells I and II
PI: t(267) = 2.62, p < .05; VOD: t(267) = 4.38, p < .05
Contrast between cells I and IV
PI: t(267) = 1.92, p < .06; VOD: t(267) = 2.15, p < .05
Contrast between cells II and III
PI: t(267) = 3.07, p < .05; VOD: t(267) = 4.81, p < .05
Contrast between cells III and IV
PI: t(267) = 2.36, p < .05; VOD: t(267) = 2.57, p < .05
D: Study 3 (Lab Study; Domain = Mattresses)
I. “Now 37% Lower” (n = 115)
II. “Was 59% Higher” (n = 119)
PI
3.61 (1.56)
4.69 (1.43)
Contrast between cells I and II
t(232) = 5.55, p < .05
Interaction with (mean-centered) numeracy scores
β = –.42, SE = .13, t = −3.27, p < .05.
E: Study 4 (Lab Study; Domain = Mattresses)
I. “Now 37% Lower” (n = 38)
II. “Was 59% Higher” (n = 41)
III. “Now 10% Lower” (n = 39)
IV. “Was 11% Higher” (n = 40)
V. “Was 37% Higher” (n = 40)
PI
3.54 (1.02)
4.84 (.85)
3.03 (1.46)
3.19 (1.00)
3.38 (.95)
Contrast between cells I and II
F(1, 154) = 27.06, p < .05
Contrast between cells III and IV
F(1, 154) = .4, p = .53
Contrast between cells I and V
t(116) = .79, p = .43
Contrast between cells II and V
t(116) = 6.98, p < .05.
References
Supplementary Material
Please find the following supplemental material available below.
For Open Access articles published under a Creative Commons License, all supplemental material carries the same license as the article it is associated with.
For non-Open Access articles published, all supplemental material carries a non-exclusive license, and permission requests for re-use of supplemental material or any part of supplemental material shall be sent directly to the copyright owner as specified in the copyright notice associated with the article.