






Abstract
Background: Our goal was to quantify and visualize the three-dimensional loading relationship between the ligaments and articular surfaces of the ankle to identify and determine the stabilizing roles of these anatomical structures during the stance phase of gait. Materials and Methods: We applied discrete element analysis to computationally model the three-dimensional contact characteristics and ligament loading of the ankle joint. Physiologic loads approximating those at five positions in the stance phase of a normal walk cycle were applied. We analyzed joint contact pressures and periankle ligament tension concurrently. Results: Most ankle joint loading during the stance phase occurred across the articular surfaces of the joint, and the amount of ligament tension was small. The tibiotalar articulation showed full congruency throughout most of the stance phase, with peak pressure developing anteriorly toward the toe-off frame. Of the periankle ligaments, the deep deltoid ligament transferred the most force during the stance phase (57.2%); the superficial deltoid ligament transferred the second-most force (26.1%). The anterior talofibular ligament transferred force between the talus and fibula continuously, whereas the calcaneofibular ligament did not carry force during gait. The distal tibiofibular ligaments and the interosseous membrane were loaded throughout the stance phase. Conclusion: Force transmission through the ankle joint during the stance phase is predominantly through the articular surfaces, and the periankle ligaments do not play a major stabilizing role in constraining ankle motion. The medial ligaments have a more important role than do the lateral ligaments in stabilizing the ankle joint. Clinical Relevance: In addition to ligament insufficiency, other factors, such as varus tilt of the tibial plafond, may be important in the development of recurrent instability. Continuous loading of syndesmosis ligaments provides a theoretical basis for evidence of syndesmosis screw breakage or loosening. The analysis method has potential applications for clarifying ankle joint function and providing a basis for comparison between normal and abnormal joint conditions.
Introduction
Determining joint contact pressure and ligament loading of the ankle during the walking cycle provides a basic understanding of the function of the ankle joint. Loading analysis also makes it possible to compare normal and abnormal joint conditions, which could provide clues to the pathogenesis of ankle disorders, and treatment options. Researchers have used various methodologies to investigate joint contact characteristics of the ankle in cadavers 3,7,19,26,27,33,42,44 and have measured periankle ligament strain during passive ankle motion. 8,10,30,43 However, studies have been limited because loading conditions were not physiologic and did not consider functional activities, such as the walking cycle. In addition, joint contact pressure and ligament loading were studied two-dimensionally. For a full understanding of the function of the ankle joint, three-dimensional analysis is critical. To our knowledge, simultaneous examination of the articular surfaces and periankle ligaments has not been reported previously. To understand the relation between the articular surfaces and periankle ligaments in providing ankle stability and constraining motion, simultaneous examination of the structures is essential.
The Virtual Interactive Musculoskeletal System (VIMS) 9 is a biomechanical simulator for human musculoskeletal physiology that interactively displays detailed information about the muscles, tendons, ligaments, bone, and joint anatomy. 9 With the VIMS, joint articular contact forces and ligament loading are explored by means of the discrete element analysis (DEA) technique. 14,16
With VIMS models and the DEA technique, 14,16 we investigated the three-dimensional contact characteristics and ligament loading of the ankle joint under physiologic loads approximating those during the stance phase of gait. Our goals were to quantify and visualize the loading relationship between the ankle ligaments and the articular surface of the ankle, to identify the main stabilizing anatomical structures in the ankle joint during the stance phase of the walking cycle, and to determine the stabilizing roles of the articular surfaces and the periarticular ligaments of the ankle during the stance phase of gait.
Materials and Methods
With the DEA method, a region of elastic elements is established between rigid bodies representing the bony structures. Articular cartilage is represented by compressive springs, and ligamentous tissue is modeled with tensile springs. Within the spring system, the application of external loads is balanced by local spring deformation between adjacent bodies to achieve an equilibrium state. Each spring has individual stiffness properties based on the type of tissue and thickness. The local spring deformation of each element provides the final joint and ligamentous force distribution. To perform the analysis, we first developed a three-dimensional computer model of the ankle, including its bony, ligamentous, and articular structures. Surface models were used for graphic display and estimation of the mechanical centroids of each bone. Compressive forces between the rigid bony components were isolated to contact surfaces at the articulations. Ligaments, represented by tensile springs, were inserted at physiologic locations. Finally, joint loading vectors were applied, resulting in an equilibrium force distribution between these components.
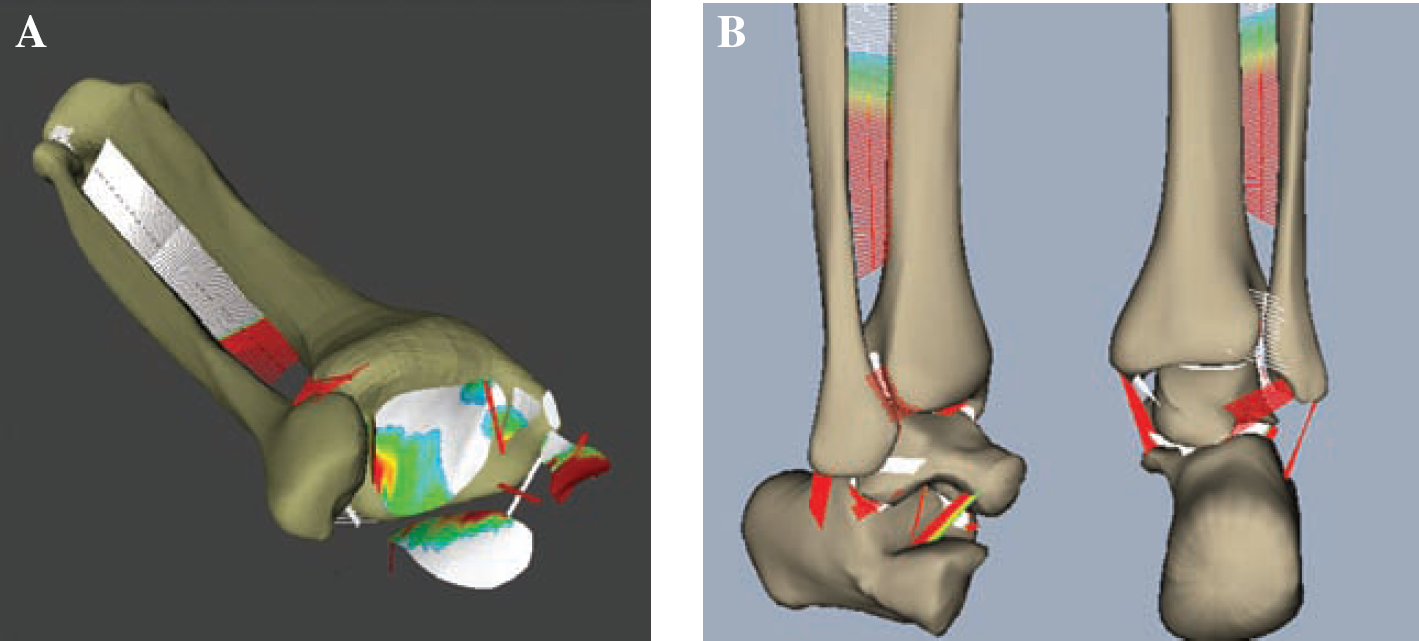
Our model included contact surfaces and ligaments. The lines and surfaces display the contact and ligament forces graphically.
Bone surface model
Digitized computed tomography (CT) images of the lower extremity of an adult human cadaver from the Visible Human Dataset 38 (National Library of Medicine, Bethesda, MD) was the source of bone surface models of the talus, calcaneus, tibia, and fibula. However, because the Visible Human Dataset represents the ankle in only a single position, and because the talocrural joint axis changes continuously over the range of motion, 25 additional CT data were acquired from an intact lower extremity of an adult female cadaver in a range of ankle positions. The cadaveric lower extremity was placed unloaded in a passive flexion apparatus and scanned by CT at 1-mm intervals for different flexion angles in 10 degrees increments between 30 degrees dorsiflexion and 50 degrees plantarflexion. The CT image data of ankle positions of the cadaver were transferred to mechanical design software (SolidWorks, Concord, MA), and the bone surface models from the Visible Human Dataset were scaled, translated, and rotated into accurate anatomical positions according to these CT images.
Articular surface modeling
Regions of potential contact within the joint were identified on orthogonal CT sections. The articular regions were estimated as surfaces that were equidistant from the subchondral layer of adjacent bones. We assumed that the cartilage was of equal thickness over the entire articular surface. Curved contour lines were stacked to generate a three-dimensional surface that was subdivided into approximately 10,000 triangular elements. The average element area was approximately 0.15 mm 2 . In the middle of each element mesh, there was a unidirectional compressive spring placed normal to the surface. Compressive springs over the joint contact surface represented cartilage tissue resisting the compressive load of the joint. Eight articular surfaces were constructed for the tibiotalar joint, subtalar joint, tibiofibular joint, and talofibular joint (Figure 1A).
The stiffness of the normal compressive springs was determined from Young's modulus of 11.85 MPa for cartilage, 18 Poisson's ratio of 0.45, 5 and a combined articular cartilage thickness of 2.39 mm. 36 Stiffness of the normal compressive springs (kd ) was derived as follows:

where E, v, and h are Young's modulus, Poisson's ratio, and thickness, respectively, of the articular cartilage.
Ligament modeling
After CT scanning, the width and length of the anterior talofibular ligament, calcaneofibular ligament, posterior talofibular ligament, lateral talocalcaneal ligament, deltoid ligament, cervical ligament, interosseous talocalcaneal ligament, proximal and distal tibiofibular ligament, and interosseous membrane of the specimen were measured with digital calipers and assumed to be initial lengths. We also measured the origin and insertion points of the above-listed ligaments with digital calipers to reference their locations relative to bony landmarks. Rows of tensile springs for the ligaments and interosseous membrane were inserted at the three-dimensional anatomical positions on the bone surface model created from dissection data of the same specimen (Figure 1B). Stiffness of the ligaments and the interosseous membrane were obtained from published data: anterior talofibular ligament (399.9 N/cm), 1 calcaneofibular ligament (705.1 N/cm), 1 posterior talofibular ligament (397.5 N/cm), 1 deep deltoid ligament (1288.2 N/cm), 1 distal anterior tibiofibular ligament (780 N/cm), 4 and distal posterior tibiofibular ligament (1010 N/cm). 4 Presently no published stiffness data exist for the proximal anterior tibiofibular ligament, proximal posterior tibiofibular ligament, cervical ligament, interosseous talocalcaneal ligament, or lateral talocalcaneal ligament. The assumed stiffness of the remaining ligaments was 700 N/cm based on the range of known stiffnesses of the other hindfoot ligaments. Stiffness of the interosseous membrane of the shank was estimated by scaling the stiffness of the interosseous membrane of the forearm (1310 N/cm per cm width). 32 Based on the respective ultimate tensile stress of the forearm (45.1 MPa @ 9.9% strain) 32 and the shank (90.25 MPa @ 7.70% strain), 29 the assumed shank stiffness was 2242 N/cm per cm width.
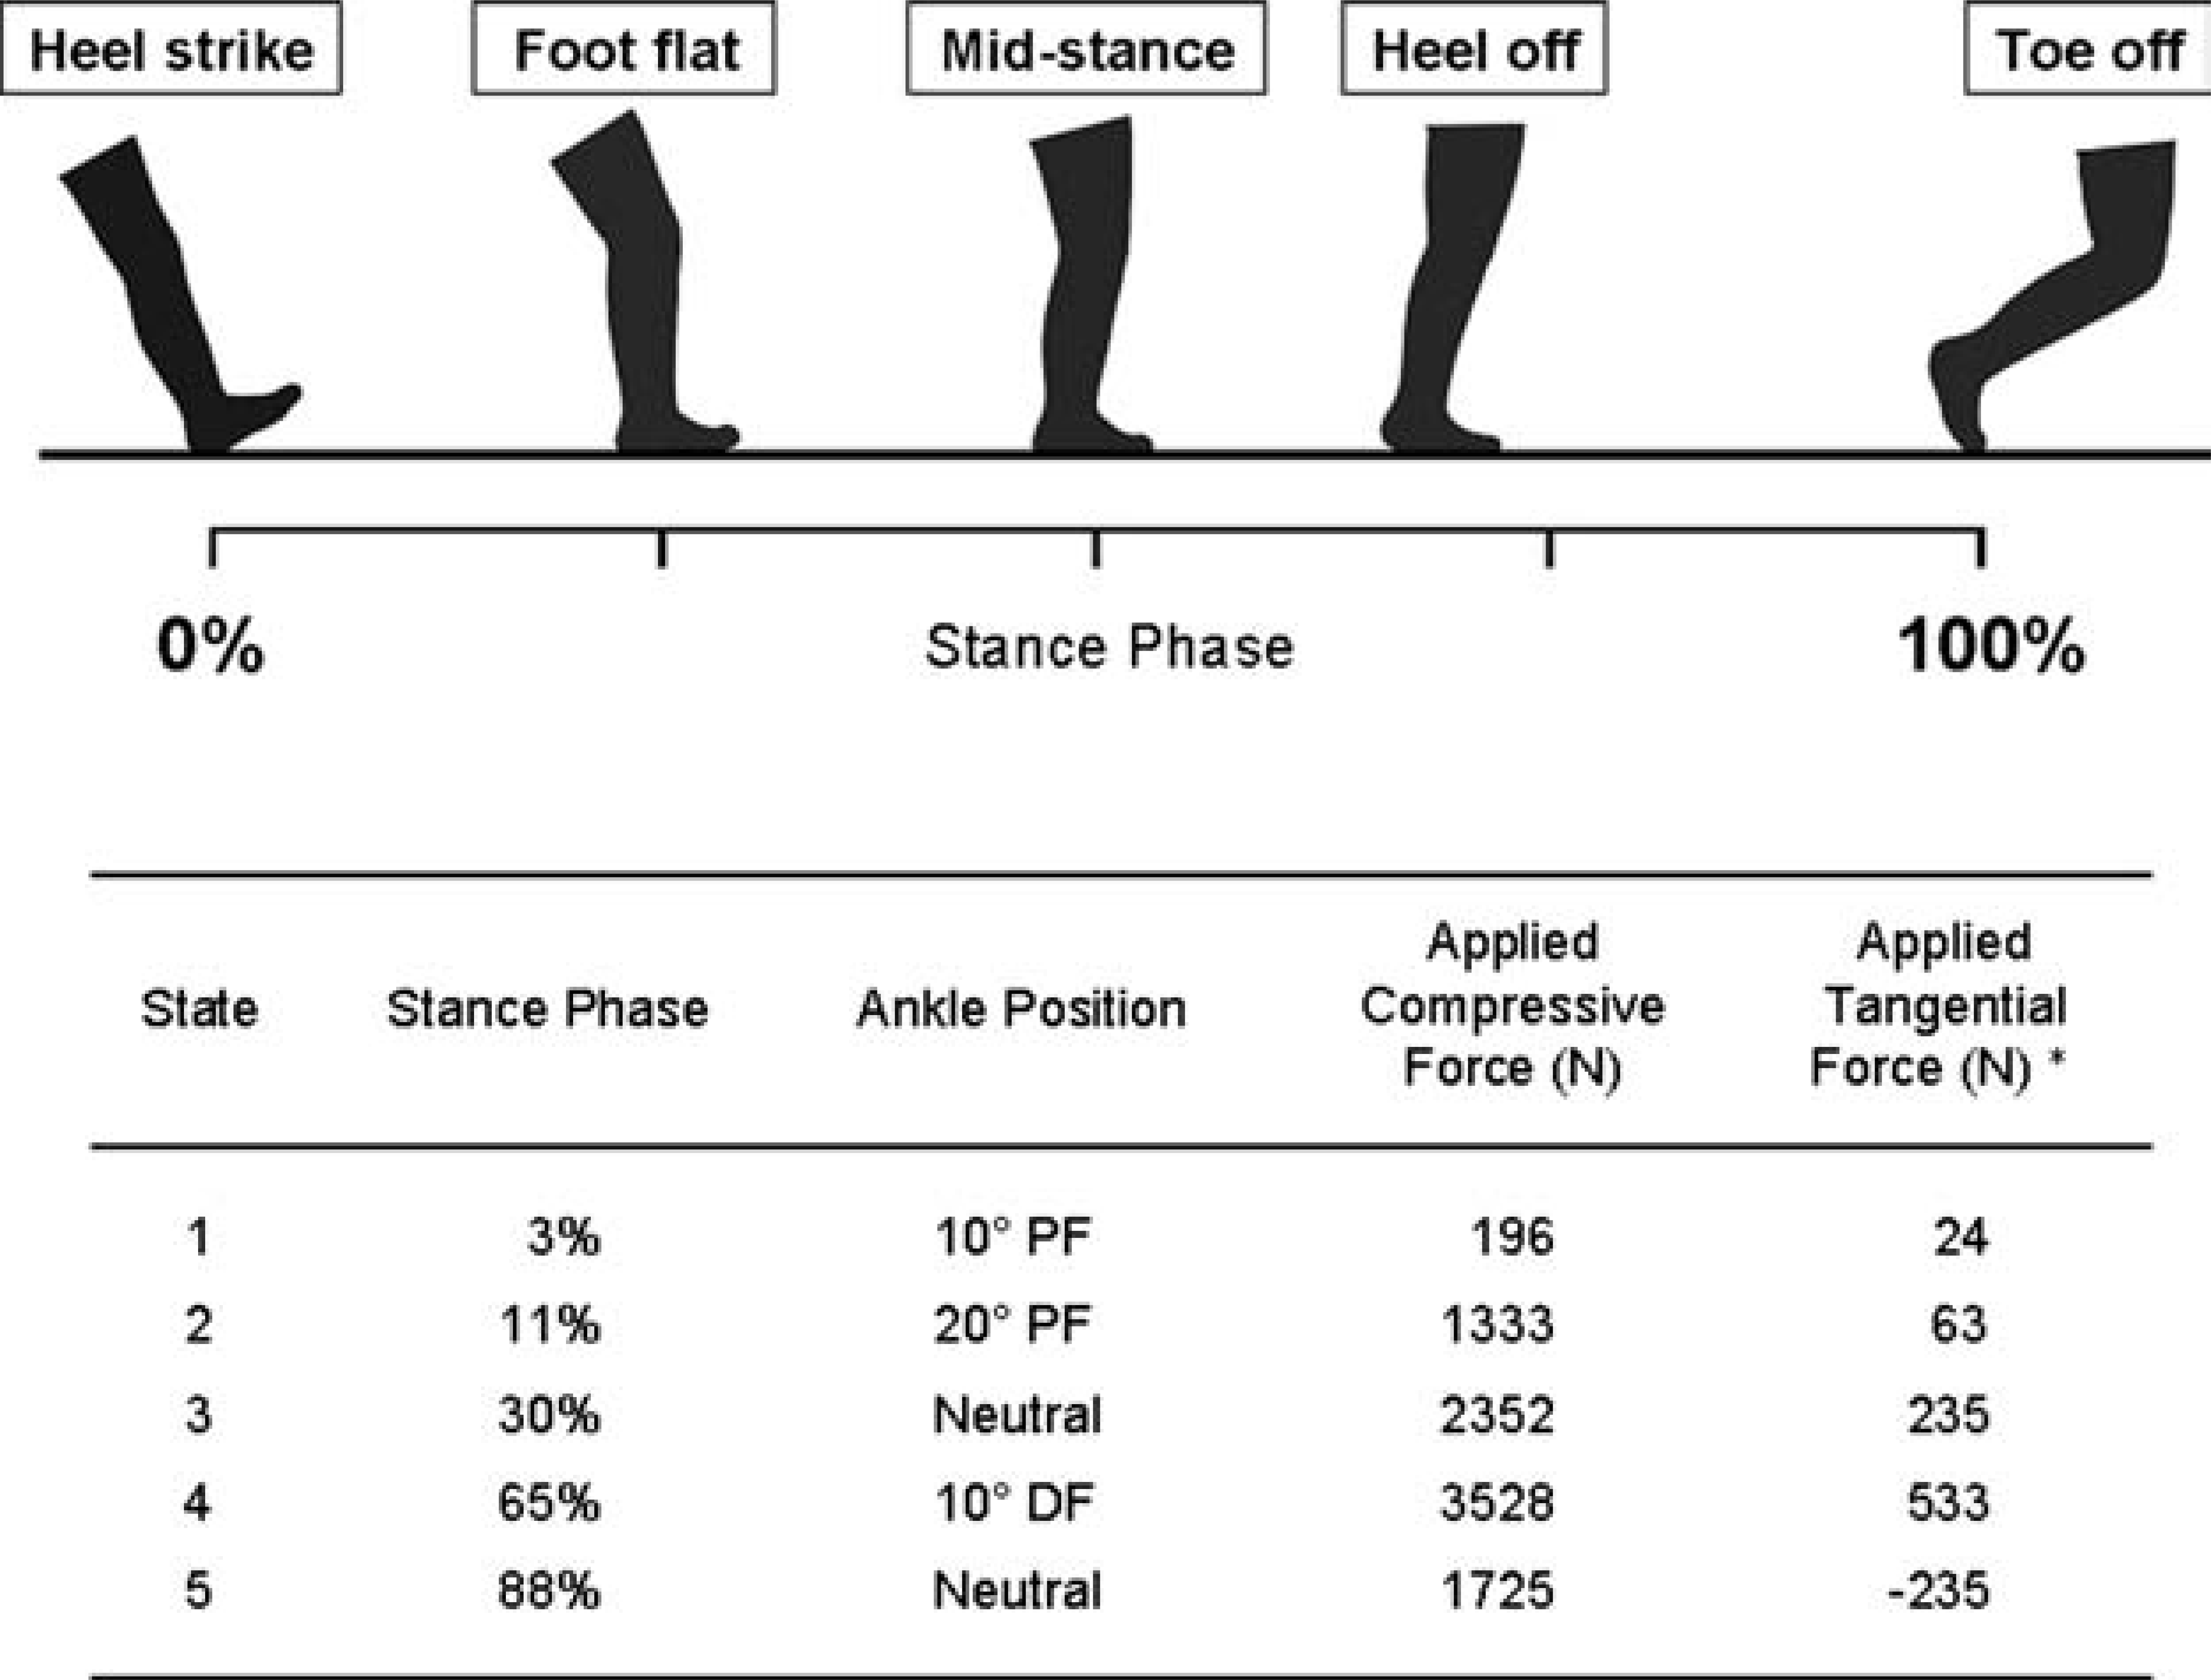
Loading conditions applied during walking. The model was evaluated at discrete frames (States 1–5) during the stance phase of gait. ∗, positive value indicates that tangential force acted in the anterior direction; PF, plantarflexion; DF, dorsiflexion.
Loading conditions during walking
We applied physiologic loads approximating those during normal walking for five subjects according to previously published data 39 (Figure 2). The study methods involved the use of high-speed motion picture film, force plate, and foot-switch data. 39 The Achilles and anterior tibial tendon forces and the compressive and tangential (shear) forces across the ankle during the stance phase of gait were determined, on the basis of a quasistatic analysis. Constraint forces through the ankle joint were used to calculate deformation of the spring element system once an equilibrium state was achieved. The model was evaluated at discrete frames (State 1 to State 5) during the stance phase of gait (as shown in Figure 2) to study the relation between ankle position and joint loading on the contact mechanical characteristics and the loading of individual ligaments. In this model, all bones were defined with respect to the calcaneus, which was fully constrained, and the other bones moved with respect to the calcaneus. The talus was constrained only in anteroposterior translation due to absence of the forefoot in this model, and the tibia was constrained in internal/external rotation. The fibula was free of external constraints and was bounded by the proximal and distal tibiofibular articulations and ligamentous tissue.
Determination of joint contact pressure and effective contact area
With our DEA algorithm, the compressive force in each spring element was determined by the change in relative distance of the spring element attachment points in reference to the unloaded position. Intra-articular shear forces were neglected because of the low friction coefficient between cartilage surfaces. The normal force within each spring element was divided by the known area of each contact mesh element to solve for the local contact pressure. During the iterative process of seeking a system equilibrium point, nonuniform loading across a ligament or an articular surface led to some compressive springs becoming tensile and some tensile springs becoming compressive. In such cases, these offending springs were disabled within the current iteration of the model, thus reducing the effective area of contact and altering the pressure and tension characteristic within the joint. If in a subsequent iteration the springs resumed with valid loading directions, the springs were re-enabled, thus increasing the effective contact area. Iterations continued until all springs bore valid loads and a quasi-equilibrium state was acheived. Although failure to converge is possible in poorly formed systems, all of the gait phases we tested resulted in exact model solutions.
Results
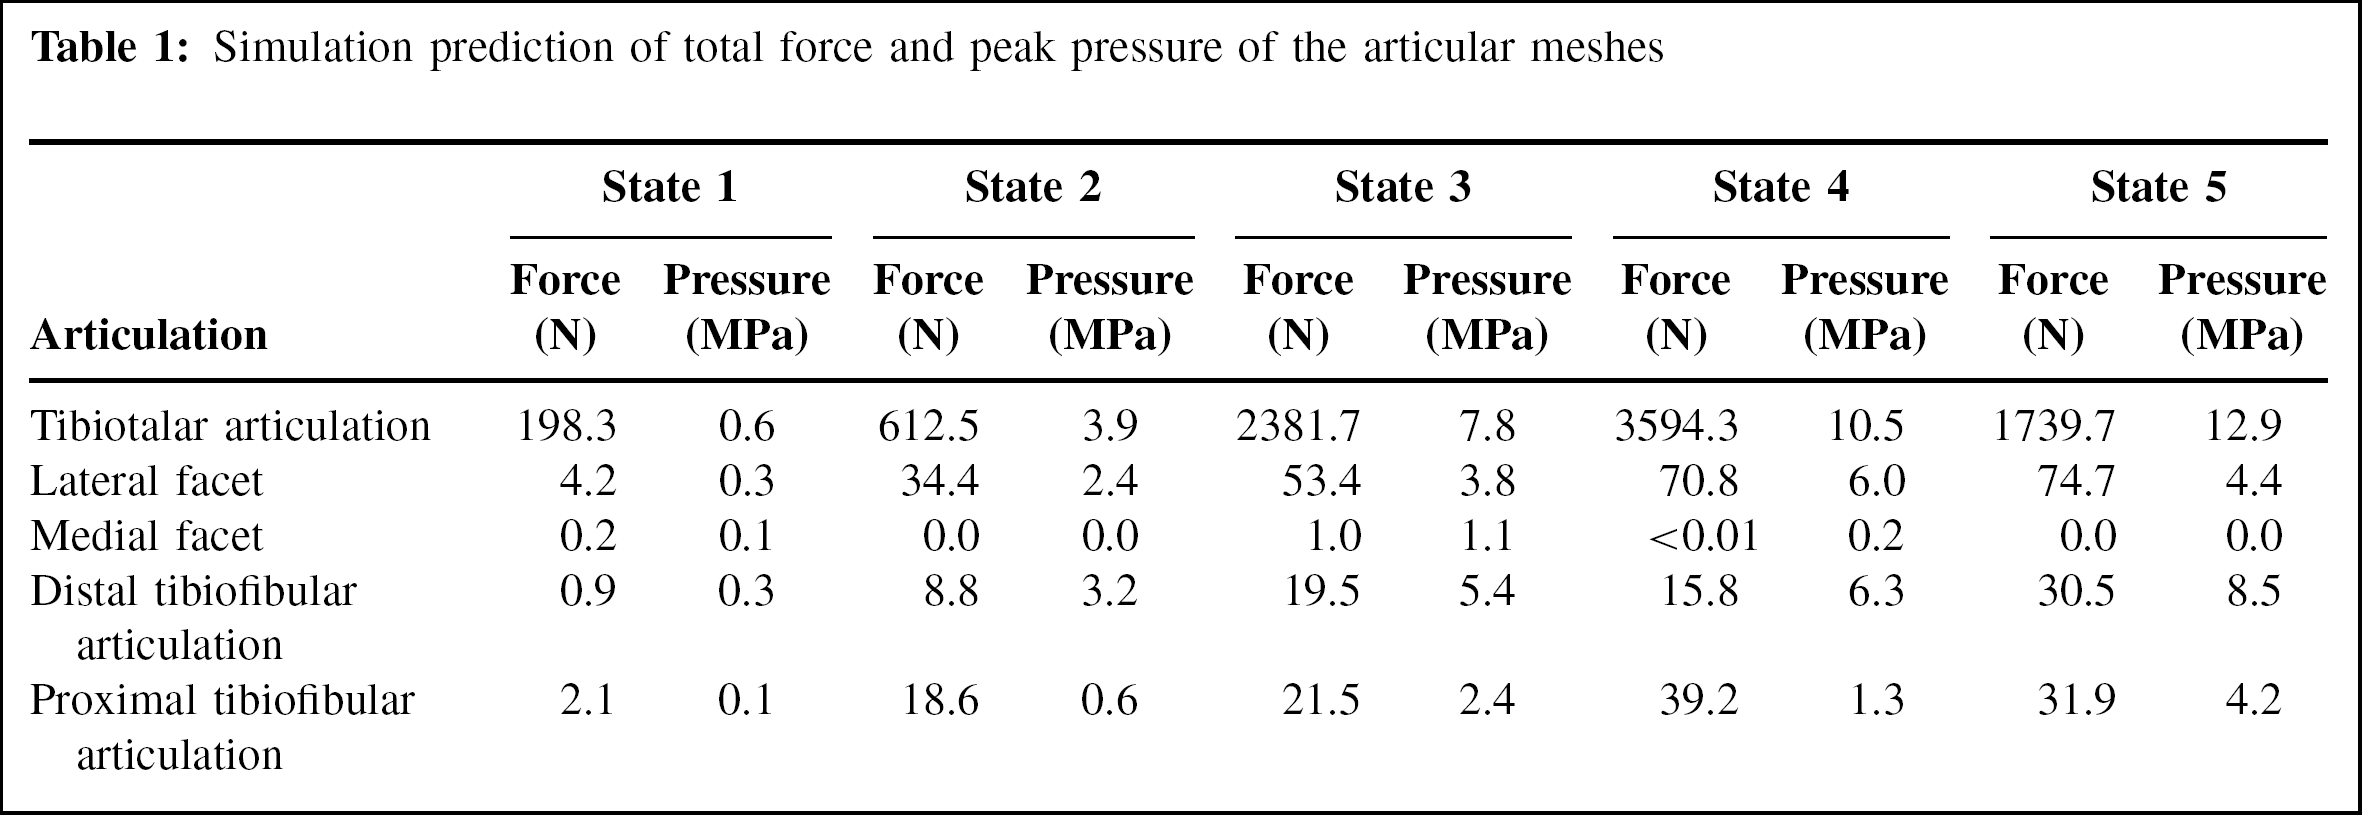
Tibiotalar articulation (Figure 3 and Table 1)
The tibiotalar articulation showed full congruency at each position modeled in the stance phase. Between heel-strike and foot-flat, a high pressure region of the tibiotalar contact mesh existed anteromedially. Between foot-flat and midstance with the ankle in the neutral position, a high-pressure region existed medially; this zone moved posteriorly as the stance phase progressed. Just before heel-rise, the peak pressure zone existed posterolaterally. Subsequently, peak pressure developed anteriorly toward the toe-off frame, and the posterior half of the tibial plafond did not bear weight. As the stance phase progressed, peak pressure of the tibiotalar articulation increased. The greatest magnitude of external force was applied during State 4 of the gait cycle; however the highest peak pressure within the talocrural joint was observed in State 5 because the joint load was distributed across a lesser contact area. The compressive forces in the lateral and medial facets were small during the entire stance phase. The force applied to the lateral facet increased as the stance phase progressed, but, again, the maximum applied force (State 5) did not coincide with the greatest peak pressure (State 4) for this articulation because of a reduction in contact area. In this model, the contact area of the lateral facet was located posteriorly throughout the stance phase. Loading of the medial malleolus was observed only in states 1 and 3, and the contact area of the medial facet existed anteriorly in these states. The compressive force of the medial malleolus during the stance phase was much smaller than that of the lateral malleolus. Force distribution between the tibial plafond, lateral facet, and medial facet was 97.74%, 2.25%, and 0.01%, respectively, throughout the stance phase.
Periankle ligament loading (Table 2)
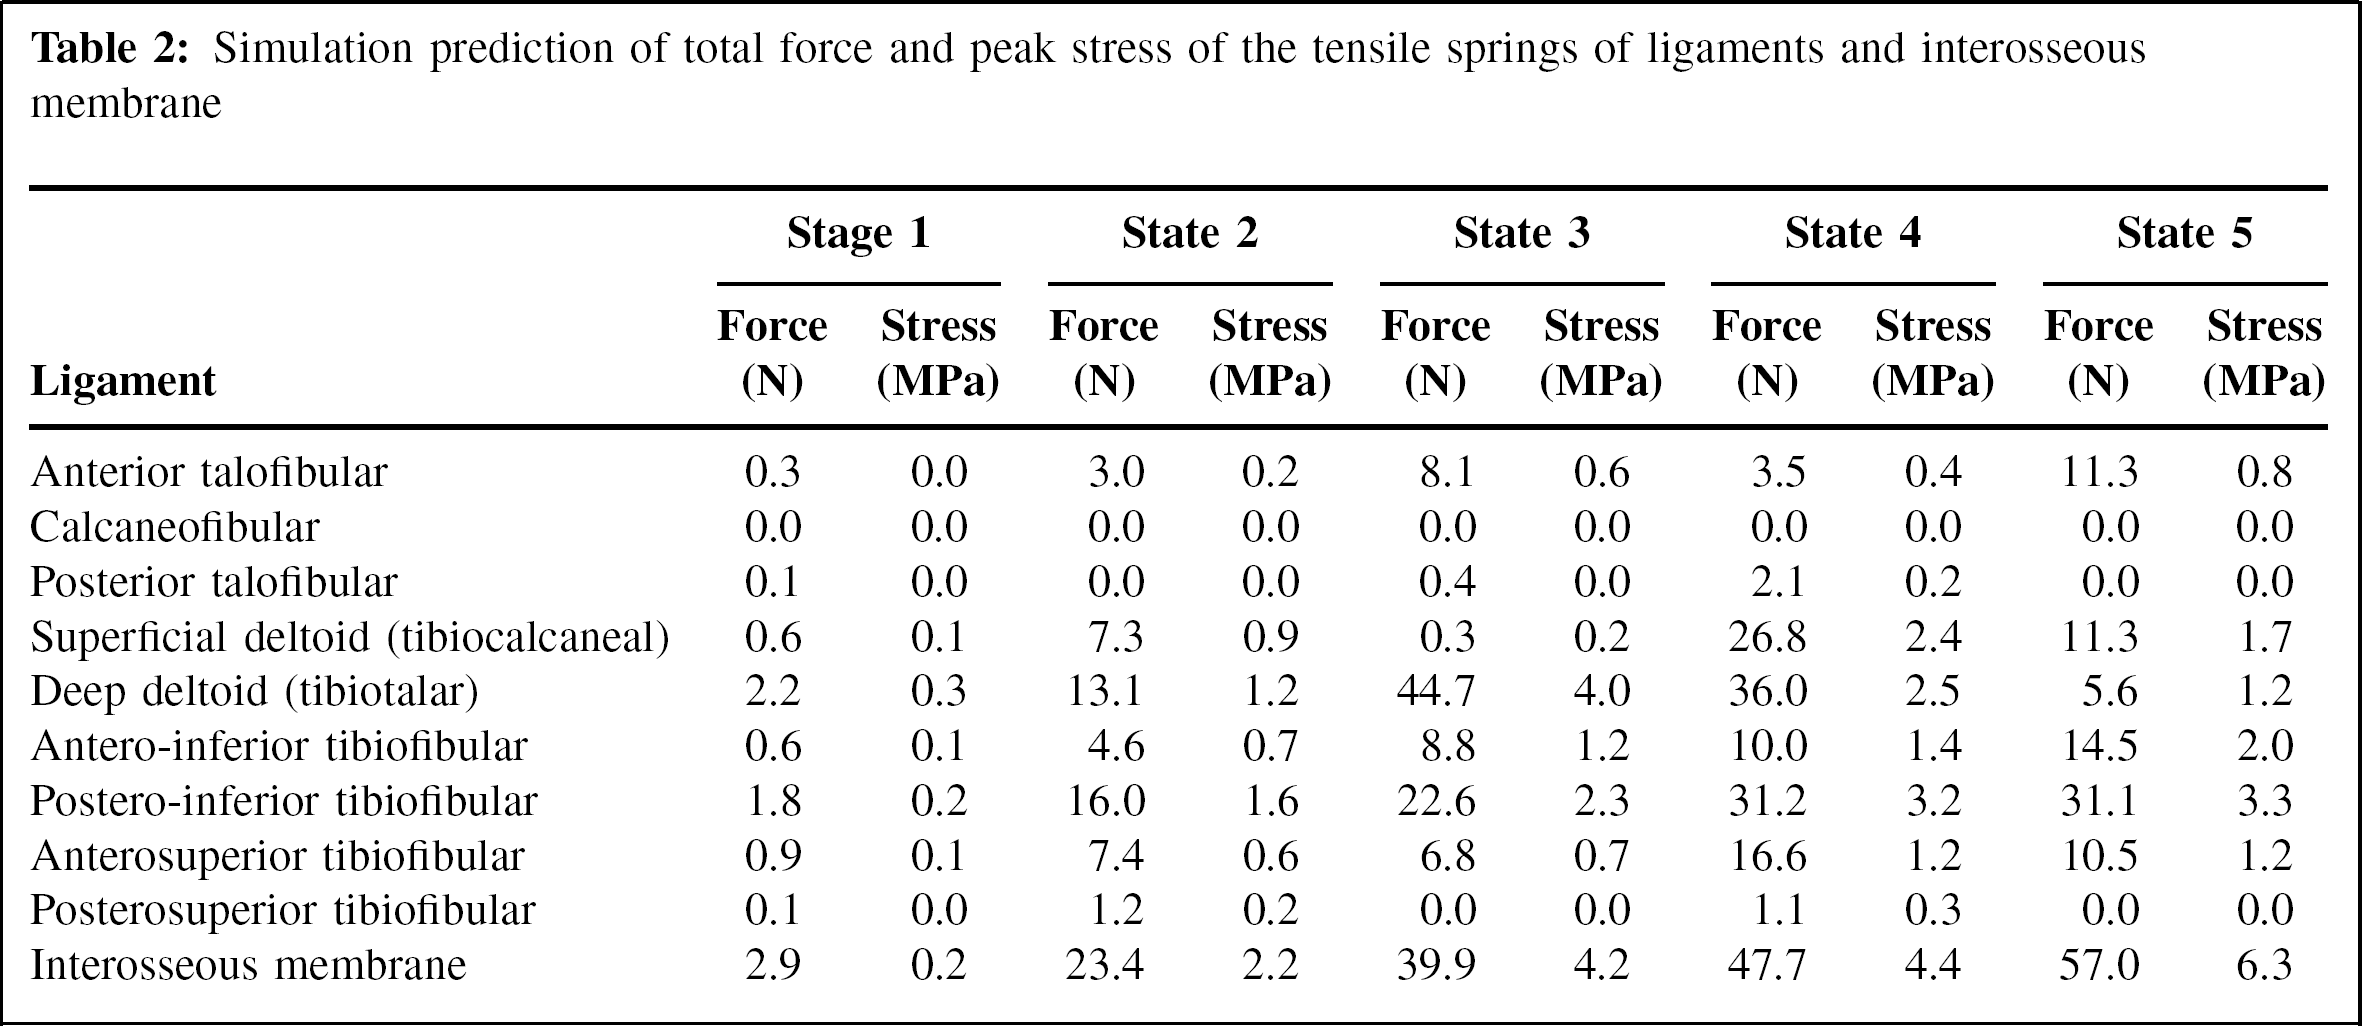
Among the five different states shown in Figure 2, the majority of force transfer via the periankle ligaments (lateral ankle ligaments and deltoid ligaments) was observed in State 4. Of the periankle ligaments, the deep deltoid ligament transferred the most force during the stance phase (57.2%); the superficial deltoid ligament transferred the second-most force (26.1%). Thus, the medial ligaments play a more important role than do the lateral ligaments in stabilizing the ankle joint during the stance phase of gait. The posterior talofibular ligament carried the most force in State 4 with the ankle in dorsiflexion. We observed that the anterior talofibular ligament transferred force continuously between the talus and fibula. The calcaneofibular ligament did not carry force during stance.
Transmission of force to the articular surface of the ankle and periankle ligaments (Tables 1 and 2)
The highest amount of force transmitted through the ankle joint during the stance phase was through the articular surfaces of the joint, whereas ligament tension was very low. The average force borne by the tibial plafond, lateral facet, and medial facet in states 1 to 5 was 1753.0 N, whereas the force within the periankle ligaments (lateral ankle ligaments and deltoid ligaments) was 35.4 N. The force transmitted through the periankle ligaments in State 1 was 1.6% of the total force transmitted through the ankle joint (State 2, 3.5%; State 3, 2.1%; State 4, 1.8%; and State 5, 1.6%), indicating that the periankle ligaments played their most important role in transmitting force between heel-strike and foot-flat.
Syndesmosis and interosseous membrane
The amount of compressive force in the distal tibiofibular articulation was small during the entire stance phase (Figure 3 and Table 1). In our model, the contact area of the distal tibiofibular articulation throughout the stance phase existed only at the anterior edge of the articulation. The distal tibiofibular ligaments and the interosseous membrane were loaded throughout the stance phase (Table 2), indicating that the function of these structures is to stabilize the fibula during gait. This finding also indicated that the interosseous membrane plays a role in transmitting the load of the fibula during normal walking. As the stance phase progressed, total force and peak stress of the interosseous membrane increased; the interosseous membrane had the greatest force and the highest peak stress in State 5. Total force and peak stress of the anterior and posterior distal tibiofibular ligaments also increased. These syndesmotic ligaments carried more force than the lateral ankle ligaments and deltoid ligaments during gait.
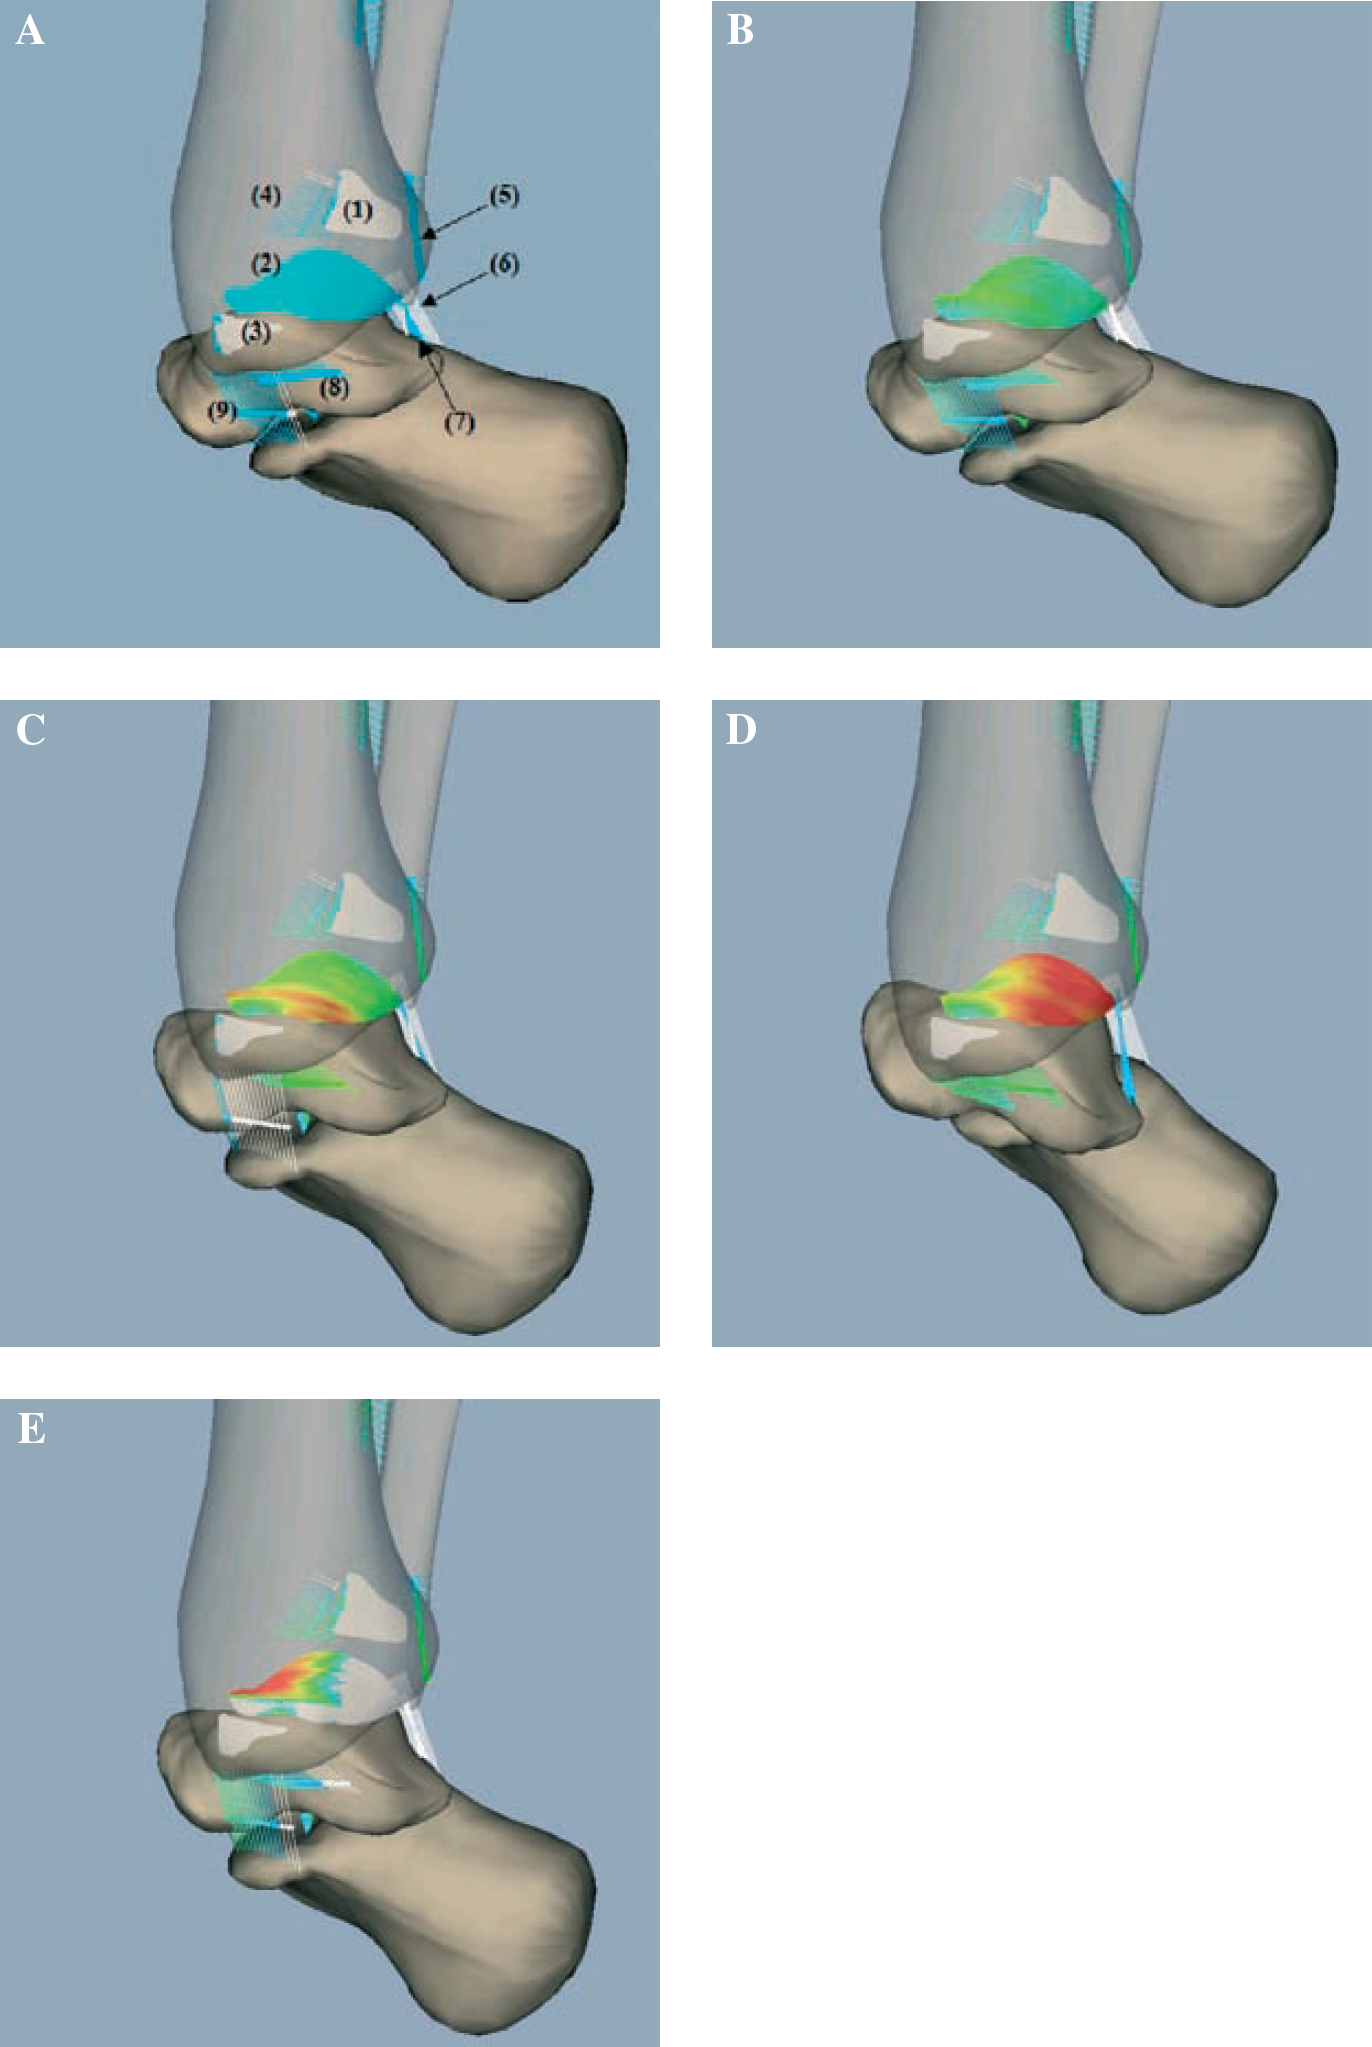
Contact characteristics and ligament tension of the ankle joint during phases of walking (posteromedial view).
Discussion
Contact characteristics of the ankle have been studied with two-dimensional pressure-sensitive film and pressure transducers in cadavers. 3,7,19,26,27,33,42,44 Such methods, however, have several limitations, including the cost of cadaver specimens and the inherent variability of their bony and soft tissue properties. Use of pressure-sensitive film or pressure transducers may be subject to shear stress, whereas soft-tissue dissection for the placement of pressure-sensitive film or transducers may alter ligmentous stability and make investigation of ligament loading unreliable. In addition, it is nearly impossible to quantify complex ankle joint kinematics throughout the gait cycle with experimental techniques. Because of these limitations, the DEA technique was developed as an elastic foundation model, 17 and it has been widely used and validated in the field of orthopedics. 12,14,16 The DEA technique offers the advantage of being a noninvasive, parametric tool that provides for fully animated, three-dimensional graphic visualization. The relation between the articular surface and periankle ligaments in providing ankle stability has been of major interest in the orthopedic community. Previous experimental studies 40,43 suggested that the articular surface is an important stabilizer and that the periankle ligaments do not act as principal stabilizing structures. Unfortunately, these studies applied only axial load as the primary loading condition because of the inherent difficulties in designing an experimental study. We applied physiologic loads approximating loads during normal walking and visualized the joint contact force and periankle ligament tension simultaneously, showing that, even under normal walking conditions, the major ankle joint loading was through the articular surface, even though the ligament tension was very low. To our knowledge, simultaneous analysis of the relation between joint contact force and periankle ligament tension in several states during gait has not been reported previously.
Simulation prediction of total force and peak pressure of the articular meshes
Simulation prediction of total force and peak stress of the tensile springs of ligaments and interosseous membrane
Chronic ankle instability due to lateral ligament insufficiency can increase localized joint contact stress and is suggested to be an etiologic factor in the development of ankle osteoarthritis. 15,35 However, some patients with lateral ligament insufficiency do not develop progressive joint degeneration. 6 Our study showed that force transmission through the ankle joint during the stance phase is predominantly through the articular surfaces, and the periankle ligaments do not play a major stabilizing role in constraining ankle motion. This suggests that ligament insufficiency alone does not lead to recurrent instability and also corroborates the findings of several studies, showing that, in addition to ligament insufficiency, other factors such as varus tilt of the tibial plafond or idiopathic cavovarus are important in the development of recurrent instability and subsequent ankle osteoarthritis. 13,23,41
Long-term follow-up studies showed excellent results with conservative treatment in patients with a displaced isolated fracture of the lateral malleolus without medial side injury. 2,20 The current study showed that the medial ligaments have a far more important role than do the lateral ligaments in stabilizing the ankle joint and support these clinical results. The loading patterns of the anatomical structures within our model are also consistent with the observation that a lateral malleolar fracture with deltoid ligament rupture should be treated with anatomical lateral fixation followed by immobilization without early motion, to allow adequate healing of the deltoid ligament at its resting length.
The functional role of the interosseous membrane has not received much attention. Lambert 21 conducted a strain gauge study of amputated legs and found that little of the load was transmitted by the interosseous membrane. Vukicevic et al. 45 performed holographic investigations and showed that complete destruction of the interosseous membrane unburdened the fibula in load transference by greater than 30% and concluded that the interosseous membrane is important in normal function of the lower leg. Skraba and Greenwald 37 applied axial loads to the strain-gauge-instrumented lower legs in positions ranging from 10 degrees dorsiflexion to 10 degrees plantarflexion and found that fibular strains decrease to zero after incision of the membrane. The authors concluded that the membrane acts as a conduit for stress transmission to the fibula. In our study, the interosseous membrane and distal tibiofibular ligaments were loaded throughout the stance phase. Based on these findings, future applications of this model should include investigations of the mechanism of syndesmosis screw breakage or loosening after open reduction and internal fixation of ankle fractures.
Several studies have investigated the contact characteristics of the ankle joint in different ankle positions. 7,11,24,26,31 In some studies, 7,26 as the ankle was moved from dorsiflexion to plantarflexion, the contact area decreased, with dorsiflexion producing the greatest area. In other studies, 11,24,31 the neutral position produced the greatest contact area. Direct comparison of these studies with our study, however, is difficult because of variations in methodology. In particular, most of the previous studies used only axial load for the specimens along with different ankle positions, whereas we applied approximate physiologic walking loads, which facilitated more realistic analysis of function of the ankle joint. Michelson et al. 28 reported that as the ankle dorsiflexed, there was progressive lateral loading of the tibiotalar articulation accompanied by a corresponding decrease in medial loading. The authors speculated that this finding was a consequence of the external rotation of the talus that occurs in dorsiflexion. Our results are in agreement with those of Michelson et al. 28 with regard to the trend in the center of the joint load. Calhoun et al 7 reported that as the ankle was moved from 30 degrees plantarflexion to 10 degrees dorsiflexion, the force distribution on the medial and lateral facets of the ankle joint increased progressively. Michelson et al. 28 reported that in 30 degrees plantarflexion to neutral positions, very little force was exerted between the talus and either the medial or lateral malleolus. Once the talus dorsiflexed up to 20 degrees above neutral, both locations showed a progressive increase in force. These findings are identical to ours.
The posterior talofibular ligament carried the most force in State 4 with the ankle in dorsiflexion, which was consistent with results of a previous study. 30 However, despite previous reports that the anterior talofibular ligament was continuously slack 43 or taut only in plantarflexion, 30 we observed that the anterior talofibular ligament transferred force continuously, even in ankle dorsiflexion (State 4). The calcaneofibular ligament did not carry force during stance, consistent with previously reported findings. 30
Our study did have some limitations. First, the loading conditions were calculated only for positions in the sagittal plane. The tangential force used was in the anterior-posterior direction only because the study from which we obtained loading conditions was two-dimensional (sagittal plane); thus, no external loading was applied in the mediolateral direction, nor was any bone except the fibula given complete freedom of motion. Therefore, we speculate that this model tends to underestimate the pressure and tension for the mediolateral direction. Second, there are far more tendons crossing the ankle than were considered in this study. Although the moment arms of the Achilles and anterior tibial tendons are much greater than the other tendons crossing the ankle joint, 22,34 oversimplification of tendons may also influence the study results. Third, the stiffness properties of the joint cartilage and some of the ligaments are not currently available and had to be extrapolated. Loading conditions and bone geometry also were all taken from different studies and thus came from different subjects. The non-homogeneity of data sets may influence the study results; sensitivity analysis is needed. Fourth, the model did not have complete freedom of motion of any bone except the fibula and was thus overconstrained. In particular, constraining the calcaneus and the talus in anteroposterior translation may have led to a tendency for this model to overestimate the pressure and tension for the anteroposterior direction. Fifth, because we assumed that the fibula was rigid, force in the distal tibiofibular ligaments and the interosseous membrane might have been overestimated. Finally, although previous experimental testing results agree with the general trend we observed, specific experimental testing with cadaveric specimens is needed to validate our results.
Conclusion
Most ankle joint loading during the stance phase occurred across the articular surfaces of the joint, and the amount of ligament tension was small. The medial ligaments were shown to have more load transfer and hence to have a more important role than the lateral ligaments in stabilizing the ankle joint. The DEA technique is an efficient method for predicting joint contact pressure and ligament tension simultaneously without the need for determining stresses of bones with complex geometric characteristics. This information contributes to the basic understanding of the function of the ankle joint and provides a basis for computerized simulations of abnormal conditions of the ankle.