
Abstract
Background: Standard prevention and treatment strategies to decrease peak plantar pressure include a total contact insert with a metatarsal pad, but no clear guidelines exist to determine optimal placement of the pad with respect to the metatarsal head. The purpose of this study was to determine the effect of metatarsal pad location on peak plantar pressure in subjects with diabetes mellitus and peripheral neuropathy. Methods: Twenty subjects with diabetes mellitus, peripheral neuropathy, and a history of forefoot plantar ulcers were studied (12 men and eight women, mean age = 57 ± 9 years). CT determined the position of the metatarsal pad relative to metatarsal head and peak plantar pressures were measured on subjects in three footwear conditions: extra-depth shoes and a 1) total contact insert, 2) total contact insert and a proximal metatarsal pad, and 3) total contact insert and a distal metatarsal pad. The change in peak plantar pressure between shoe conditions was plotted and compared to metatarsal pad position relative to the second metatarsal head. Results: Compared to the total contact insert, all metatarsal pad placements between 6.1 mm to 10.6 mm proximal to the metatarsal head line resulted in a pressure reduction (average reduction = 32 ± 16%). Metatarsal pad placements between 1.8 mm distal and 6.1 mm proximal and between 10.6 mm proximal and 16.8 mm proximal to the metatarsal head line resulted in variable peak plantar pressure reduction (average reduction = 16 ± 21%). Peak plantar pressure increased when the metatarsal pad was located more than 1.8 mm distal to the metatarsal head line. Conclusions: Consistent peak plantar pressure reduction occurred when the metatarsal pad in this study was located between 6 to 11 mm proximal to the metatarsal head line. Pressure reduction lessened as the metatarsal pad moved outside of this range and actually increased if the pad was located too distal of this range. Computational models are needed to help predict optimal location of metatarsal pad with a variety of sizes, shapes, and material properties.
Keywords
INTRODUCTION
People with diabetes mellitus and peripheral neuropathy are at high risk for developing ulcers beneath the metatarsal heads. 3,4,22 The most common cause of plantar ulcers is high, localized pressure combined with the inability to sense pain. 3,4,5 Once skin injury occurs, individuals often do not make the appropriate activity modifications to prevent further injury and allow healing. 3,4,5,19
Conservative treatment to prevent plantar ulcers includes accommodative shoes and a total contact insert. The total contact insert is designed to follow the contour of the foot, loading areas of the foot that have low pressure during weightbearing (e.g. medial arch of the foot) while decreasing the pressure in areas of high pressure, generally the metatarsal head. A total contact insert has been found to significantly decrease heel and metatarsal pressure during walking. 2,6,16 However, it has been our experience that often a total contact insert alone does not sufficiently reduce pressure to prevent re-ulceration. 17
A common modification to a total contact insert to further reduce metatarsal head pressure is the addition of a metatarsal pad. The intent of the metatarsal pad is to shift the load from the metatarsal head to the shaft of the metatarsal and surrounding tissue, decreasing the pressure at the metatarsal head. Clinical experience and experimental investigations have generally supported the use of a metatarsal pad to reduce pressure while highlighting the importance of correct positioning of this metatarsal pad to maximize pressure reduction at the metatarsal head. Holmes and Timmerman 14 demonstrated that in asymptomatic women a metatarsal pad located proximal to the metatarsal head reduced metatarsal head pressure between 12% and 60%. 14 Pressure reduction at the metatarsal head was not as consistent in men in this study, and the metatarsal pad placement had to be adjusted for each individual to maximize pressure relief, highlighting the trial and error associated with metatarsal pad placement. Hayda et al. 13 found that placing the metatarsal pad 5 mm distal to the metatarsal head reduced pressure more (16.5%) than placing the metatarsal pad 5 mm proximal (11.5%) in asymptomatic feet of men and women. Ashry et al. 2 and Chang et al. 8 found that the addition of a metatarsal pad placed proximal to the metatarsal head failed to significantly lower pressure at the metatarsal head in a group of subjects with diabetes and a group of healthy men, respectively. Mueller et al. 16 found that a total contact insert and a metatarsal pad placed approximately 1 cm proximal to the metatarsal heads reduced metatarsal head peak plantar pressure by 15% to 20% compared to using a total contact insert alone in subjects with diabetes mellitus, peripheral neuropathy and a history of ulcer. 16 In all of these studies, the researchers found considerable variability in individual response to inclusion and location of a metatarsal pad.
One of the limitations of previous research is the lack of radiographic information to verify metatarsal pad placement relative to the metatarsal head. The purpose of this study was to use CT to determine metatarsal pad placement relative to the second metatarsal head and assess the relationship between metatarsal pad placement and the change in pressure.
MATERIALS AND METHODS
Subjects
Twenty subjects were studied, 12 men and eight women (mean age = 57.3 ± 9.3 years) between March, 2003, and January, 2005. The group consisted of individuals with diabetes mellitus (mean duration = 16.1 ± 10.5 years) and peripheral neuropathy (loss of protective sensation [5.07 Semmes-Weinstein monofilament test], vibratory perception threshold of more than 25 V, and prior neuropathic plantar ulcer). 20 Subjects were excluded if they were nonambulatory or if the tested extremity had an active plantar ulceration, an amputation, a nonpalpable pulse, or severe midfoot or hindfoot Charcot neuroarthropathy. The procedures were explained to the subject, and a signed consent form was obtained prior to testing.
The mean body mass index of the subjects was 32.5 ± 7.4 kg/m2, indicating that on average our subjects were obese. Peripheral neuropathy was assessed using Semmes-Weinstein monofilaments following a previously described technique. 10 Our subjects lacked protective sensation as defined by the inability to feel the 5.07 Semmes Weinstein monofilament on at least two sites on the plantar foot. A biothesiometer (Biomedical Instrument, Newbury, OH, USA) was used to assess vibratory perception threshold. The head of the biothesiometer was held perpendicular to the plantar surface of the great toe. The amplitude of the vibration was increased gradually and the lowest voltage or smallest vibration the subject could perceive was recorded. The mean of three trials was calculated and described as the vibratory perception threshold. 7,20 Subjects who were unable to perceive vibration at the maximal voltage produced by the biothesiometer (50 V) were assigned a value of 50 V. The mean value for this group was 48.3 ± 4.1 V indicating a severe level of peripheral neuropathy. 20
Shoes
The subjects were tested in three shoe conditions: extra-depth shoes (Soletech, Advanced Orthopedic Footwear, style number E3010) and a 1) total contact insert, 2) total contact insert and a proximal metatarsal pad (PROX), and 3) total contact insert and a distal metatarsal pad (DIS). One certified pedorthist (18 years of experience) or one certified orthotist (17 years of experience) fit the subjects with the appropriate size shoe, fabricated a custom total contact insert, and determined the appropriate size metatarsal pad. The fabrication methods for the total contact insert have been reported in detail, 16 but, briefly, a foam impression of the foot was taken and the total contact insert was made of #2 plastizote. The metatarsal pad was made of cork with a shore value equal to 55 and was fabricated in three sizes. Length varied from 66 to 74 mm, width varied from 51 to 63 mm, and the maximal height measure 9 to 10 mm. 16 The metatarsal pad size was selected so that it covered the central three metatarsals. The proximal and distal metatarsal pad placements were determined by the pedorthotist or orthotist who drew a line identifying the metatarsal head. The distal metatarsal pad was placed with the distal aspect of the metatarsal pad at the metatarsal head line. The proximal metatarsal pad was 1 cm proximal (toward the heel) to the metatarsal head line. A self-adhesive X-Spot lead marker (Beekley Spots, Beekley Corporation, Bristol, CT) was placed at the peak of the metatarsal pad (approximately 1 cm from the distal aspect of the metatarsal pad) to allow accurate localization in the CT data.
Plantar Pressure Assessment
Plantar pressure data were collected in the three shoe conditions during walking and CT data acquisition using the F-Scan system (Software v. 3.847, Tekscan, Boston, MA). The procedure for pressure testing has been described previously. 9,12 Briefly, the F-Scan sensor was trimmed to fit the subject's tested foot and three self-adhesive X-Spot lead markers were placed on the pressure sensor to provide reference markers on the CT data. The sensor was taped onto the bottom of the subject's barefoot. A thin sock was placed over the foot and sensor. The sensor was calibrated following the F-Scan system manufacturer's recommendations and using standardized techniques. 12
The order of testing for the three shoe conditions was determined randomly using a prearranged schedule. The subjects were timed as they walked at their preferred walking speed across a 6.1 m (20 ft) walkway and pressure data were collected at 50 Hz.
CT Data Assessment
After the subjects completed the pressure testing during walking in a particular shoe condition, a CT scan (Somatom Sensation 16, Siemens Medical Systems, Inc, Iselin, NJ) was completed in that condition. The procedures and accuracy of positioning and testing of the subjects during the CT scan have been reported previously. 9,18 Briefly, subjects were positioned in a manner to replicate the push-off phase of walking (portion of gait with the highest forefoot pressures). 15 The subjects sat on a loading device on the CT table with the foot positioned so that only the forefoot was in contact with the plate. The subjects were instructed to press against the plate with a force equal to 50% of their body weight using a digital scale to guide the subject's force. F-scan data were collected simultaneously and compared to the pressure distribution collected at push-off during the walking trial for that shoe condition. The subject was provided verbal feedback while completing the CT testing to maximize replication of the force distribution obtained during the walking trial. CT data were registered to F-scan data, following procedures previously reported. 12 Analyze software (Mayo Foundation, Biomedical Imaging Resource, Rochester, MN, USA) was used to determine and measure the coordinates of the center of the second metatarsal head and the location of the metatarsal pad relative to the second metatarsal head. 21 The second metatarsal head coordinates from the CT scan were used to determine peak plantar pressure localized to the second metatarsal head (Figure 1).
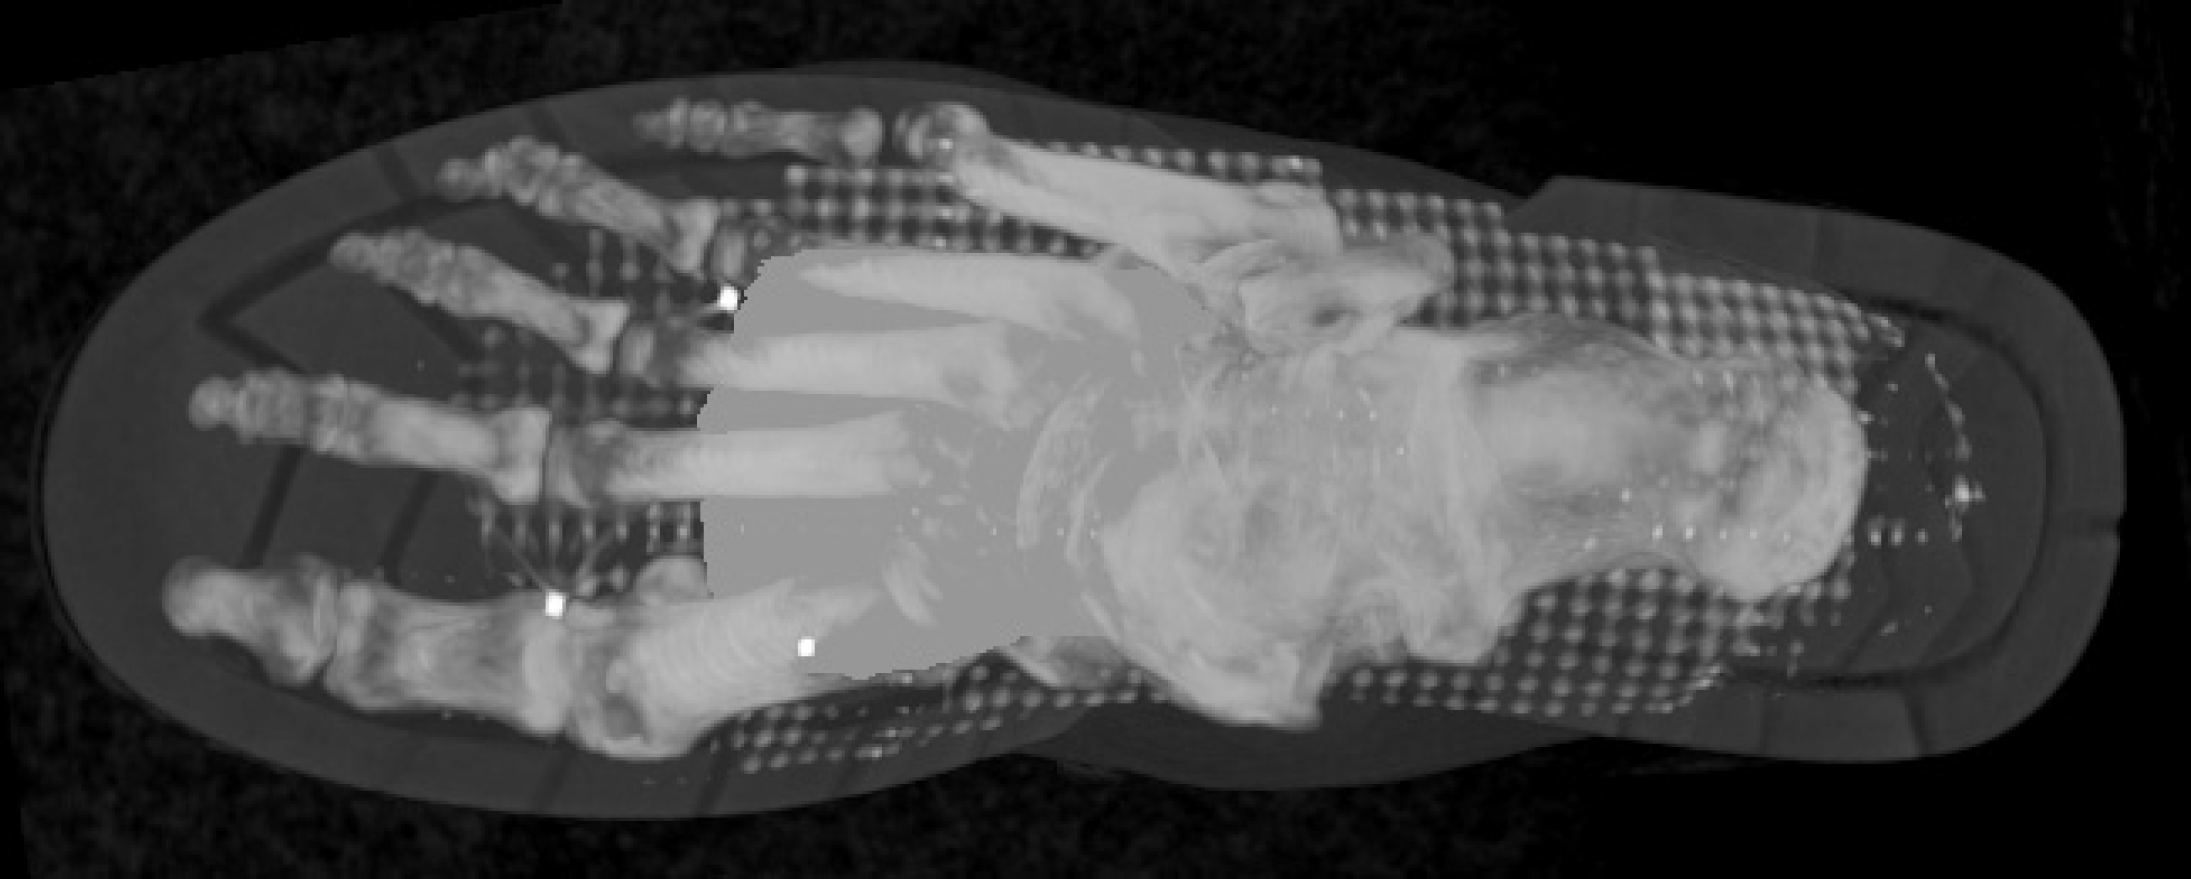
CT scan of subject with bony anatomy, metatarsal pad, F-scan sensor grid, and X-Spot lead markers (bright dots in the forefoot) visible.
DATA ANALYSIS
The change in peak plantar pressure between the total contact insert only condition and the proximal and distal metatarsal pad conditions relative to the distance of the metatarsal pad from the second metatarsal head were graphed. A second order polynomial curve was fit to the data, and the quality of fit was measured with a coefficient of determination (r 2 ) and statistical significance (p < 0.05). The difference in walking speed during each condition was tested with a paired t-test (p < 0.05).
RESULTS
The average location of the metatarsal pad relative to the second metatarsal head, as measured with the CT, was consistent with the intended placement (Figure 2). The average distal placement was 0.1 ± 6.3 mm and the proximal placement was 9.6 ± 6.4 mm from the metatarsal head line. Although the average metatarsal pad placement was consistent with expectations, there was high variability between individual placements. The most distal placement was 10.97 mm distal to the metatarsal head and the most proximal placement was 21.8 mm proximal to the metatarsal head. The variability of placement resulted in a relatively continuous distribution of metatarsal pad placements allowing us to combine the groups and assess the effect of metatarsal pad placement on peak plantar pressure under the second metatarsal head (n = 40).
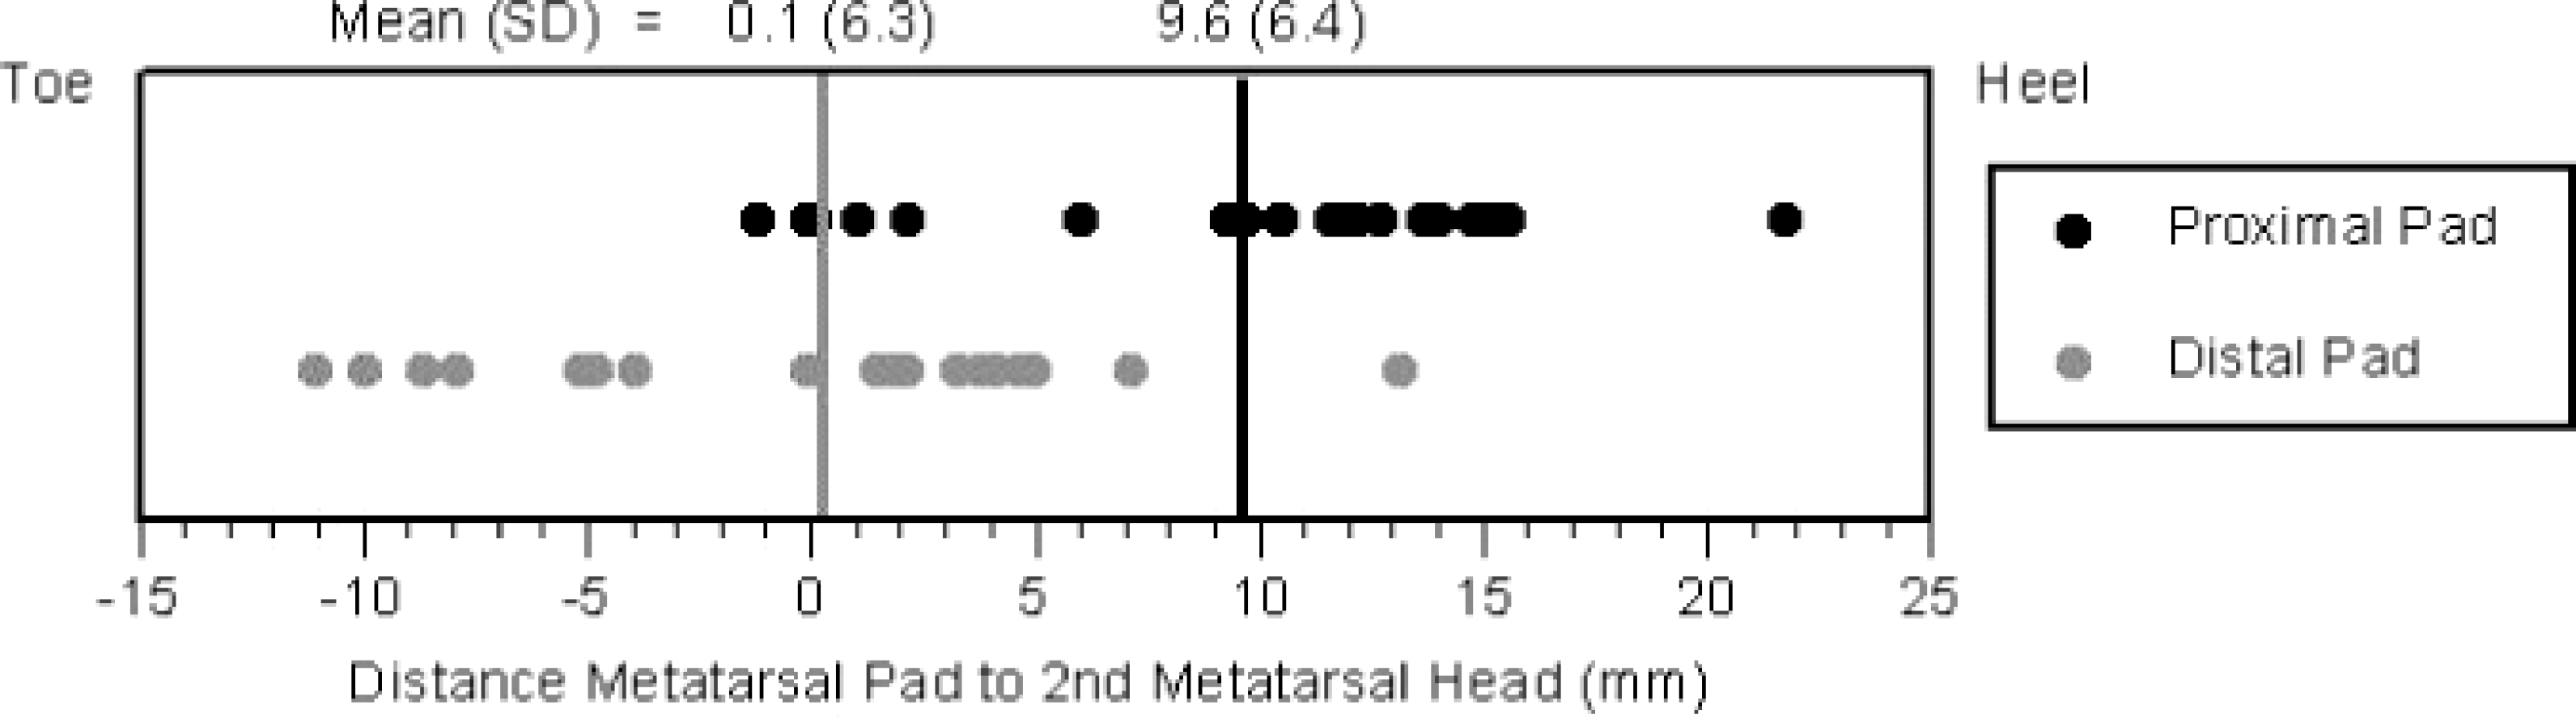
The mean location of the metatarsal pad relative to the second metatarsal head corresponded with intended placement. However, the large standard deviation in metatarsal pad location indicates the difficulty in consistently placing the metatarsal pad in the intended location.
The distribution of pressure reduction in relation to metatarsal pad placement indicated consistent peak plantar pressure reduction at the second metatarsal head when the metatarsal pad was placed between 6.1 to 10.6 mm proximal to the metatarsal head line (average reduction 32 ± 16%) (Figure 3). Peak plantar pressures were generally reduced, but variable, at the second metatarsal head when the metatarsal pad was located between the range of 1.8 mm distal to 6.1 mm proximal and 10.6 and 16.8 mm proximal of the metatarsal head line (average reduction 16 ± 21%). Greatest peak plantar pressure reduction (57%) at the second metatarsal head occurred when the distal aspect of the metatarsal pad was 10.6 mm proximal to the metatarsal head line. The peak plantar pressure at the second metatarsal head increased when the metatarsal pad was located outside the range of 1.8 mm distal of the metatarsal head line and 16.8 mm proximal to the metatarsal head line. The quality of fit of the second order polynomial curve was statistically significant (r 2 = 0.44, p < 0.0001).
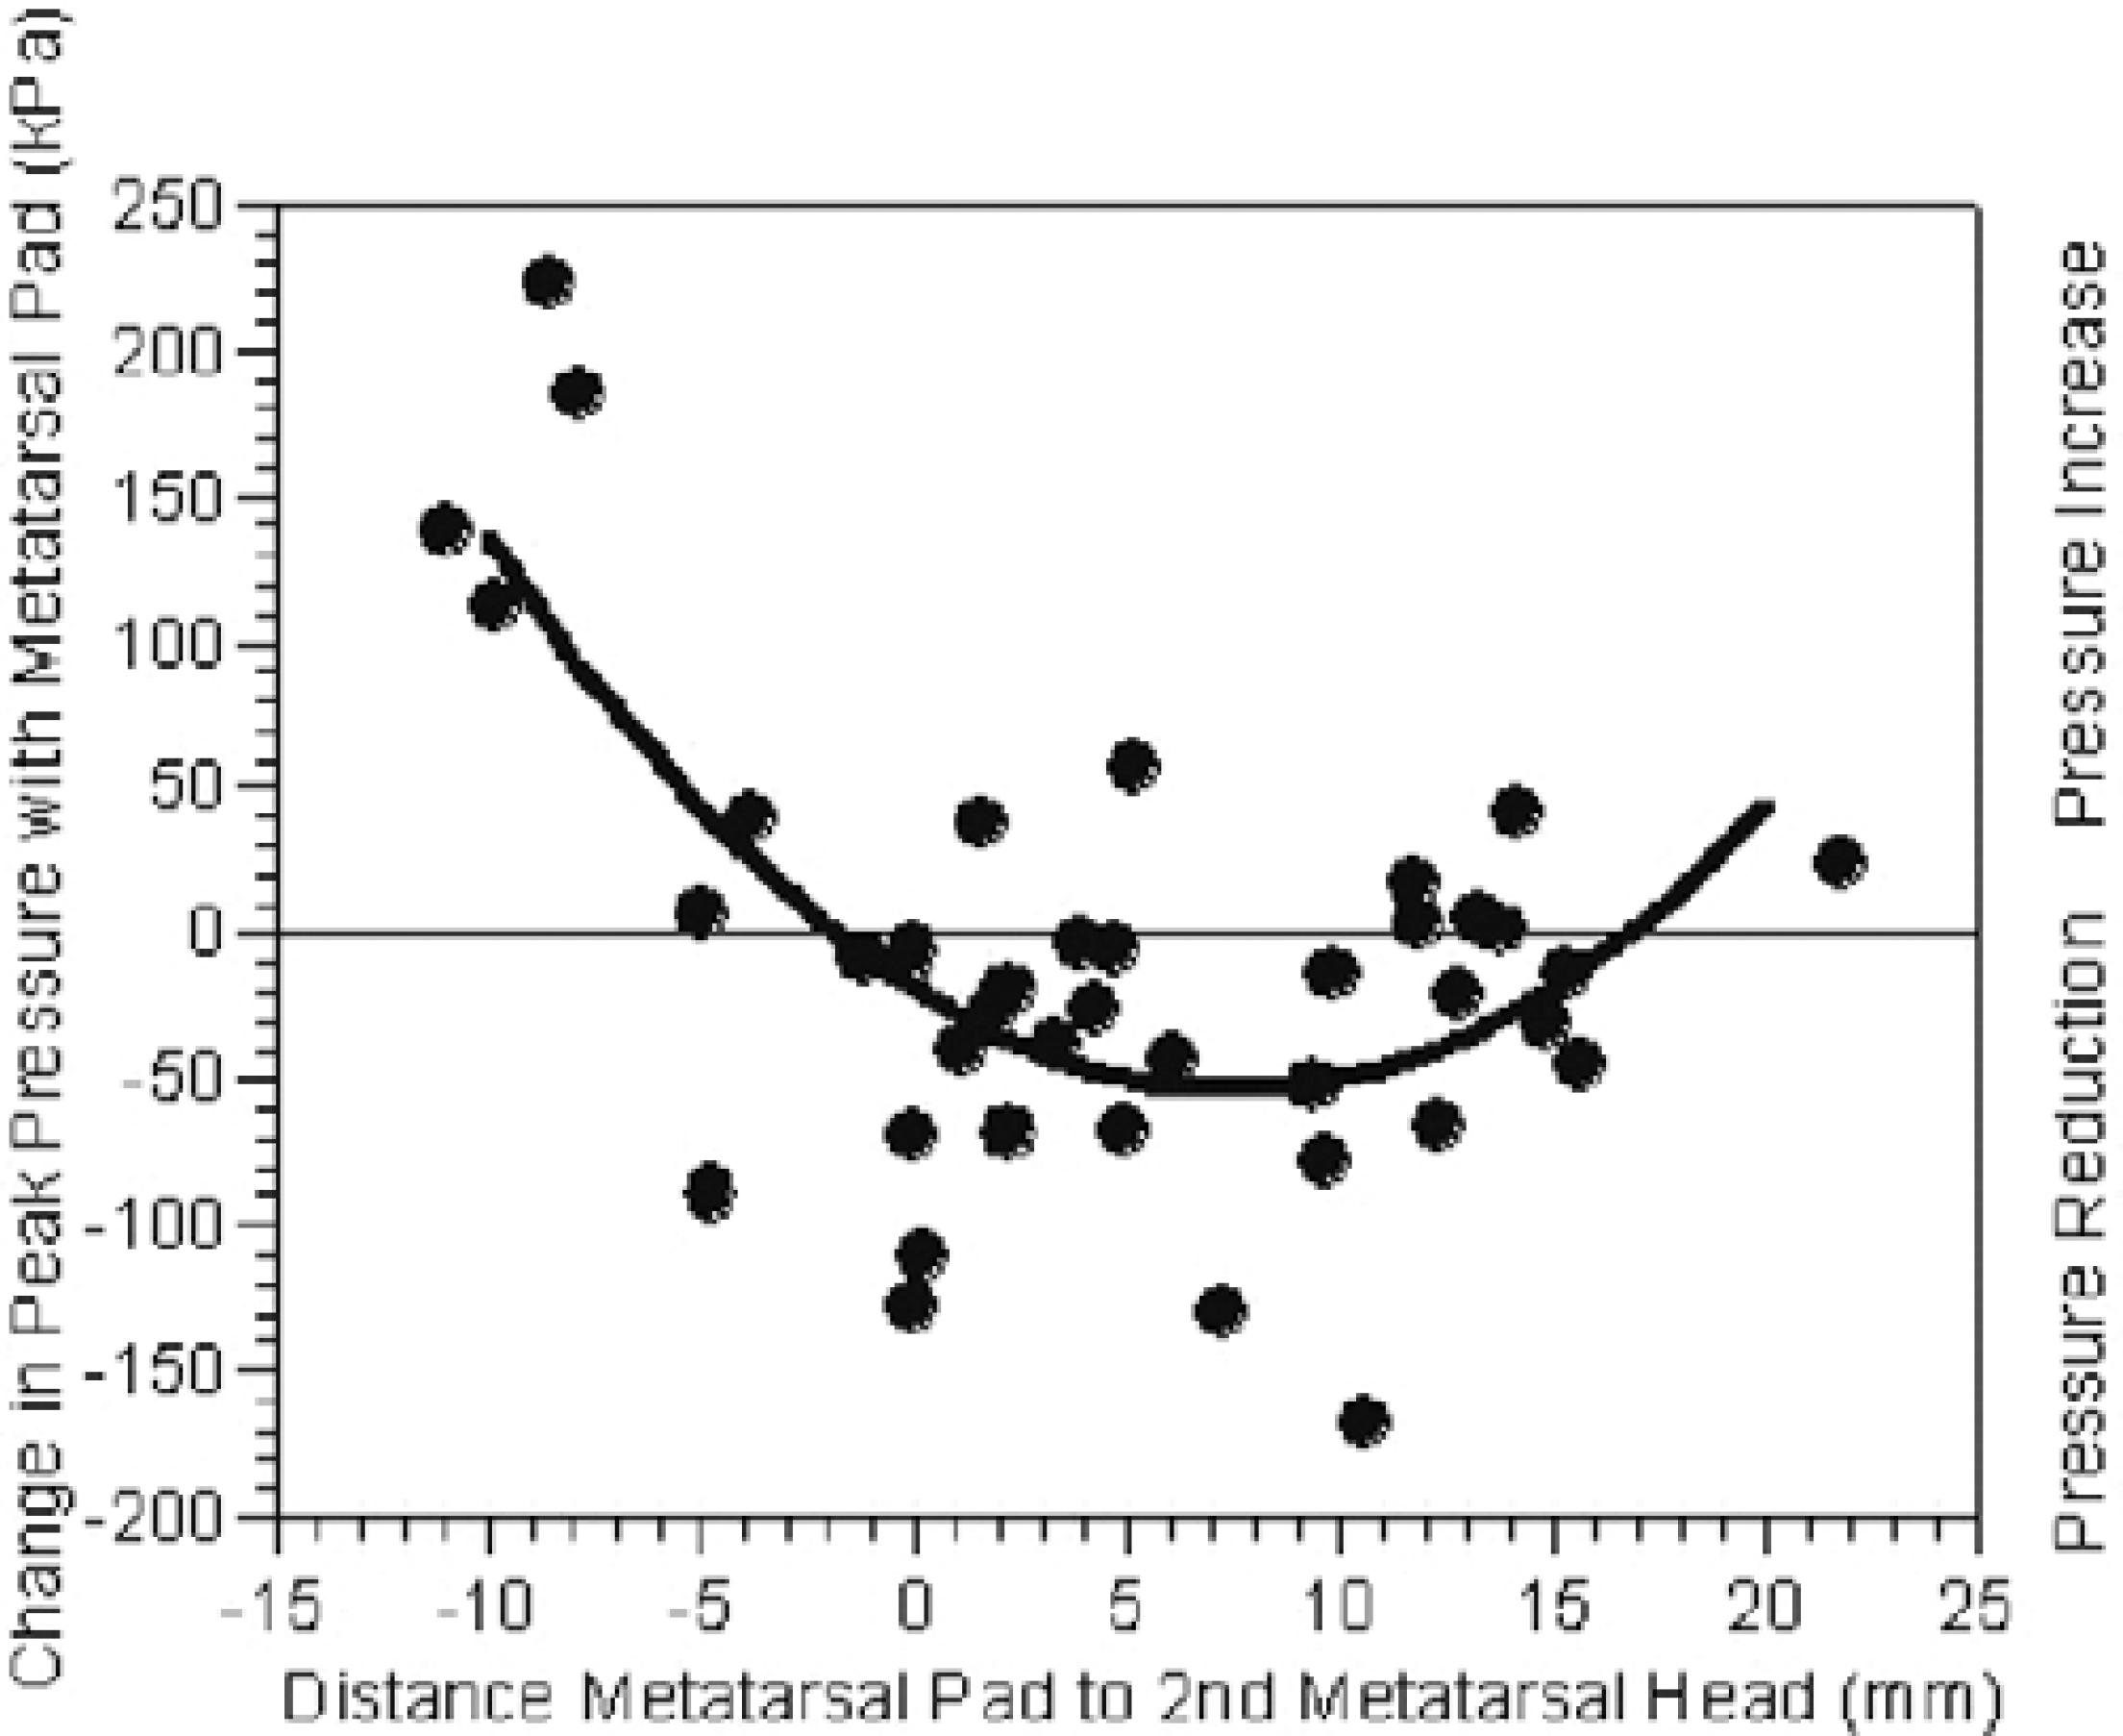
Change in peak plantar pressure relative to the metatarsal pad location. Peak plantar pressure was consistently reduced when the metatarsal pad was placed approximately 6 to 11 mm proximal to the metatarsal head. Pressure reduction was generally reduced, but variable, when the metatarsal pad was located between 2 mm distal and 6 mm proximal and 11 to 17 mm proximal. Pressure increased when the metatarsal pad was placed more distal than 2 mm from the metatarsal head (kPa).
The walking speeds for each condition were total contact insert-0.95 m/sec, PROX-0.93 m/sec, and DIS-0.94 m/sec. There were no differences in walking speed between footwear conditions (p > 0.05).
DISCUSSION
With the use of CT we were able to localize and measure the specific distance of the metatarsal pad from the center of the metatarsal head. Results of this study indicate that pressure is consistently reduced when the metatarsal pad is placed between 6 mm and 11 mm proximal to the metatarsal head line. This is a fairly narrow range (less than 5 mm) and located slightly more proximal than previous studies have shown. 8,13 There is a larger range of metatarsal pad locations, spanning 15 mm, that resulted in a reduction of pressure for most individuals. However, within the 15 mm range there was large variability in individual response, and pressure increased for some individuals with the addition of the metatarsal pad. The amount of pressure relief necessary for symptom relief is variable in any condition and would likely be specific to that individual. However, in people with diabetes mellitus, peripheral neuropathy, and a history of ulcers, maximal pressure reduction is of utmost importance in the prevention of ulcers and minimizing ulcer recurrence. 19,20
Despite extensive academic and clinical training and specific instructions regarding metatarsal pad placement, it was difficult for the pedorthotist or orthotist to consistently place the metatarsal pad in the intended position. In both the proximal and distal metatarsal pad conditions the range of actual locations varied by more than 12.0 mm, 6 mm in each direction. The inability to consistently locate the metatarsal pad given specific directions is important for interpreting previous research results. Variability in previous study findings 2,8,13,14 regarding optimal metatarsal pad location and variability in pressure reduction with the use of a metatarsal pad may be related to the inherent lack of accuracy in positioning a metatarsal pad. Clinically, it is important that health care providers recognize the challenge of placing a metatarsal pad in a location that will optimize pressure reduction. It is critical, particularly in a population of insensate individuals, that the orthosis and the individual's foot are assessed soon after the orthosis is dispensed. Clinical signs that the metatarsal pad is adequately reducing pressure would be the absence of redness or callus on the skin under the metatarsal head and lack of large indentations in the total contact insert material under the metatarsal head. Additionally, because of the trial and error involved in optimal metatarsal pad placement, it would seem important that the metatarsal pad be placed extrinsic to the orthosis, not imbedded within the orthosis material, so that modifications can be made without damaging the integrity of the total contact insert.
For radiologic viewing and to assure a statistically important change, we used a metatarsal pad that was thicker and stiffer than that which generally is used in clinical practice. The application of our results to another population or to a metatarsal pad that varies in size, shape, or material properties is a limitation. The variability of human anatomy and the plethora of options for metatarsal pad specifications, however, highlight the potential of future ventures involving finite element analysis of the foot. A computational model would allow the input of individual anatomical information and orthosis and tissue material properties to assess their effect on pressure reduction through metatarsal pad location and material selections. 1,11 Advances in computational modeling have the potential to remove much of the trial and error associated with fabrication of orthotic devices.