
Abstract
Background:
Osteochondral lesions of the talus (OLT) are a common and challenging condition treated by the orthopedic foot and ankle surgeon. Multiple operative treatment modalities have been recommended, and there are several factors that need to be considered when devising a treatment plan. In this study, we retrospectively reviewed a group of patients treated operatively for osteochondral lesions of the talus to determine factors that may have affected outcome.
Methods:
A retrospective chart review of clinical, radiographic and operative records was performed for all patients treated for OLTs via marrow stimulation technique. All had a minimum followup of 6 months or until return to full activity, preoperative magnetic resonance imaging (MRI) of the OLT to determine size, and failure of nonoperative treatment.
Results:
A total of 130 patients were included in the study. This included 64 males and 66 females. The average patient age at the time of surgery was 35.1 ± 13.7 (range, 12 to 73) years. The average followup was 37.2 ± 40.2 (range, 7.43 to 247) weeks. The average size of the lesion was 0.84 ± 0.67 cm2. There were 20 lesions larger than 1.5 cm2 and 110 lesions smaller than 1.5 cm2. There were 113 contained lesions and 17 uncontained lesions. OLTs larger than 1.5 cm2 and uncontained lesions were associated with a poor clinical outcome.
Conclusions:
The treatment of osteochondral lesions of the talus remains a challenge to the foot and ankle surgeon. Arthroscopic debridement and drilling will often provide satisfactory results. However, larger lesions and uncontained lesions are often associated with inferior functional outcomes and may require a more extensive initial procedure.
Level of Evidence: IV, Retrospective Case Series
Keywords
INTRODUCTION
Osteochondritis dissecans was originally described by Konig in 1888,27 while Kappis is credited with the first description of these lesions in the ankle in 1922.26 Osteochondral lesions of the talus (OLT) are quite common, and are believed to occur after 2% to 6% of all ankle sprains. 11,32,34 A high incidence has been reported following ankle fractures as well.1 OLTs also occur in patients without a history of trauma. A difference in mechanical properties between the articulating surfaces of the tibial and talar regions, with tibial cartilage significantly stiffer than talar cartilage, may contribute to the development of OLTs due to repetitive microtrauma.5 The true incidence may be under-reported, however, since the incidence of a missed or delayed diagnosis of OLT in patients with unexplained chronic ankle pain has been reported to be as high as 81%.18 A 10% incidence of bilaterality has also been reported. 11,12,23
Treatment options for these lesions vary. Nonoperative treatment, consisting of immobilization and physical therapy, has a reported success rate of 45% to 50%. 31,33,35 Operative intervention has been reported to have better success rates. 33,35 Multiple operative treatment modalities have been recommended. These include excision, excision with curettage, excision with debridement and drilling or microfracture, osteochondral grafting using autograft or allograft, and autologous chondrocyte implantation. 2,4,6 –10,19,22
Marrow stimulation techniques such as drilling and microfracture are often considered as first-line operative treatment of OLTs, and have had satisfactory results. In the meta-analysis by Tol et al., excision with curettage and drilling had an 85% success rate.33 A more recent review reported an 87% success rate with excision, curettage and drilling, including an 84% success rate with open and 87% success rate with arthroscopic procedures.35 Results with excision only or excision and curettage were less satisfactory, with 38% and 76% success rates, respectively.33
The size of the lesion may have an effect on patient outcomes, as larger lesions can alter the contact stresses of the ankle joint. Recent reports have shown that larger OLTs are associated with higher clinical failure rates. 13,15 To our knowledge, no other reports correlating OLT size with clinical outcome following operative treatment exist. The purpose of the current study was to review the outcomes of patients treated surgically for OLTs and to determine variables associated with poor outcomes. It was our hypothesis that larger OLTs would have inferior clinical outcomes.
MATERIALS AND METHODS
A retrospective chart review of clinical, radiographic, and operative records was performed on patients treated surgically for OLTs at our institution from May 1, 2003 to December 31, 2006. One hundred eighty-nine consecutive patients were initially identified. All patients failed initial conservative care and subsequently underwent operative intervention. Inclusion criteria included the presence of an OLT that was treated via marrow stimulation technique, a minimum followup of 6 months or until return to full activity, preoperative magnetic resonance imaging (MRI) of the OLT to determine size, and failure of nonoperative treatment. Those patients treated by methods other than marrow stimulation, no preoperative MRI, previous surgical treatment for the OLT, or diffuse arthritic changes of the ankle joint on plain radiography were excluded from the study. Based on these criteria, 130 patients were included in the study.
Surgical treatment consisted of marrow stimulation technique via arthroscopic or open method. This involved debridement and curettage of any unstable cartilage flaps or fragments until a stable rim of intact articular cartilage was defined. This was followed by marrow stimulation on the exposed lesion via microfracture, drilling, or abrasion chondroplasty. If the cartilage cap was intact, a retrograde drilling technique was utilized. Fellowship trained foot and ankle surgeons performed all procedures.
All patients followed similar postoperative protocols. Immediately postoperatively, patients were placed into a sterile nonweightbearing splint for a period of 10 days, followed by placement into a nonweightbearing cast for an additional 3 weeks. Patients were then placed into a boot walker and formal physical therapy was begun at that time. Patients were then gradually progressed to full weightbearing based on their symptoms and the absence of an ankle effusion. Once pain free with full range of motion, patients were released to unrestricted activity with the recommendation for avoidance of repetitive impact exercises for one year post-operatively.
Variables assessed in the review included patient age, sex, body mass index (BMI), etiology, size of the lesion, location of the lesion, cystic nature of the lesion, and containment of the lesion. MRI readings were used to determine the size, location, and cystic nature of the lesion. Containment of the lesion was determined intraoperatively.
Clinical outcomes were determined based on the retrospective chart review, and on patient-based parameters of self-reported outcomes. This included preoperative, postoperative, and final visit surveys to determine clinical outcomes. The subjective measures were graded as good, fair, or poor. A good outcome was defined as no limitations in activity. A fair outcome was defined as limitations in recreational activities but no limitations in daily activities. A poor outcome was defined as revision surgery or severe limitations in both daily and recreational activities requiring use of an assistive device (crutches, walker, etc).
Statistical methods
The outcome variable, which was originally coded as poor, fair, and good, was dichotomized by collapsing categories fair and good into a single category referred to in this report as a good. A biostatistician assisted in multivariable logistic regression model building to determine which covariates were predictive of a poor clinical outcome. Logistic regression modeled the natural logarithm of the odds of a poor outcome. The odds of a poor outcome was defined as the ratio of the probability of a poor outcome to the probability of a good outcome. Note that the odds of a poor outcome would be different when comparing patients with different levels of a particular covariate in the final model (see Results section). The ratio of the odds of a poor outcome for patients with a particular covariate value to the odds for a patient with a different value of the same covariate (and all other covariates having the same values for these two hypothetical patients) was known as the “odds ratio.”
Potential predictor variables included the following: age, sex, BMI, size of the lesion, location of the lesion, cystic nature of the lesion, containment of the lesion, and etiology. Following univariate analysis, model building employed four different variable selection techniques: forward-, backward- and stepwise- selection, and AIC values. Fractional polynomial, quartile, quartic (i.e., all polynomial terms up to and including the fourth order), and linear spline modeling of the continuous variables were utilized. For quartic modeling, the continuous variables were first centered by subtracting the overall average from each observation. For categorical variables the number of observations for each level within the outcome groups required five or more to be included in the model building process. Once variable selection was completed, the variables that did not gain admission into the model were added one at a time to check for statistical significance. For covariates in the final model, the regression coefficients and standard errors as well as odds ratios (OR) and corresponding 95% confidence intervals (CI) were calculated.
Diagnostic tests were run on the final model including: Pearson residual chi-square and delta deviance statistics, each graphed against hat matrix diagonal values and predicted probabilities; extreme observations (outliers) are those in excess of 10. Fractional changes in all regression coefficients in the absence of each observation were determined. Those with changes greater than 1 in magnitude were displayed. A global test of goodness of fit, the Hosmer and Lemeshow test, was also determined, although the sample size in the poor category was smaller than normally required for this test.
A t-test or Wilcoxon test was used to determine statistically significant differences of the continuous variables between the two outcome groups. Valid t-tests assume independence of study subjects, normally distributed data within each group, and equal variances. Three tests for normality were performed for each variable: Kolmogorov-Smirnov, Cramer-von Mises and Anderson-Darling. If variables were not normally distributed within each group, then a nonparametric Wilcoxon test was done. Asymptotic or exact χ 2 tests were used to determine statistically significant differences in categorical variables between the groups. A p value ≤ 0.05 was required to achieve statistical significance.
A power analysis was performed to determine if the study had sufficient sample size to observe a clinically relevant association between a poor outcome and BMI. The analysis demonstrated that an increase of 1 in the natural logarithm of the odds of a poor outcome for a corresponding increase in BMI of 6.9 units is 78%, suggesting that the study was sufficiently powered to demonstrate the deleterious effects of increasing BMI in predicting a poor outcome, assuming such an association exists.
RESULTS
Results are summarized in the Appendix, available in the online version of this article. A total of 130 patients were included in the study with 64 males and 66 females, with 64 lesions being right-sided and 66 being left-sided. The average patient age at the time of surgery was 35.1 ± 13.7 (range, 12 to 73) years. The average followup was 37.2 ± 40.2 (range, 7.4 to 247) weeks.
The etiology of the lesions varied. A history of an ankle injury or trauma was present in 98 patients, no known etiology in 26 patients, and chronic ankle instability in 6 patients. Also, the location of the OLT varied. Fifty-two lesions involved the medial central talus, 26 posteromedial, 25 lateral central, 15 anterolateral, seven anteromedial, four posterolateral, and one anterocentral lesion. The average BMI was 29.8 ± 6.7 (range, 18.6 to 53.2). There were 32 cystic lesions and 98 noncystic lesions. The average size of the lesion was 0.84 ± 0.67 (range, 0.08 to 4.00) cm2. There were 20 lesions larger than 1.5 cm2 and 110 lesions smaller than 1.5 cm2. Finally, there were 113 contained lesions, while 17 were uncontained. There were four patients with early degenerative changes of the ankle joint noted on arthroscopic examination and there were five patients who had a concomitant osteochondral lesion of the tibial plafond (OLTP).
The average time to protected weightbearing was 5.1 ± 2.0 (range, 1.1 to 10.9) weeks. The average time to full weightbearing was 8.3 ± 5.4 (range, 1.4 to 59.6) weeks. The average time to return to unrestricted activity was 18.9 ± 15.0 (range, 4.1 to 117.3) weeks. There were four (3%) postoperative complications that occurred in our series. These included two DVTs, and one occurrence each of cellulitis and wound dehiscence.
In the original coding scheme, there were 105 patients with good outcomes, eight fair outcomes, and 17 poor outcomes.
None of the continuous variables were normally distributed. Consequently, a Wilcoxon test was used to test for statistically significant differences between the two outcome groups for all continuous variables. There was no statistically significant difference between the groups in age (p = 0.30), BMI (p = 0.73), time to PWB (p = 0.75), or time to FWB (p = 0.96). Only total time to followup (p = 0.0077) and time to full activity (p = 0.015) were statistically different between the groups.
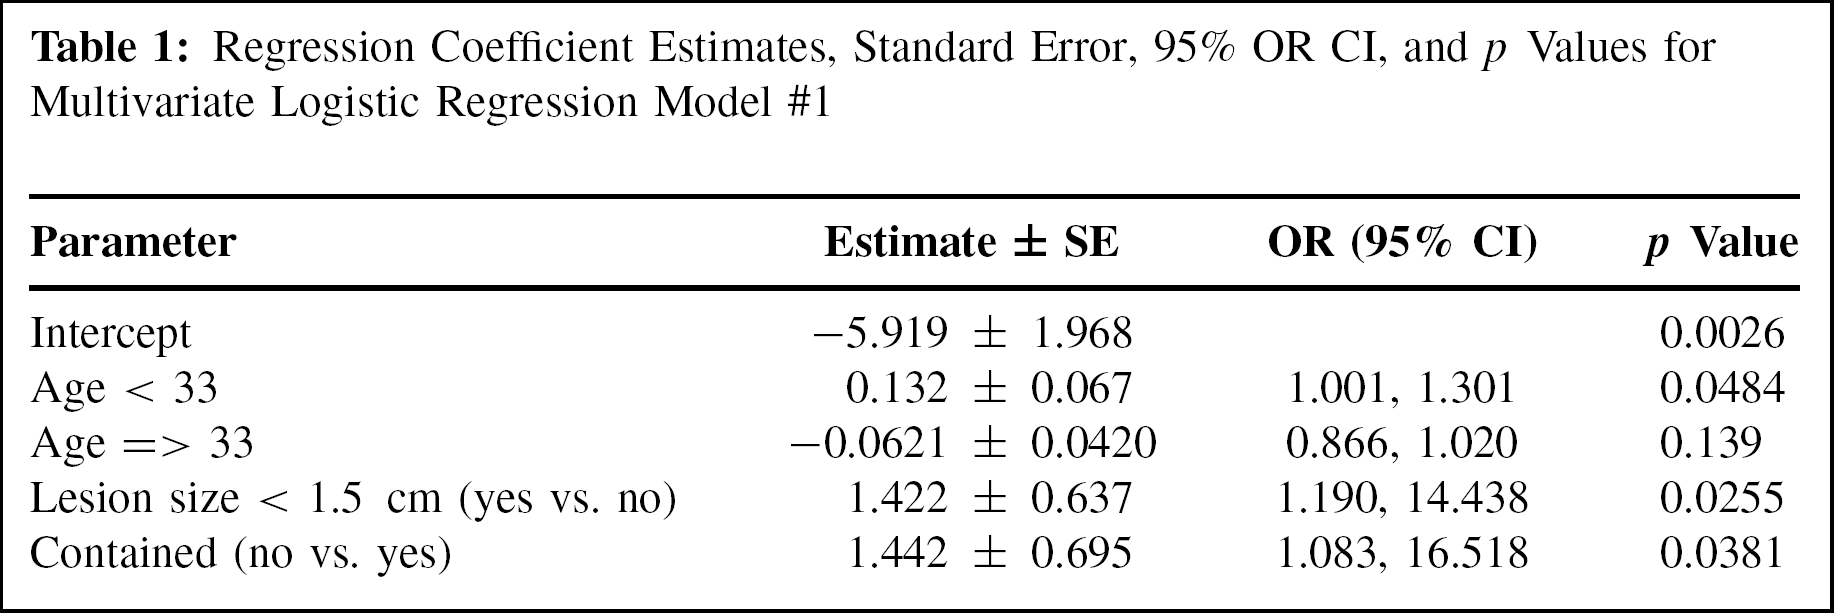
Based on the multivariate logistic regression analysis that was performed, the variables that were predictive of a poor outcome included size of the lesion, age, and containment of the lesion. Sex, BMI, OLT location, cystic nature of the lesion, and etiology were not statistically significant predictors of a poor outcome.
The natural logarithm of the odds of a poor outcome increased by 1.42 ± 0.64 for patients with OLT size greater than 1.5 cm2 when compared to those with smaller lesion sizes. This results in an odds ratio of 4.14 with a 95% CI (1.19, 14.44). Thus, OLTs larger than 1.5 cm2 were associated with a statistically significant higher incidence of poor outcomes (p = 0.026). Age fit in the model using a linear spline with a knot at 33 years of age (i.e., two different linear segments were used, one for patients younger than 33 years, and another for those 33 years of age and older). For patients younger than 33 years of age, the change in the natural logarithm of the odds of a poor outcome increased by 0.132 ± 0.067 for each one-year increase in age (p = 0.048). This results in an odds ratio of 1.14 with a 95% CI (1.001, 1.301). For patients older than 33 years, aging did not predispose patients to poor outcomes (p = 0.139). Uncontained lesions were associated with a statistically significantly higher incidence of poor outcomes (p = 0.038). The change in the natural logarithm of the odds of a poor outcome increased by 1.44 ± 0.70 for uncontained lesions. This results in an odds ratio of 4.23 with a 95% CI (1.083, 16.518). The corresponding 95% CI are shown in Table 1. The model had a Hosmer and Lemeshow Goodness-of-Fit Test of 0.481.
Regression Coefficient Estimates, Standard Error, 95% OR CI, and p Values for Multivariate Logistic Regression Model #1

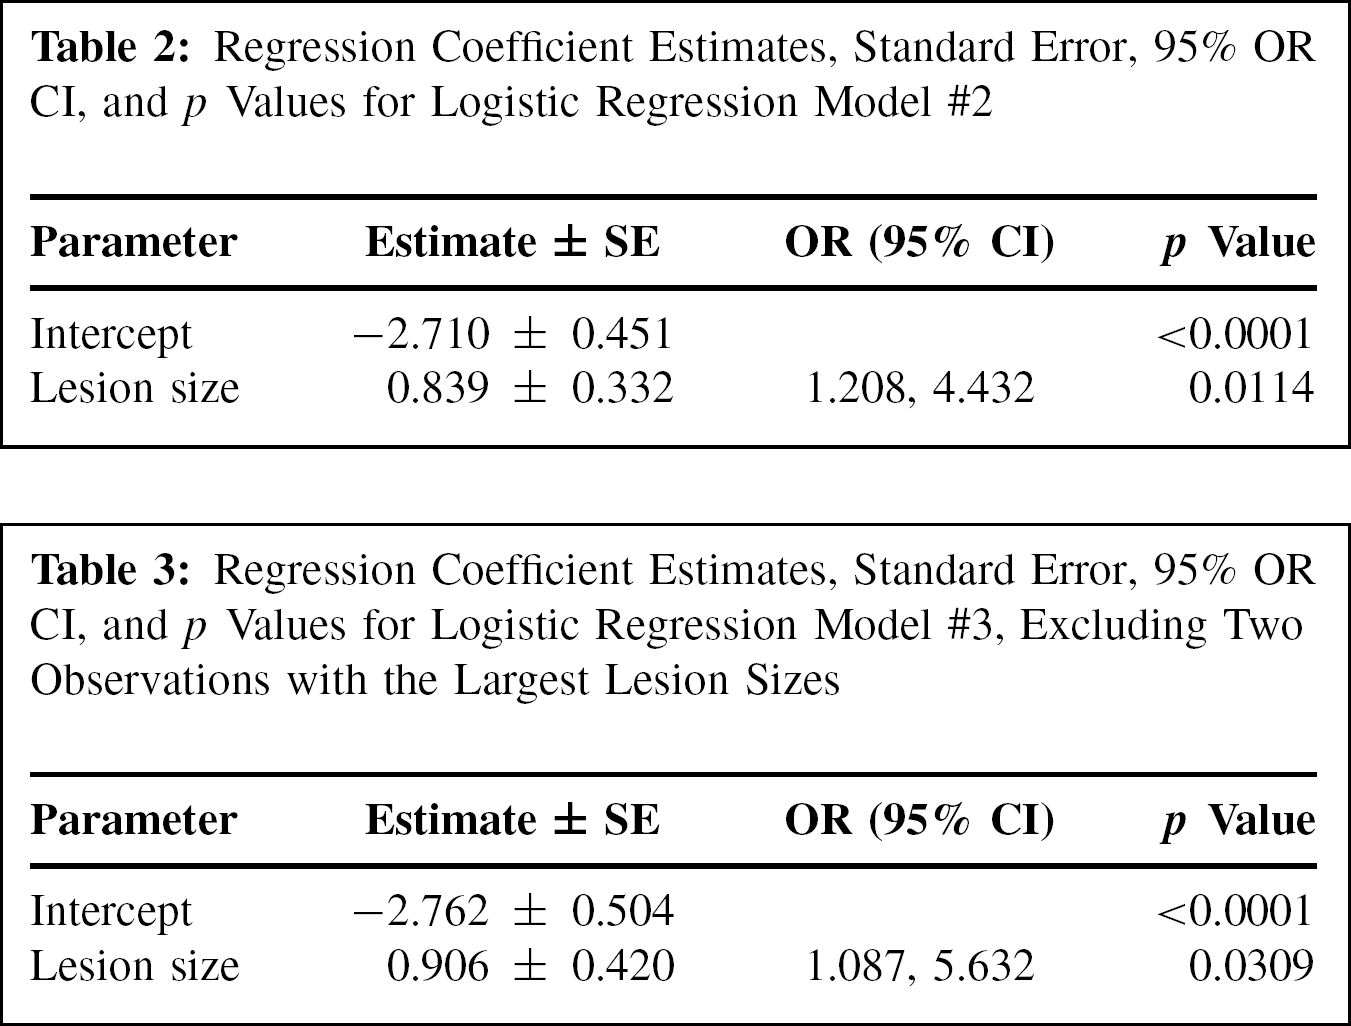
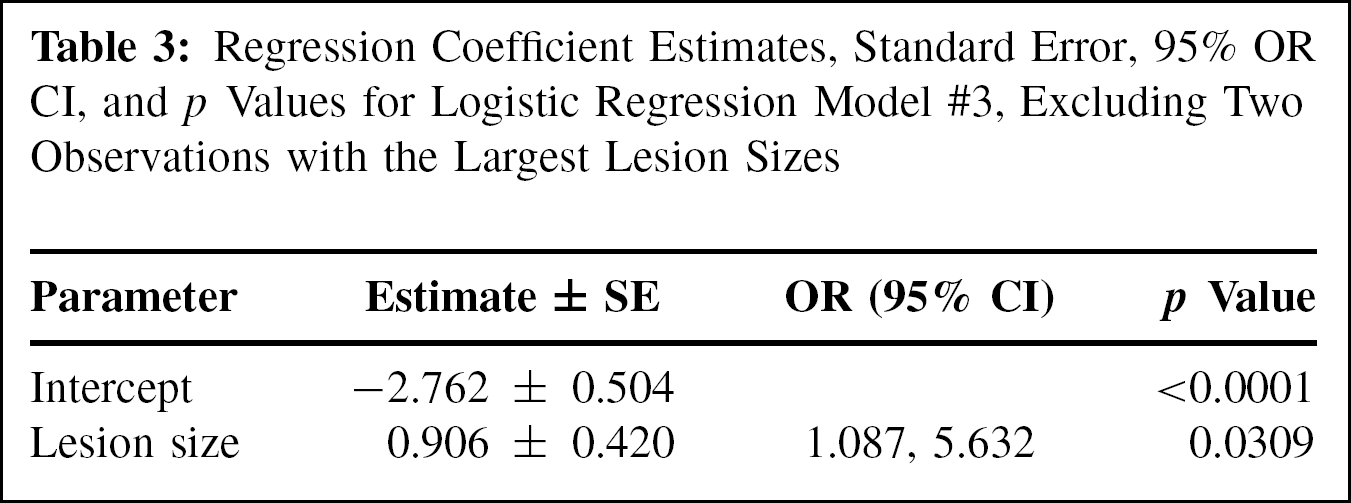
For comparison purposes, a separate model was built where lesion size was modeled as a continuous variable and in a linear manner. It was the only statistically significant predictor variable for a poor outcome when modeled this way (p = 0.011). Also, no other functional form for lesion size as a continuous variable was statistically better than the linear form in this second model. Table 2 displays the regression coefficient. The model had a Hosmer and Lemeshow Goodness-of-Fit Test of 0.798. A total of 17 poor outcomes and 113 good outcomes were included in the results. The change in the natural logarithm of the odds of a poor outcome increased by 0.84 ± 0.33 units per each one-unit increase in lesion size. As the two largest lesion sizes, 3.52 and 4.00, may be outliers, a third regression model with lesion size was performed by excluding these two observations. OLT size was still the only statistically significant predictor for a poor outcome when modeled this way (p = 0.031). Table 3 displays the regression coefficient. The model had a Hosmer and Lemeshow Goodness-of-Fit Test of 0.778. A total of 16 poor outcomes and 112 good outcomes were included in the results.
Regression Coefficient Estimates, Standard Error, 95% OR CI, and p Values for Logistic Regression Model #2
Regression Coefficient Estimates, Standard Error, 95% OR CI, and p Values for Logistic Regression Model #3, Excluding Two Observations with the Largest Lesion Sizes
DISCUSSION
The purpose of the current study was to review the outcomes of patients treated surgically for OLTs via marrow stimulation and to determine variables associated with inferior outcomes. We found that OLTs larger than 1.5 cm2 were associated with a poor clinical outcome, and was the greatest predictor of a poor outcome in the current series. Uncontained lesions and patient age also play a role in the overall clinical outcome.
A larger sized OLT has long been thought to be associated with inferior clinical outcomes, as larger lesions can alter the contact stresses of the ankle joint. However, there has been little reported in the literature correlating OLT size and clinical outcome. Gobbi et al. reported an inverse relationship between between OLT size and outcome, with better outcomes with smaller lesions.20 In another study, Chuckpaiwong et al. found a strong correlation between lesion size and clinical outcome, having excellent results in patients with OLT sizes less than 15 mm diameter. Other factors such as increasing age, higher body mass index, history of trauma, and presence of osteophytes negatively affected outcome.15 Choi et al. evaluated 120 ankles that underwent arthroscopic marrow stimulation for OLTs to determine prognostic factors for clinical outcome. The authors concluded that OLTs larger than 150 mm2 were associated with poor outcomes following treatment. Other factors such as age, duration of symptoms, trauma, associated lesions, and location of lesions had no association with outcome.13 Also, Han et al. performed a study comparing the clinical results and radiographic results in small subchondral talar cystic lesions (less than 1.5 cm2) to other noncystic OLTs after treatment via arthroscopic marrow stimulation without bone grafting. The authors found no difference in clinical or radiographic outcomes in cystic versus noncystic lesions.21
Our analysis is consistent with these studies and is the largest series to date correlating larger sized OLTs with inferior clinical outcomes. The current analysis found size to be the most powerful predictor of clinical outcome, with an odds ratio of 4.14. The critical OLT size threshold seemed to be 1.5 cm2, as OLTs larger than this size had a statistically significant higher incidence of poor outcomes (p = 0.026). We believe this is likely a result of altered contact areas and contact pressures in the ankle joint that is seen with larger osteochondral lesions. This has been shown in biomechanical studies, as Christensen et al. demonstrated significant changes in contact characteristics of the ankle joint for larger osteochondral lesions (more than 7.5 × 15 mm).14
Uncontained lesions were also associated with inferior clinical outcomes. An integral step in marrow stimulation procedures is creating a stable border of cartilage to surround the osteochondral lesion. This provides some degree of protection to the fibrocartilage that will form. An uncontained OLT involves the shoulder of the talar dome and as a result, lacks a stable border of articular cartilage at the site of marrow stimulation. Without a stable rim, the protective border is lost and the treated area is subjected to greater stresses, making a stable area of fibrocartilage formation less likely. To our knowledge, this is the first study to demonstrate the negative impact that an uncontained OLT can have on clinical outcome.
Our analysis also demonstrated that age may play a role in outcome as well. It showed that there was a small increase in risk of a poor outcome as age progressed up to age 33. This is similar to previously reported data by Deol et al. In their study, all patients treated for an OLT with marrow stimulation who were under age 20 years had a good or excellent outcome. The authors attributed the results to the rich microvascular supply within the subchondral zone in patients with open physes and in those recently achieving skeletal maturity.16 Our results agree with their data. In patients younger than age 33, the odds of a poor outcome increased by 0.132 ± 0.067 for each year increase in age. After 33 years, however, age did not appear to be an important predictor of outcome.
In the current series, we utilized MRI to determine size of the OLT. We chose MRI because arthroscopic examination has previously been shown to be an imprecise method for determining the size of osteochondral lesions, often overestimating or underestimating the size of OLTs.30 In addition, all patients included in the study had preoperative MRI measurements but not all had an intraoperative measurement recorded. However, MRI has been shown to be a noninvasive and accurate method to determine not only the size of osteochondral lesions, but the location and cystic nature of the lesion as well. 3,17,24,25,28,29
We also included in this series patients who underwent treatment via either open or arthroscopic marrow stimulation methods. A recent review by Verhagen et al. reported similar outcomes when OLTs were treated via both open and arthroscopic methods, including an 84% success rate with open and 87% success rate with arthroscopic procedures.35
We had nine patients included in the study with either early degenerative changes of the tibiotalar joint noted on arthroscopic examination or with a concominant OLTP. This included five patients with an OLTP and four patients with early degenerative changes. Only two of these patients were noted to have a poor outcome. Because of the small number of poor outcomes, this variable could not be included in the multivariate analysis. However, it is important to note that such conditions can potentially adversely affect the clinical outcome, especially in the long-term.
The statistical analysis played an important role in the current study. Multivariate logistic model building techniques were used to select the most clinically parsimonious model between the odds of a poor outcome and numerous potential predictor variables including age, sex, BMI, lesion size, lesion location, cystic nature of the lesion, containment of the lesion, and etiology. Established statistical steps including initial selection of variables using univariate analysis followed by several multivariable selection techniques were used including forward, backward, stepwise and AIC values to determine a final model. Diagnostic tests were used to assess the global fit of the model as well as determine what subjects were possible outliers to the model.
There are several limitations to the current study. Its retrospective nature subjects it to the limitations inherent of all retrospective studies. The wide range of followup may be another limitation. Grouping the outcomes good and fair together for the statistical analysis may be considered another limitation. Some younger, active patients with a fair outcome may view the inability to return to their recreational activities as a negative outcome. However, for the purpose of the current study, we were most interested in determining factors associated with poor outcomes, in which patients required a revision surgery or had severe limitations in daily and recreational activities. Another potential weakness is that in assessing the variable “locations,” there were several locations with a low number of observations, which may have created some degree of bias when comparing this variable. Finally, subjective outcomes were used to determine patient outcome as opposed to more objective measures or scoring systems. However, subjective clinical outcome measures may be of greater importance than more objective measures when considering overall patient outcome.
In conclusion, according to the current series, size was the most important predictor of outcome in the treatment of OLTs via marrow stimulation. OLTs greater than 1.5 cm2 in size were more likely to have inferior clinical outcomes compared to smaller OLTs. Uncontained lesions and increasing age up to age 33 years were other variables that may have been associated with inferior outcomes. Preoperative MRI allowed the size and location of the lesion to be determined and it can be useful in educating patients in their overall prognosis following treatment. Because larger and uncontained OLTs were often associated with more inferior clinical outcomes, we believe a more extensive initial procedure should be considered when treating these types of OLTs. Future prospective studies are necessary to further evaluate these methods.
Footnotes
ACKNOWLEDGMENT
The authors would like to thank Brian Palmer, PhD, for his assistance with the statistical analysis.