
Abstract
Background: Osteochondral lesions of the talus (OLT) traditionally have been thought to occur anterolaterally or posteromedially. Recent studies utilizing magnetic resonance imaging (MRI) have questioned this teaching. The purpose of this study was to use MRI to describe the location, frequency, and morphology of OLT and determine if any correlations exist between lesion location and other data points. Methods: The location, frequency, and size of OLT based on a nine-zone grid were recorded on 77 MRI examinations. Lateral ligaments were inspected for evidence of injury. Stability of the lesions was assessed based on four MRI criteria: presence or absence of cartilage defects, edema-like signal abnormality, T2 bright rim, and/or subchondral cysts. Demographic data including patient age, injury mechanism, and chronicity were recorded. An ANOVA model was used to determine if statistical differences existed between lesion size and location. Pearson correlation coefficients were used to examine any association between lesion location and demographic data. Results: Most of the lesions were located medially and centrally on the talar dome (54.5%), with the second highest frequency found laterally and centrally (31.2%). With the numbers available there was no statistical difference between the size of the lesions based on location. No strong correlations were found between lesion location and demographic data. Conclusion: This study refutes traditional teachings regarding the location of OLT and supports recent studies showing that most lesions are located medially and centrally on the talar dome.
Level of Evidence: IV, Retrospective Case Series
INTRODUCTION
After the knee and elbow, the talar dome is the third most common site of osteochondral lesions in the human body. 19 While trauma is thought to be the causative factor in the majority of OLT, occurring by some estimates in up to 50% of ankle sprains, 12,20 other etiologies have been proposed. Joint malalignment, genetics, degenerative joint disease, endocrine or metabolic abnormalities, repetitive microtrauma, vasculopathies, and avascular necrosis might also play a role. 3,12,14,17,18,21,23
Plain film radiography was the imaging tool of choice when Berndt and Hardy created their classification system for OLT, but later studies have demonstrated that radiographs might miss up to 50% of talar dome lesions. 15 More recently, computed tomography (CT) has shown accuracy in delineating bony morphology of OLT. However, because of its high sensitivity and specificity, as well as its ability to show other soft tissue injuries around the ankle, MRI has become the preferred modality for diagnosing OLT. 10,16 Furthermore, MRI examination of OLT has been shown to correlate with the arthroscopic findings at time of surgery and can even be used to classify the lesions. 1,10 Accurate localization and description of osteochondral lesions on preoperative imaging is helpful for planning the operative approach and type of procedure to be performed.
OLT were traditionally shown to occur most frequently in the anterolateral and posteromedial aspects of the talar dome, with the anterolateral lesions being shallower and the posteromedial lesions being deeper. 3,5 Recent work by Elias et al. 9 characterized the location and morphology of talar osteochondral lesions on MRI using a novel nine-zone grid. In their study, most of the talar dome lesions were located on the central medial ridge of the talar dome, with the second highest frequency of lesions on the central lateral ridge. The lesions in the medial third of the talar dome were significantly larger in surface area and depth than lesions in the lateral third of the talar dome. The findings of Elias et al. have not been reproduced and lesion location has not been correlated with other clinical data points. The purpose of this study was to use MRI examinations of the foot and ankle to characterize OLT in terms of location, size, and frequency based on the nine-zone grid previously described. 9 A secondary goal of this study was to correlate the lesion location to lesion size, patient age, lesion chronicity, history of trauma, lateral ligament injury, and lesion stability.
MATERIALS AND METHODS
Institutional Review Board approval was obtained prior to beginning the study. A consecutive series of foot and ankle MRI examinations completed at the lead institution from September 2002 to September 2006 were searched for the terms ‘osteochondral lesion’ and ‘osteochondritis dissecans.’ All MRI studies were performed on a 1.5 Tesla system utilizing a dedicated extremity foot and ankle coil (Signa, GE Healthcare, Madison, WI or Magnetom Symphony, Siemens Medical Solutions, Malvern, PA). Imaging was carried out in the axial, sagittal, and coronal planes, and T1-weighted and fat suppressed fast spin echo T2-weighted sequences were performed in each plane. Examinations were included in the study if there was a documented osteochondral lesion of the talar dome. Ninety-seven MRI examinations in 97 patients were identified. Twenty examinations were excluded leaving 77 examinations that were included for analysis. Exclusion criteria included concomitant tibial plafond lesions suggesting osteoarthritis or other inflammatory arthropathies (five), inability to see a lesion or small lesion size precluding accurate measurement (five), extensive osteonecrosis throughout the talar dome (four), poor visualization of the talar dome by postoperative changes (two), extensive signal abnormality throughout the talar dome (two, one secondary to infection and one secondary to hardware), and incomplete clinical data (two). The remaining 77 MR examinations (31 males and 46 females; mean age, 39 years; range, 14 to 72 years) were retrospectively reviewed by a musculoskeletal radiologist.
The talar dome articular surface was divided into a grid consisting of nine zones of equal surface area in the axial plane using the method previously described by Elias et al. 9 Zone one was the most medial of the anterior zones, and zone three was the most lateral of the anterior zones. Progressing posteriorly, zone seven was the most medial of the posterior zones, and zone nine was the most lateral of the posterior zones. Analysis was performed using a software tool on PACS workstations (GE Healthcare, Madison, WI). The location of each osteochondral lesion was described based on the nine-zone grid, and each lesion was measured in three dimensions (anteroposterior, transverse, and craniocaudal). If a lesion was located across multiple zones, then the zone where the majority of the lesion was located was recorded. Next, the lateral ligamentous structures were assessed for evidence of injury. For each examination, the anterior inferior tibiofibular ligament (AITFL), anterior talofibular ligament (ATFL), and calcaneofibular ligament (CFL) were graded as normal or abnormal. Ligaments were graded as abnormal if there was MR evidence suggesting injury, such as the ligament being absent/not visualized, torn, partially torn, attenuated, or thickened. Four criteria, as described by De Smet et al., 8 were used to assess the stability of the osteochondral lesions. These criteria included the presence or absence of cartilage defects, edema-like signal abnormality, T2 bright rim, and/or subchondral cysts. Criteria were graded subjectively by a musculoskeletal radiologist. If a defect was noted in the cartilage overlying the lesion, it was graded partial thickness or full thickness. Otherwise the cartilage was graded as intact. The degree of edema-like signal abnormality surrounding the lesion on T2-weighted images was graded as none, mild to moderate, or severe. The presence or absence of a rim of increased signal intensity surrounding the lesion on T2-weighted images was recorded. The presence or absence of cyst-like foci at the base of the lesion on T2-weighted images was also recorded.
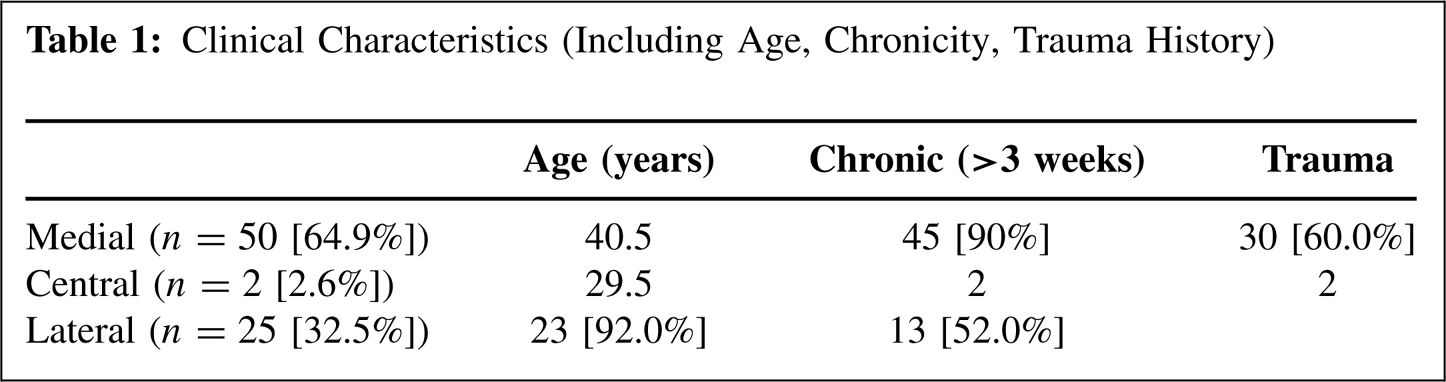
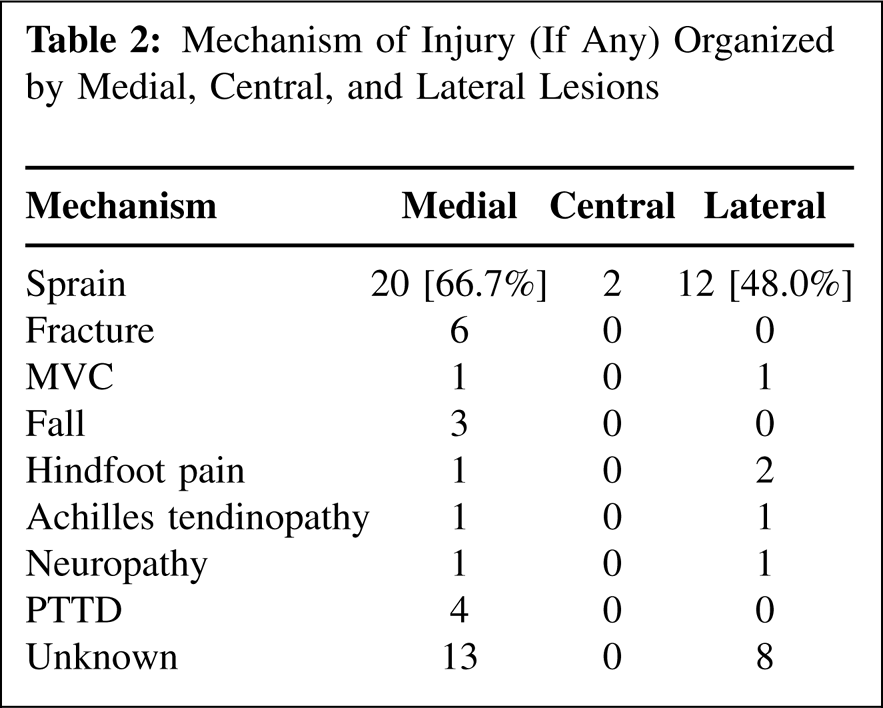
Clinical charts were retrospectively reviewed to determine age, lesion chronicity, and history of trauma (Table 1). Acute lesions were defined as less than 3 weeks from injury and chronic lesions were defined as greater than 3 weeks. The large majority of lesions were chronic at the time of MRI examination. Most of the patients reported a history of trauma, with ankle sprain or recurrent ankle sprain accounting for the majority of traumatic mechanisms. Other less common traumatic etiologies included ankle fracture, motor vehicle collision, and fall from height (Table 2).
In order to examine differences in lesion size based on lesion location, a one-way ANOVA was completed (p < 0.05). In addition, Pearson correlation coefficients were calculated in order to better understand the association between lesion location and the clinical variables. All statistical analysis was completed in SPSS version 12.01 (International Business Machines, Chicago, IL).
Clinical Characteristics (Including Age, Chronicity, Trauma History)
RESULTS
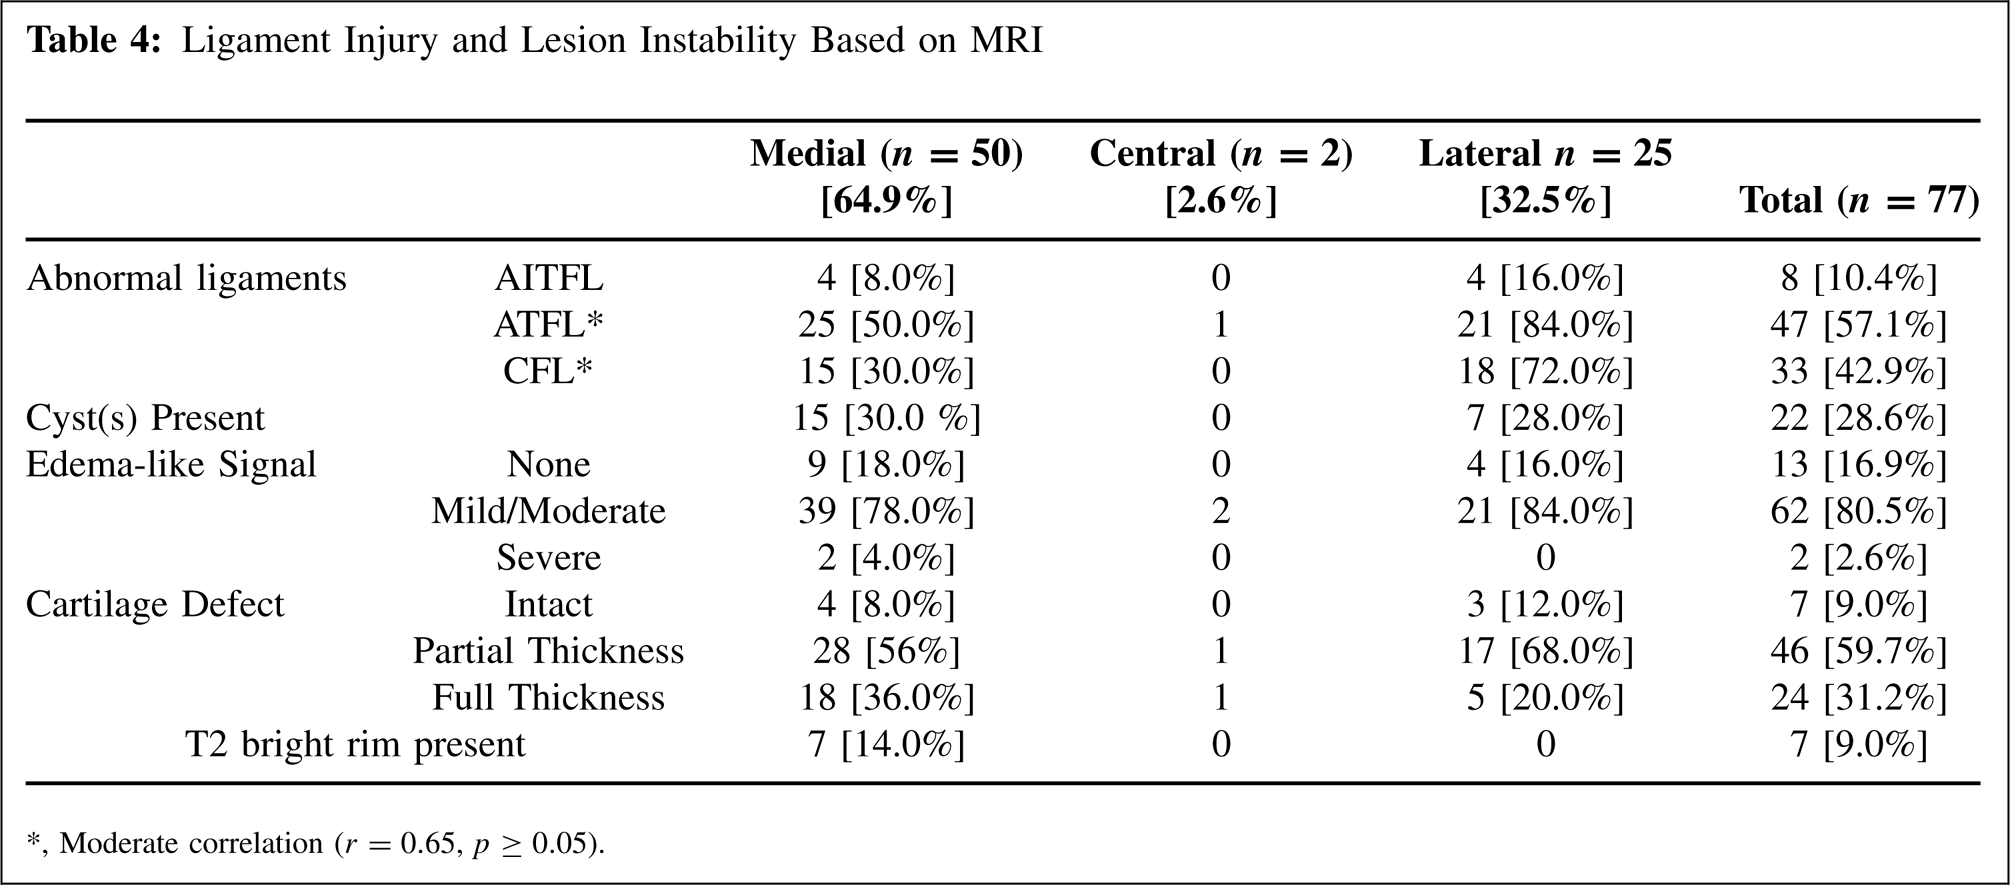
Of the 77 specimens included in the study, 50 (64.9%) were located on the medial side of the talar dome (zones 1, 4, and 7), while 25 (32.5%) were located on the lateral side of the talar dome (zones 3, 6, and 9). Two (2.6%) of the lesions were located in the middle of the talar dome (zones 2, 5, and 8). In the coronal plane, two (2.6%) of the specimens were located along the anterior aspect of the talar dome (zones 1, 2, and 3), while eight (10.4%) were located along the posterior talar dome (zones 7, 8, and 9). In the coronal plane, 67 (87.0%) of the lesions were located in the central talar dome (zones 4, 5, and 6). In terms of the individual zones, 42 (54.5%) of the lesions were located medially and centrally in zone 4 (Figures 1 through 3). Zone 6 had the next highest frequency with 24 (31.2%) of the lesions located in this lateral and central zone.
Lesion size is reported in Table 3. Medial lesions (zones 1, 4, and 7) tended to be larger in surface area and depth as compared to central and lateral lesions, but with the numbers available, this finding was not statistically significant.
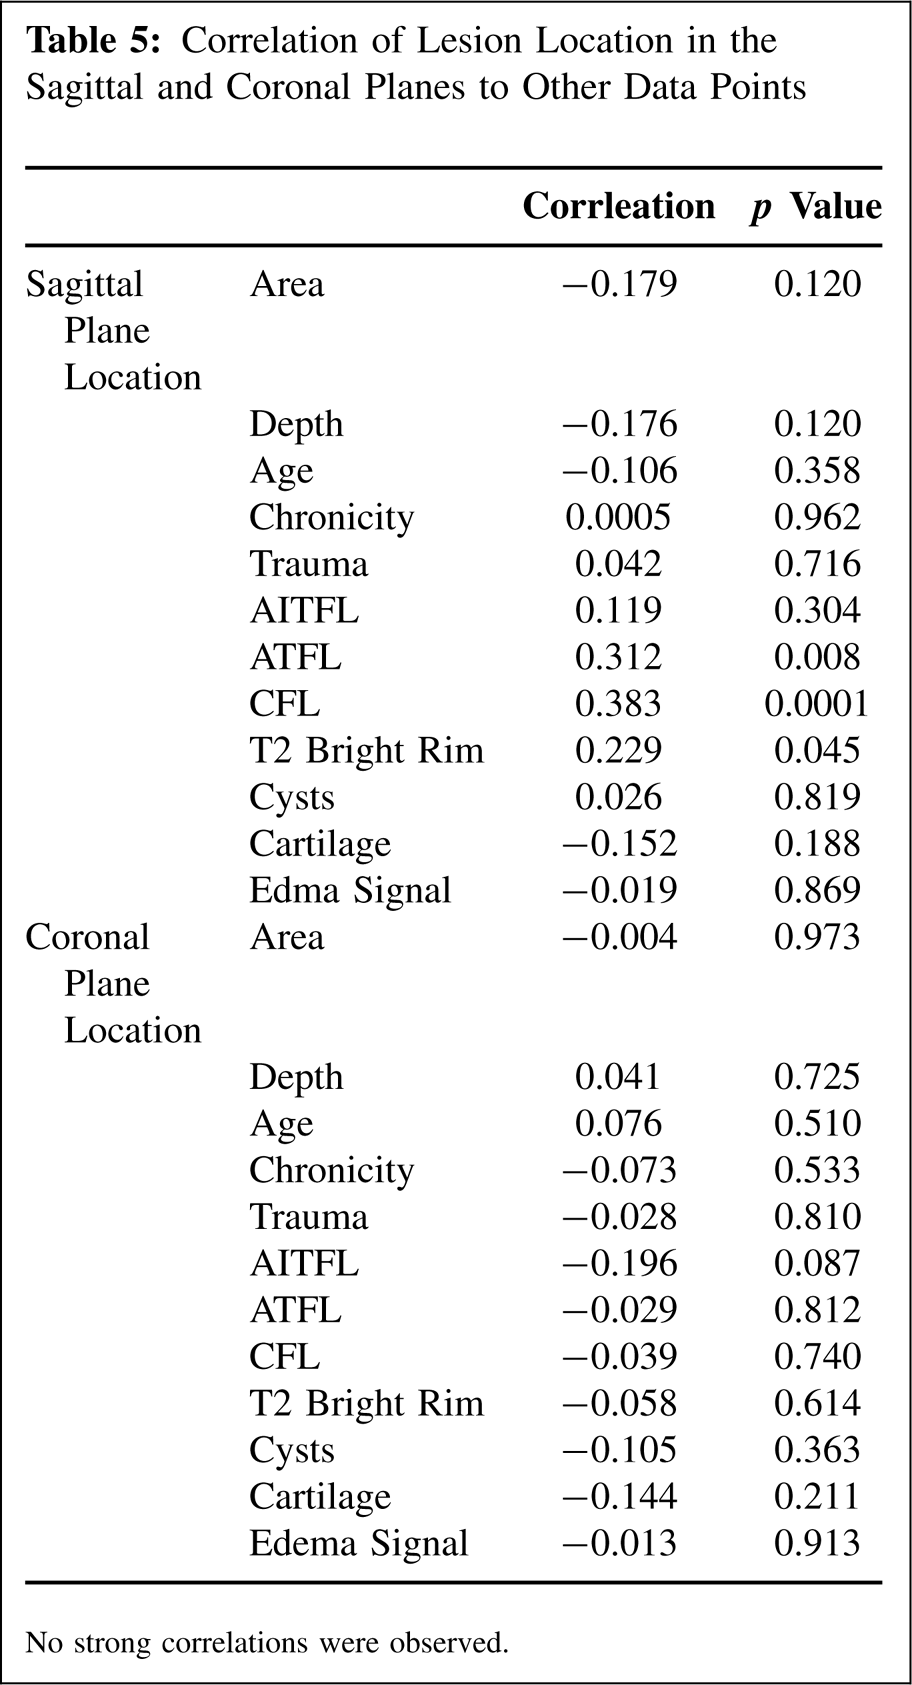
MRI evidence suggesting ligament injury was observed more frequently with the ATFL and CFL than with the AITFL (Table 4). Furthermore, evidence of injury to the ATFL and CFL was more common when the talar lesions were located in the lateral third of the talar dome. A moderate positive correlation was noted between injury to the ATFL and injury to the CFL (r = 0.65, p ≤ 0.05).
The presence or absence of MRI criteria for OLT lesion instability is shown in Table 4. Notable is the relative high frequency of lesions with moderate edema-like signal abnormality and/or partial cartilage surface defects.
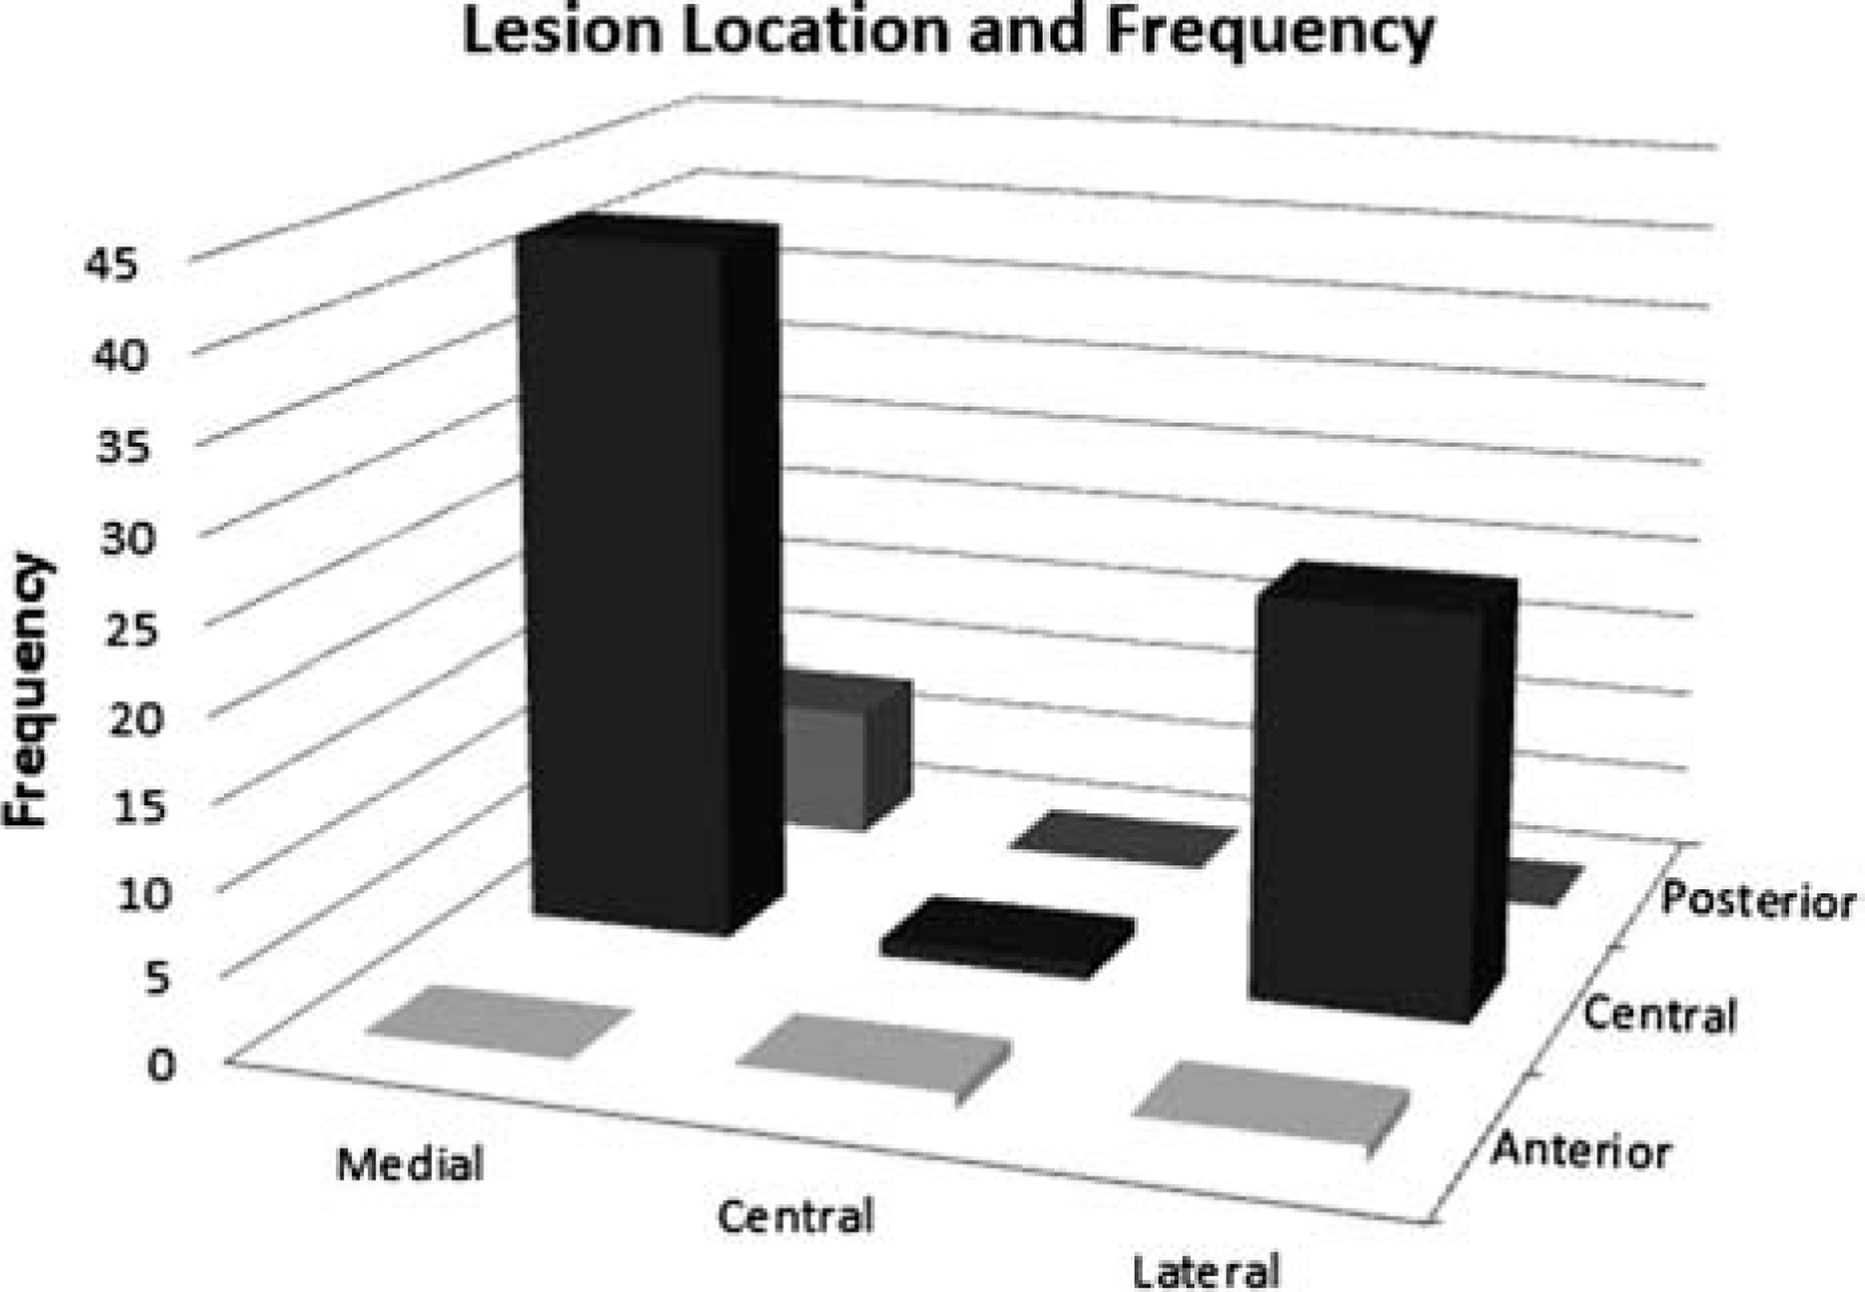
Lesion location and frequency on talar dome based on nine-zone grid.
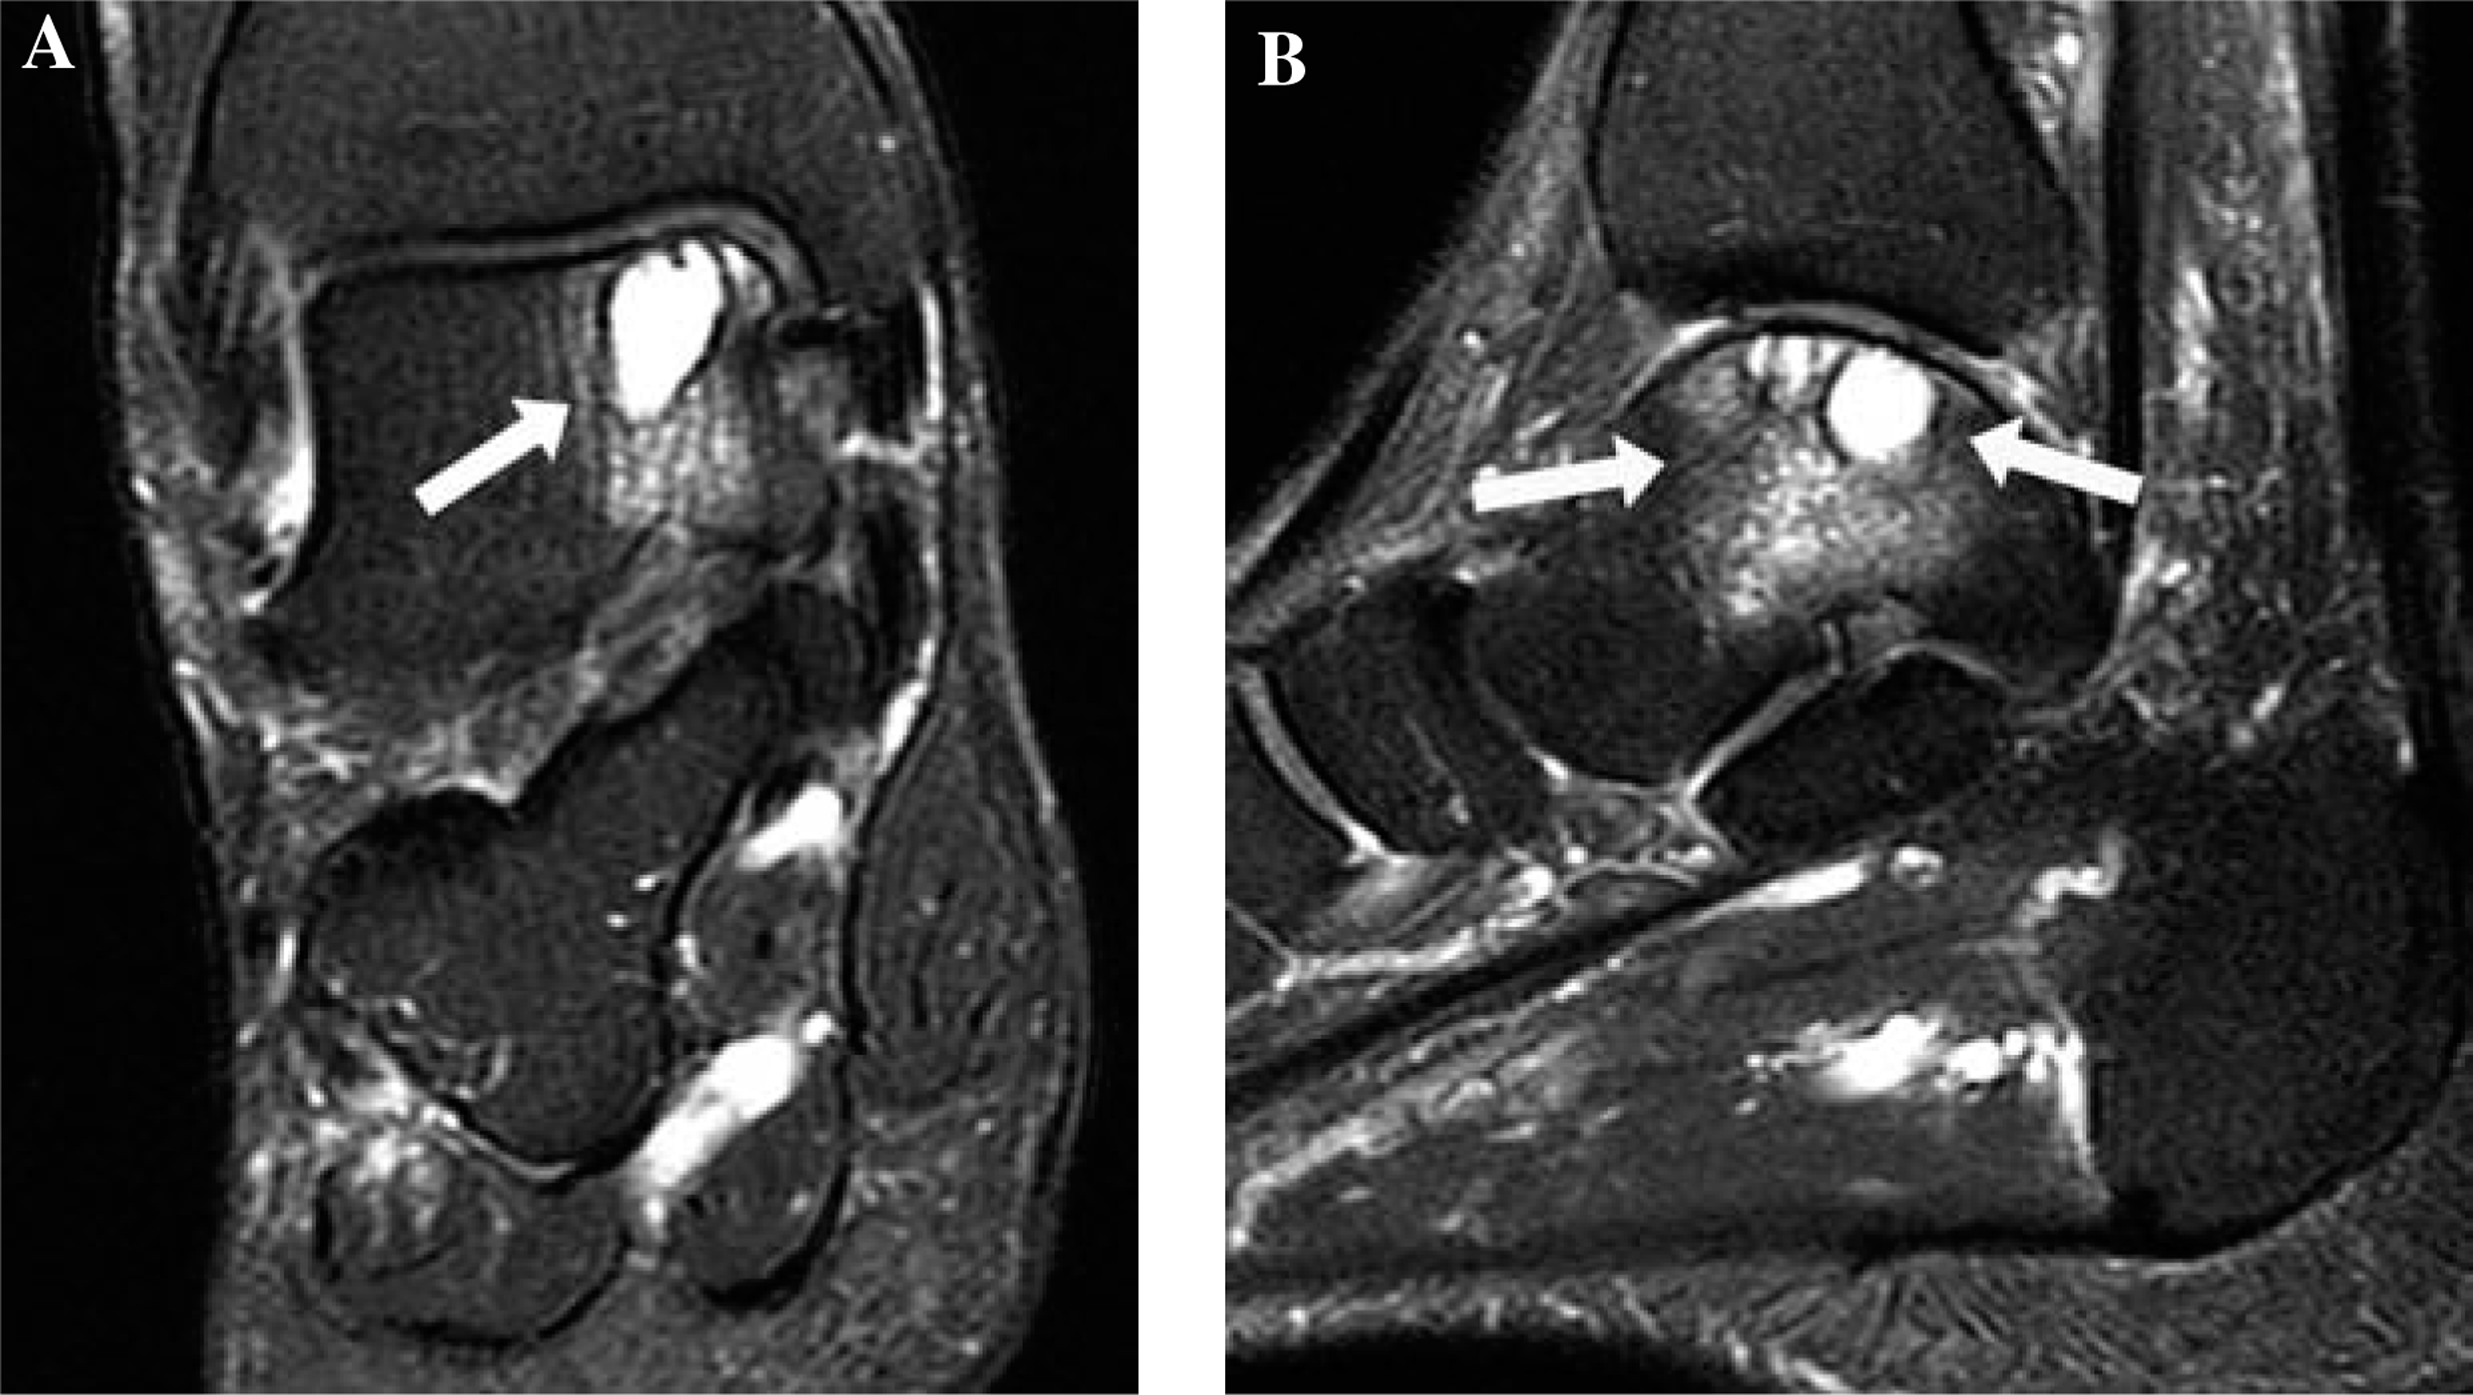
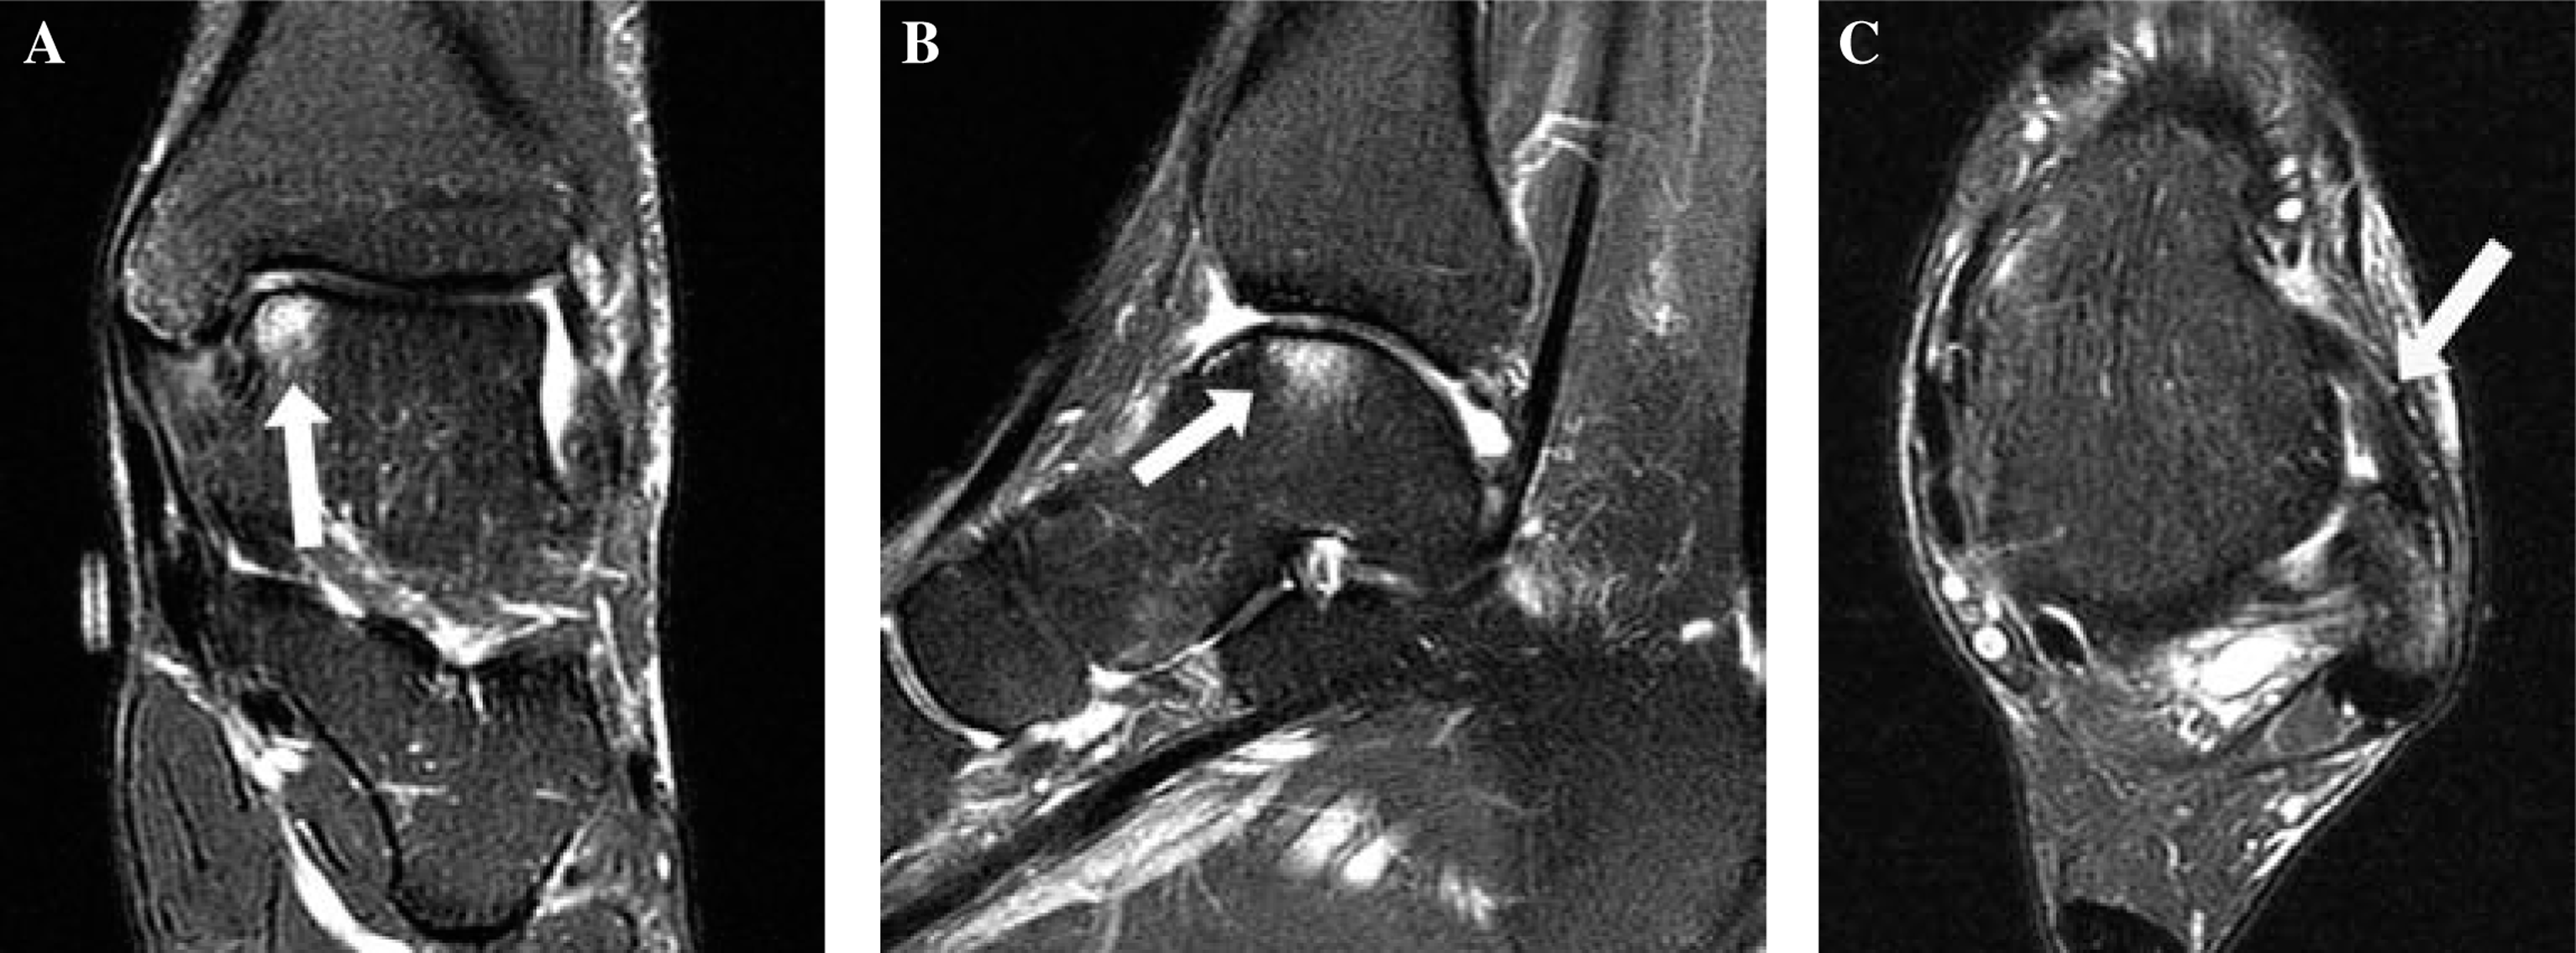
Sixty-five-year-old male with a history of chronic right ankle pain (patient 15). Coronal (A) and sagittal (B) fat-suppressed fast spin echo T2-weighted images of the right ankle demonstrate an osteochondral lesion in zone four. There is a large subchondral cyst and severe surrounding edema-like signal abnormality (arrows).
Mechanism of Injury (If Any) Organized by Medial, Central, and Lateral Lesions
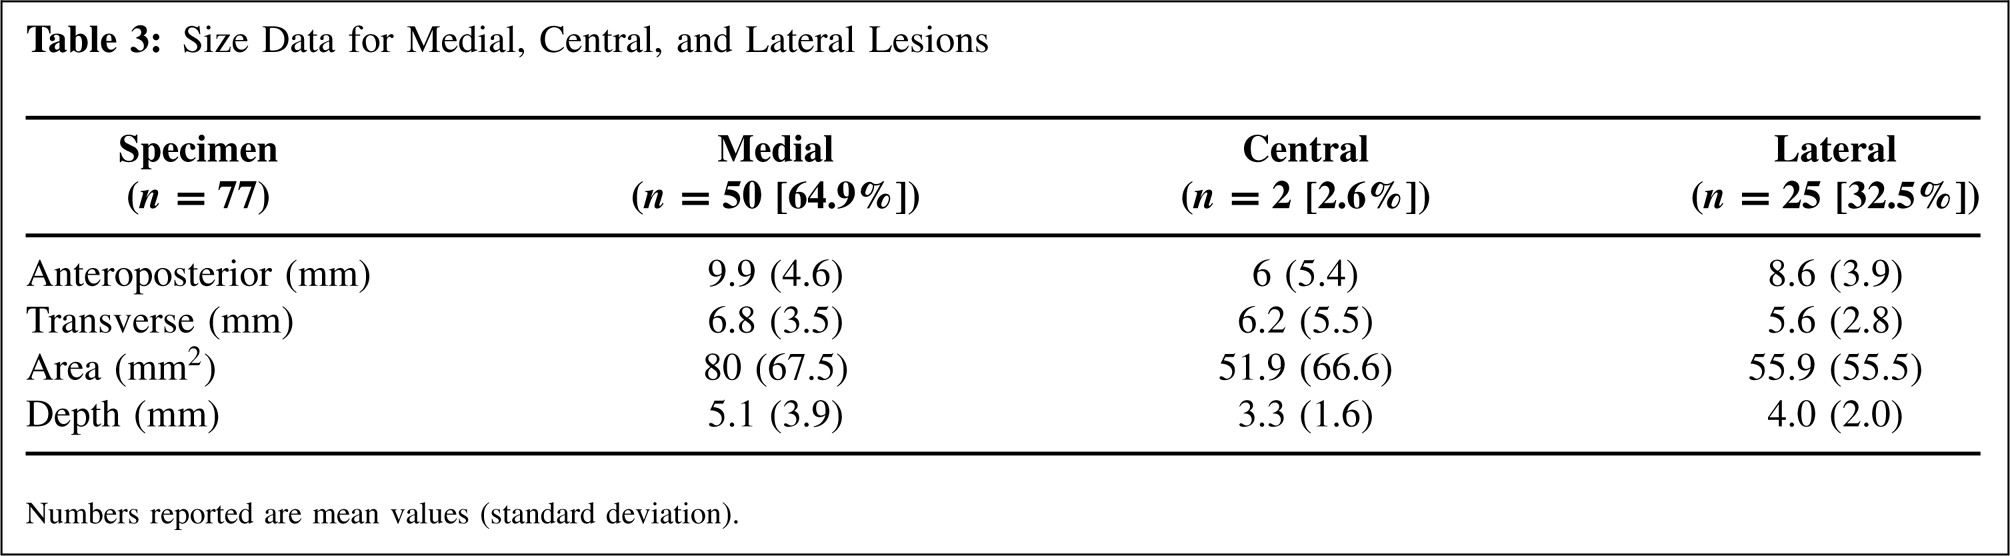
Forty-four-year old male with a history of remote prior left ankle sprain and chronic ankle pain. Coronal (A), sagittal (B), and axial (C) fat-suppressed fast spin echo T2-weighted images of the left ankle demonstrate a zone four cartilage defect with mild surrounding edema-like signal abnormality (arrows in A and B). Note marked thickening and irregularity of anterior talofibular ligament indicative of prior injury with subsequent scar formation in the anterolateral gutter (arrow in C).
Size Data for Medial, Central, and Lateral Lesions
Numbers reported are mean values (standard deviation).
Ligament Injury and Lesion Instability Based on MRI
Moderate correlation (r = 0.65, p ≥ 0.05).
No strong correlations were observed between any of the clinical variables evaluated. This included the clinical data points of age, chronicity, and history of trauma as well as the radiographic data points of lesion location, lesion size (area and depth), markers of lesion instability (cartilage defects, edema-like signal abnormality, T2 bright rim, and subchondral cysts), and ligament injury (AITFL, ATFL, CFL). The correlations between lesion location and the other variables are reported in Table 5 as a representative sample.
DISCUSSION
The results of the present study corroborate what was reported by Elias et al. 9 in terms of the location and frequency of OLT. Elias et al. reported that 62.9% of lesions were found on the medial talar dome while 33.4% were found on the lateral talar dome, which is similar to the numbers reported in the present study. Only on rare occasions were lesions found in the central zones in the sagittal plane (zones 2, 5, and 8), or in the anterior zones in the coronal plane (zones 1, 2, and 3). In terms of lesion size, Elias et al. found a significant difference between the medial (zones 1, 4, and 7) and lateral (zones 3, 6, and 9) lesions with respect to both surface area and depth, with the medial lesions being larger and deeper. However, the current study found no significant difference between the groups in terms of surface area or depth, but there was a trend toward the medial lesions being larger and deeper.
Similar to the data reported by Elias et al., our series refutes the traditional teaching that most osteochondral lesions of the talar dome are found either anterolaterally or posteromedially. 3,5 It is possible that the nine-zone grid proposed by Elias et al. allows for more accurate localization of OLT on MRI, thereby providing a more accurate depiction of lesion frequency based on lesion location. Accurate description of lesion location is important for a variety of reasons, including adequate preoperative planning, intraoperative lesion localization, effective communication between surgeons and radiologists, and improved accuracy of clinical research. Understanding the exact morphology and location of a lesion prior to surgery can affect what procedure is performed since larger lesions are less likely to respond to microfracture surgery. 7
Elias et al. speculate that medial talar dome lesions are caused by inversion injuries, such as ankle sprains, during which the medial talus impacts the medial tibial plafond. The impaction tends to make medial lesions deeper and larger. 9 The higher frequency of lesions along the medial talar dome is certainly consistent with the high frequency of inversion ankle sprains across active populations 13 as well as the high frequency of sprains reported with OLT. 20,22 Elias et al. did not report on the mechanism of injury in their study. In the present study, 60.0% of the medial lesions and 52.0% of the lateral lesions were associated with a history of trauma. Though no strong correlations were found, these numbers differ from the traditional notion that lateral lesions are more commonly associated with a history of trauma. 12,24 In the present study, ankle sprains were the most common traumatic mechanism, accounting for 66.7% and 48.0% of the medial and lateral traumatic injuries, respectively. Most of the cases included in this study were classified as chronic lesions, though this included both traumatic and non-traumatic etiologies. Given the retrospective data obtained in this study, it was not possible to delineate the exact chronology of many of the ankle sprains. Some studies have documented a higher incidence of OLT with chronic lateral ankle instability as opposed to subacute injury, 22 which would be consistent with the large number of ankle sprains and chronic lesions reported in this investigation.
One unique aspect of the present study is the evaluation of MRI looking for a previous injury to the AITFL, ATFL, and CFL. Lateral ankle sprains account for up to 85% of all ankle sprains. 11 The ATFL and CFL in particular are the most commonly injured ligaments in lateral ankle sprains, with the ATFL being torn in up to 66% of sprains and a combination of the ATFL and CFL being torn in 25% of sprains. 4,6 These percentages are consistent with a weaker ATFL and a stronger CFL, as has been documented in biomechanical studies. 2 In the present study, the rate of MRI abnormality for the ATFL and CFL was 57.1% and 42.9%, respectively, indicating that the CFL was less likely to be injured. Furthermore, there is a moderate positive correlation between ATFL and CFL abnormality (r = 0.65, p ≤ 0.05), indicating that they are sometimes, but not always, injured in combination. The rate of MRI abnormality for the ATFL and CFL in patients with medial OLT was 50.0% and 30.0%, respectively, considerably less than the 84.0% and 72.0% rate observed in patients with lateral OLT. This is intriguing as one would expect that larger and deeper medial lesions, as might be created with an inversion impaction injury, would be more prone to have lateral ligament injury. No strong correlations were observed in the present study between lesion location and evidence of injury to the lateral ligaments. The overall rate of AITFL abnormality across the MRI examinations was very low at 10.4%, and the significance of this value is unclear.
Correlation of Lesion Location in the Sagittal and Coronal Planes to Other Data Points
No strong correlations were observed.
No strong correlations were found between lesions suggestive of instability on MRI and the other data points reported, including lesion location and lesion size.
One of the criteria used in this study to assess lesion instability deserves special mention. The orthopaedic and radiologic literature is replete with the phrase “bone marrow edema” when describing high T2 signal around arthritic lesions. The word edema might be a misnomer. There is evidence that increased MRI signal intensity probably is not edema but represents other pathologic processes like marrow necrosis, marrow fibrosis, and trabecular abnormalities, particularly for chronic lesions. 25 Although beyond the scope of this paper, more accurate terminology should be developed to describe the high T2 signal associated with osteochondral lesions. In an effort to avoid confusion we chose to use the phrase “edema-like signal abnormality” when referring to the high T2 signal. In this study the lack of correlation between chronicity and edema-like signal abnormality suggests that the high signal was not true edema since one would expect edema from an acute injury to resolve over time. However, this correlation could be affected by the low number of acute lesions available for analysis. A series of acute ankle sprains followed with sequential MRI over several months could be useful to characterize the relationship between bone marrow edema and high T2 signal abnormality.
We acknowledge several limitations of this study. The retrospective design limits the accuracy of some of the data points. It was sometimes difficult to know why the patients were being imaged, and at least some of the lesions were incidental findings on MRI examinations that were obtained for reasons unrelated to the OLT, which could affect the correlation between data points. Furthermore, the relative small number of cases in our study (n = 77) was less than that reported by Elias et al. (n = 428), 9 which limits the statistical power. Despite these limitations, the results of this study and others suggest that the most common OLT are not the traditionally described anterolateral and posteromedial lesions, but rather central medial and central lateral lesions. Lesion location does not appear to predict subject age, lesion chronicity, history of trauma, or lesion instability. While no statistical differences were noted, the medial lesions were larger and the lateral lesions were more often seen in association with ligamentous injury. A larger case series with review of these factors relative to lesion location would be helpful to further investigate these relationships.