






Abstract
INTRODUCTION:
Percutaneous sclerotherapy is a well-established treatment option for venous malformations (VM). A recently established sclerosing agent is ethanol-gel. Aim of this study was to identify, if contrast-enhanced ultrasound (CEUS) with an integrated perfusion analysis allows for differentiation between untreated VM, healthy tissue, and with gelified ethanol treated malformation tissue.
MATERIAL AND METHODS:
In this institutional review board approved prospective study symptomatic VM patients underwent CEUS at exactly the same position before and after sclerotherapy with ethanol-gel. Two experienced sonographers performed all examinations after the bolus injection of microbubbles using a multi-frequency probe with 6 –9 MHz of a high-end ultrasound machine. An integrated perfusion analysis was applied in the center of the VM and in healthy, surrounding tissue. For both regions peak enhancement (peak), time to peak (TTP), area under the curve (AUC), and mean transit time (MTT) were evaluated. Wilcoxon signed rank test was executed; p-values <0.05 were regarded statistically significant.
RESULTS:
In 23 patients including children (mean age 25.3 years, 19 females) before treatment all identified parameters were significantly higher in the VM center compared to healthy tissue (peak: p < 0.01; TTP: p < 0.01; AUC: p < 0.01; MTT: p < 0.01). Comparing the VM center before and after treatment, TTP (p < 0.02) and MTT (p < 0.01) reduced significantly after sclerotherapy. In surrounding tissue only peak changed after treatment in comparison to pre-treatment results (p = 0.04). Comparing data in the VM center with surrounding tissue after sclerotherapy, results still differed significantly for peak (p < 0.01), TTP (p < 0.01), and AUC (p < 0.01), but assimilated for MTT (p = 0.07).
CONCLUSION:
All with CEUS identified parameters seem to be excellent tools for differentiating between VM and healthy tissue. TTP and MTT could distinguish between with ethanol-gel sclerotized VM portions and untreated malformation parts and thereby might assist the monitoring of sclerotherapy with ethanol-gel.
Introduction
In 1982 Mulliken and al. introduced a new classification system for vascular anomalies [17]. Hence, they are differentiated into vascular tumors and vascular malformations. According to their biological behavior the latter ones are roughly classified into high-flow and low-flow malformations [4, 12, 21]. Venous malformations (VM) represent the most common type of congenital low-flow vascular malformations [1, 6]. Depending on malformation localization and size, patients suffer from symptoms like pain, swelling, discoloration, or functional impairment rather earlier or later. Possible treatment options depend on the VM extent. If ectatic superficial veins are present, radiofrequency ablation of the marginal venous system might be indicated [29]. In case of symptomatic intramuscular VM cryoablation seems to be a promising method [3]. Interventional percutaneous sclerotherapy is a well-accepted treatment option for VM [11, 18], but every sclerosing agent has its own activity profile and - in parts systemic - side effects [30]. Gelified ethanol with a high viscosity, being supposed to operate locally without systemic side effects, seems to be a safe and effective alternative [5, 33].
In the diagnosis of vascular anomalies B-mode sonography is a fast tool for exact localization and measurement of the vascular lesions' extent as well as for diagnosing complications like thrombophlebitis and thrombosis. The combination with color-coded Doppler sonography (CCDS) provides the detection of flow patterns and thus a classification into high-flow and low-flow malformation is possible.
With contrast-enhanced ultrasound (CEUS) and quantitative perfusion analysis the dynamic evaluation of capillary microvascularization in different tissue types is possible [8]. Furthermore, CEUS enables the depiction of neovascularization in breast and liver tumors [10, 19]. Recently published data demonstrated the method's ability in differentiating between different vascular malformation types [28]. Post-treatment changes, for example after trans-arterial chemoembolization of hepatocellular carcinomas, could be visualized with CEUS and color-coded perfusion imaging [20]. Therefore, the method might contribute to the monitoring of interventional procedures.
In this study patients with VM were examined with CEUS on exactly the same position before and after percutaneous ethanol-gel sclerotherapy.
Thus, we wanted to examine the ability of CEUS for differentiation between healthy tissue and open malformation portions as well as investigate if CEUS might be a reliable diagnostic tool for monitoring and for therapy control of VM sclerotherapy with the newly established ethanol-gel.
Material and methods
All included patients presented at the tertiary care Vascular Anomalies Center (VAC) between 05/2014 and 12/2014 and were diagnosed with VM according to an exact medical history, a thorough clinical examination, and magnetic resonance imaging (MRI). Typical medical histories were recurrent episodes of pain and swelling, discoloration, and functional impairment. Depending on the VM localization clinical examination revealed soft palpable masses and discoloration, but no hyperthermia and no thrills. MR signs for VM were pronounced hyperintensity in T2 STIR, phleboliths, the lack of flow-voids, no dilated afferent arteries, and after contrast enhanced time-resolved MRI contrast-pooling in dilated veins. If patients suffered from pain and complications like thrombophlebitis due to the VM, interventional treatment was indicated and the patients were scheduled for percutaneous sclerotherapy sessions with ethanol-gel (ScleroGel®, ab medica, Düsseldorf, Germany). As most patients suffered from extensive VM and the sclerosant dose per treatment is limited, two sclerotherapy sessions were planned with a time-lag of at least 4 weeks. Thus, we wanted to ensure, that the inflammation induced by the first treatment has healed completely before the second sclerotherapy. If patients were free from symptoms after the first interventional treatment, the second appointment was cancelled.
Institutional review board approval for this prospective diagnostic study was obtained (ethics number 13-101-0116).
Patients –in case of children their caregivers –gave their written informed consent for study participation as well as for the injection of ultrasound contrast medium. The institutional review board additionally approved of sonography with the application of ultrasound contrast medium before and after interventional treatment in all patients suffering from vascular malformations including children (ethics number 13-101-0063). As the contrast medium application is not licensed in children but thought to be a safe method [25] the use was off-label. Exclusion criteria for the application of ultrasound contrast medium were neurodermatitis, airway disease, heart disease, and known allergy to MRI and/or CT contrast medium.
Prior to interventional treatment, patients underwent sonography according to a predetermined protocol. Two clinically experienced radiologists (together more than 3000 examinations every year for more than ten years) examined the patients together at the interdisciplinary ultrasound department with a linear 6–9 MHz multi-frequency high-resolution transducer at an Acuson S2000 ultrasound machine (Siemens, Erlangen, Germany). After examination of the whole affected body part and exclusion of deep vein thrombosis, sonography was centered on the VM. Blood flow was detected with Power Doppler and CCDS.
The intended treatment area, representing the most painful area, was selected in accordance with the interventional radiologist; the exact transducer position was marked on the skin and photographed.
Resuscitation facilities were available during contrast medium injection.
The thyroid gland ultrasound program was selected; then contrast mode was preset including pulse inversion harmonic imaging (PIHI) and low mechanical index techniques (MI < 0.2) [26] and both, B-mode and contrast picture, were displayed on the monitor. A second-generation ultrasound contrast medium (sulphur hexafluoride microbubbles, SonoVue®, Bracco, Milan) without toxic side effects for the kidneys or the thyroid gland was applied. After contrast medium injection the cannula lying in a cubital vein was flushed with 10 ml of saline solution. A video loop was started as soon as the contrast medium bubbles were visible on the screen; it was stored for 60 sec.
Afterwards a machine integrated perfusion software was applied in two regions of interest (ROIs). The quantitative analysis was executed on a color-coded map displaying results for the parameter area under the curve. One individually adopted ROI was placed in the VM center (Fig. 1), a second one in surrounding, healthy tissue (Fig. 2). Four parameters were calculated for each ROI [13]: peak enhancement (peak, %; percentage of maximum intensity to the baseline signal intensity during the bolus transit), time to peak (TTP, s; velocity of contrast enhancement), area under the curve (AUC, % s; blood volume), and mean transit time (MTT, s; wash-in and wash-out time); results were documented.
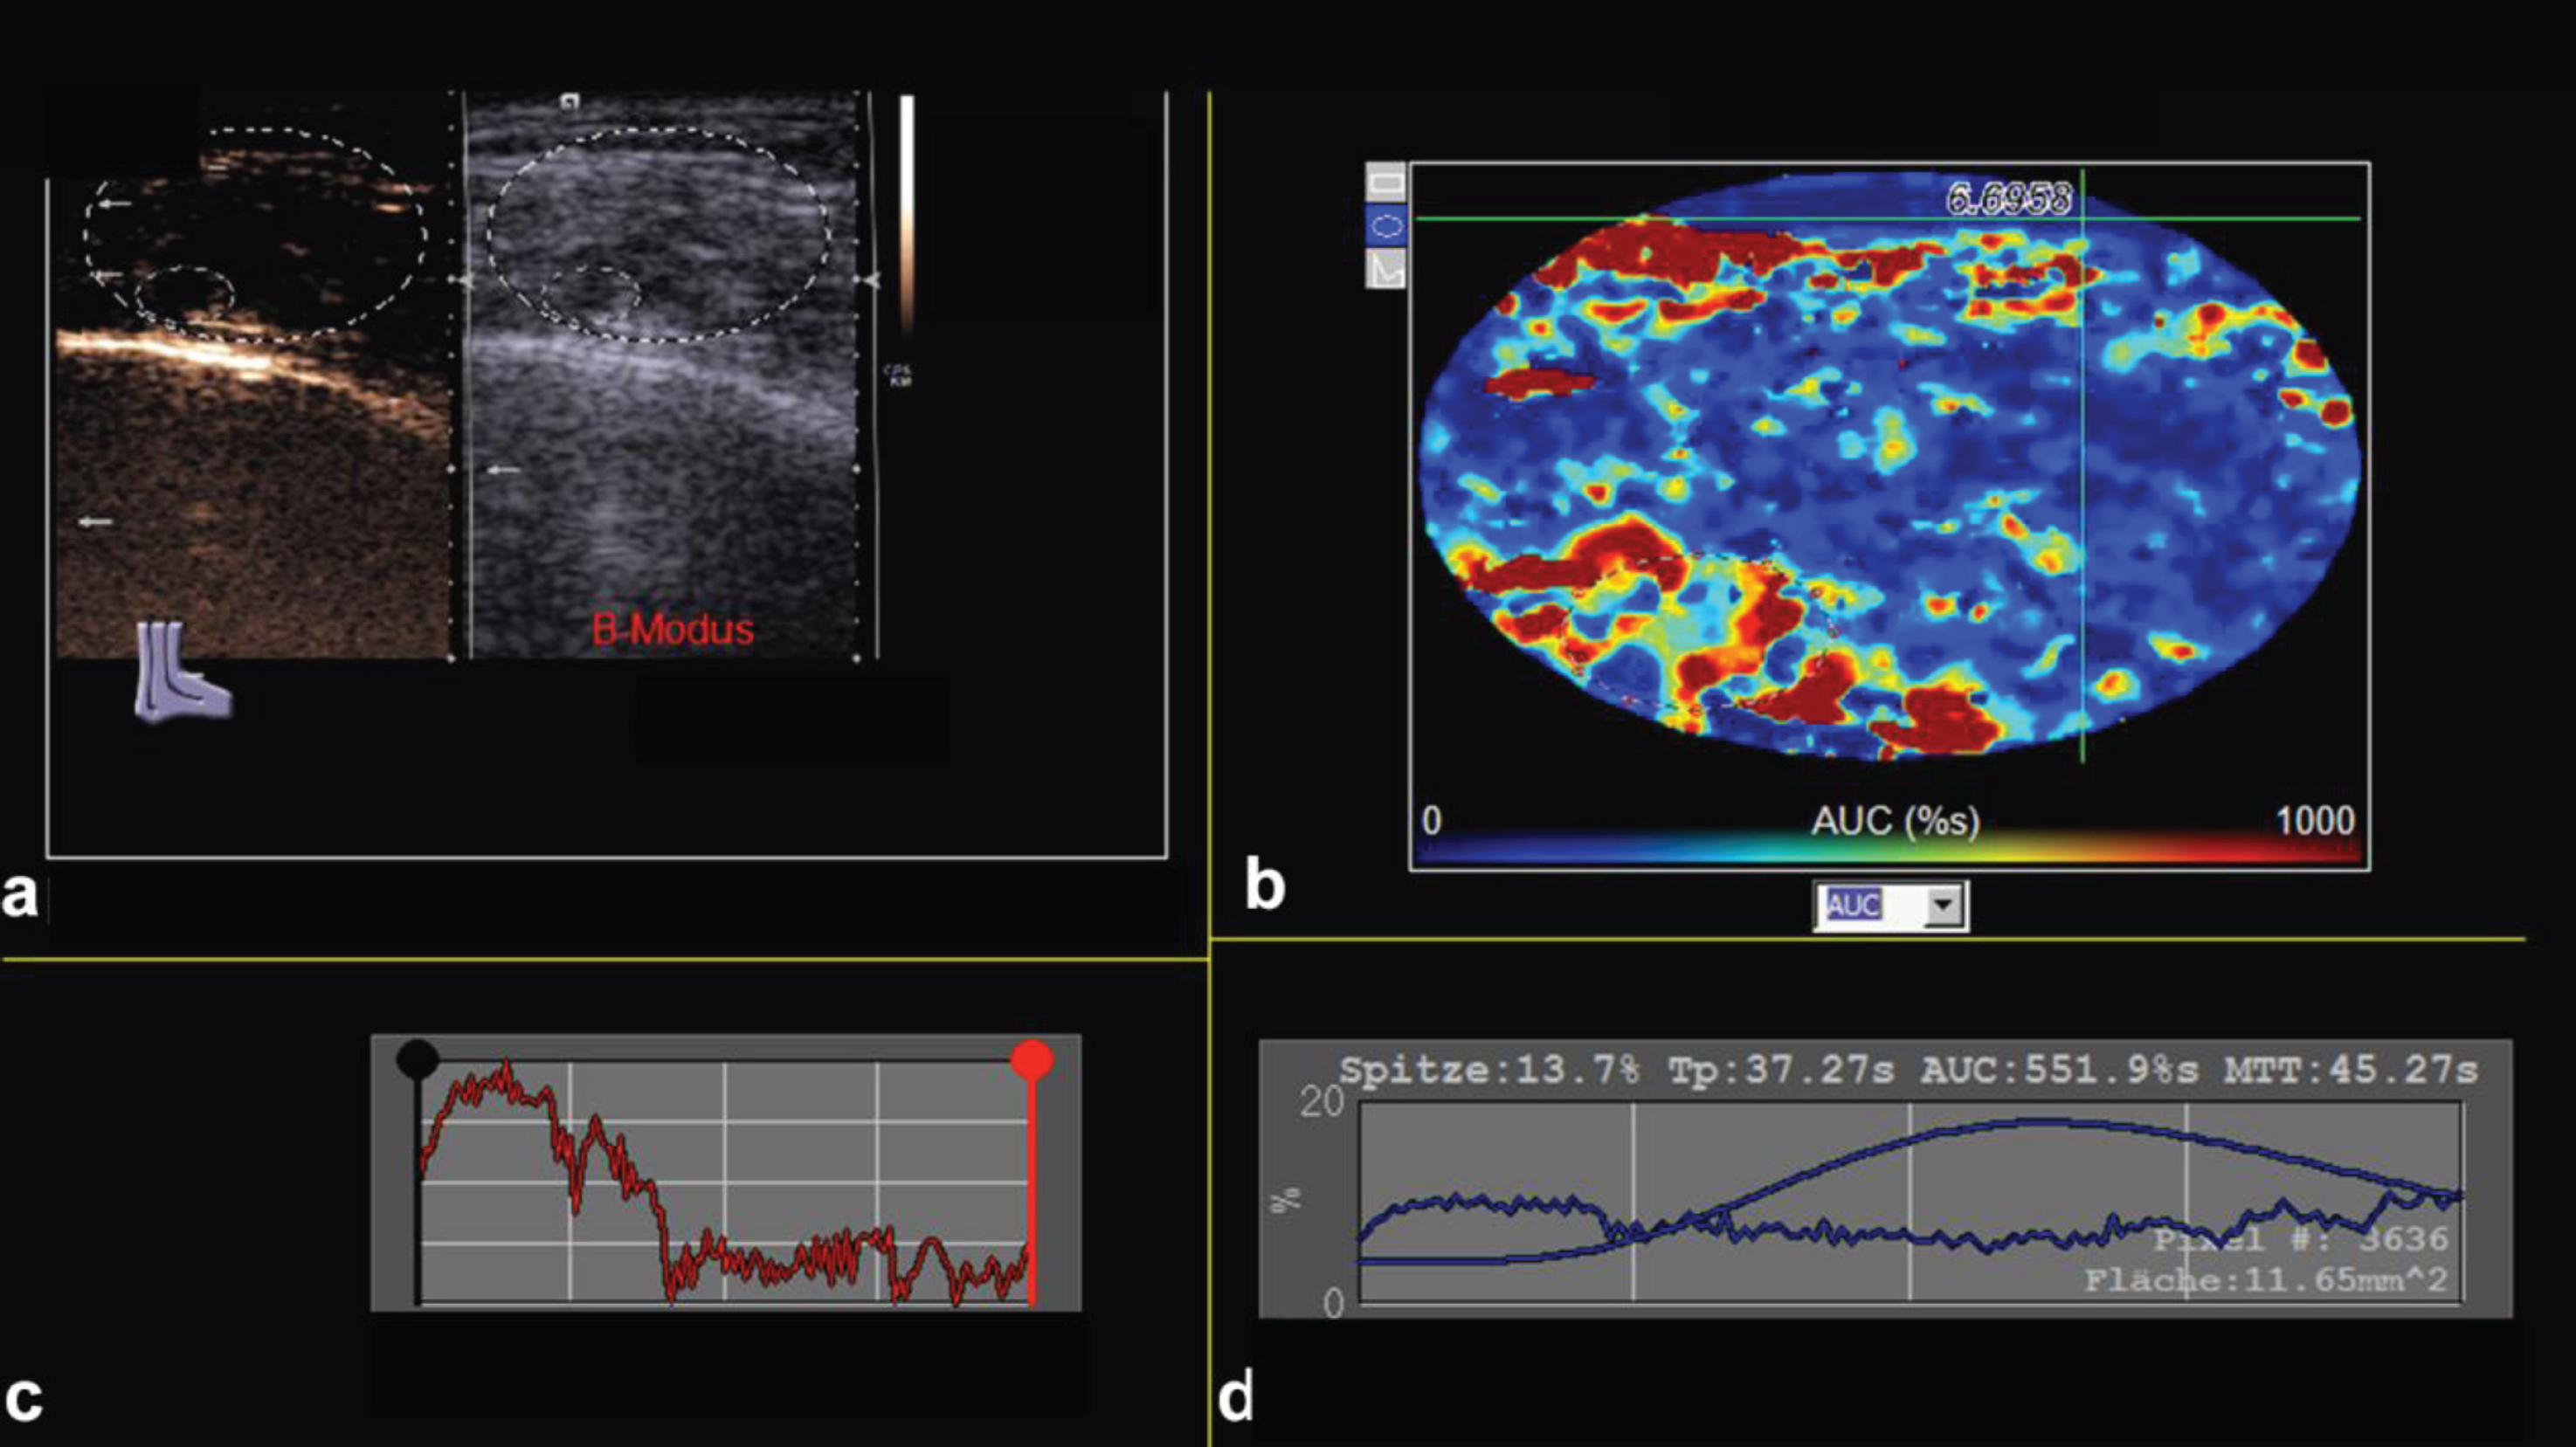
20-year-old female with VM over the left ankle prior to sclerotherapy. a) split screen mode displaying CEUS and B-mode images; b) color-coded perfusion map with ROI in the VM center; bluely coded areas express a low, red areas a high area under the curve; c) dynamic curve analysis of contrast-enhancement over 60 sec; d) quantification of different parameters in the VM center. Spitze: peak enhancement, Tp: time to peak, AUC: area under the curve, MTT: mean transit time.

Same 20-year-old female patient with VM over the left ankle prior to sclerotherapy. a) split screen mode displaying CEUS and B-mode images; b) color-coded perfusion map with ROI in surrounding tissue; bluely coded areas express a low, red areas a high area under the curve; c) dynamic curve analysis of contrast-enhancement over 60 sec; d) quantification of different parameters in the healthy, surrounding tissue. Spitze: peak enhancement, Tp: time to peak, AUC: area under the curve, MTT: mean transit time.
Then patients underwent interventional sclerotherapy.
As patients regularly suffer from inflammation immediately after sclerotherapy and healing of treated malformation portions takes a couple of weeks, approximately three months after the last interventional therapy patients were scheduled for a follow-up examination and presented between 10/2014 and 04/2015.
According to the marked transducer position before treatment, CEUS was executed at exactly the same position in analogy to the pre-treatment examination. Again, two ROIs were placed in the VM center (Fig. 3) and in healthy, surrounding tissue and perfusion analysis was executed for peak, TTP, AUC, and MTT.
Results of perfusion analysis prior to and after sclerotherapy in the VM and the surrounding tissue were compared using Wilcoxon signed rank test; p-values <0.05 were regarded statistically significant.
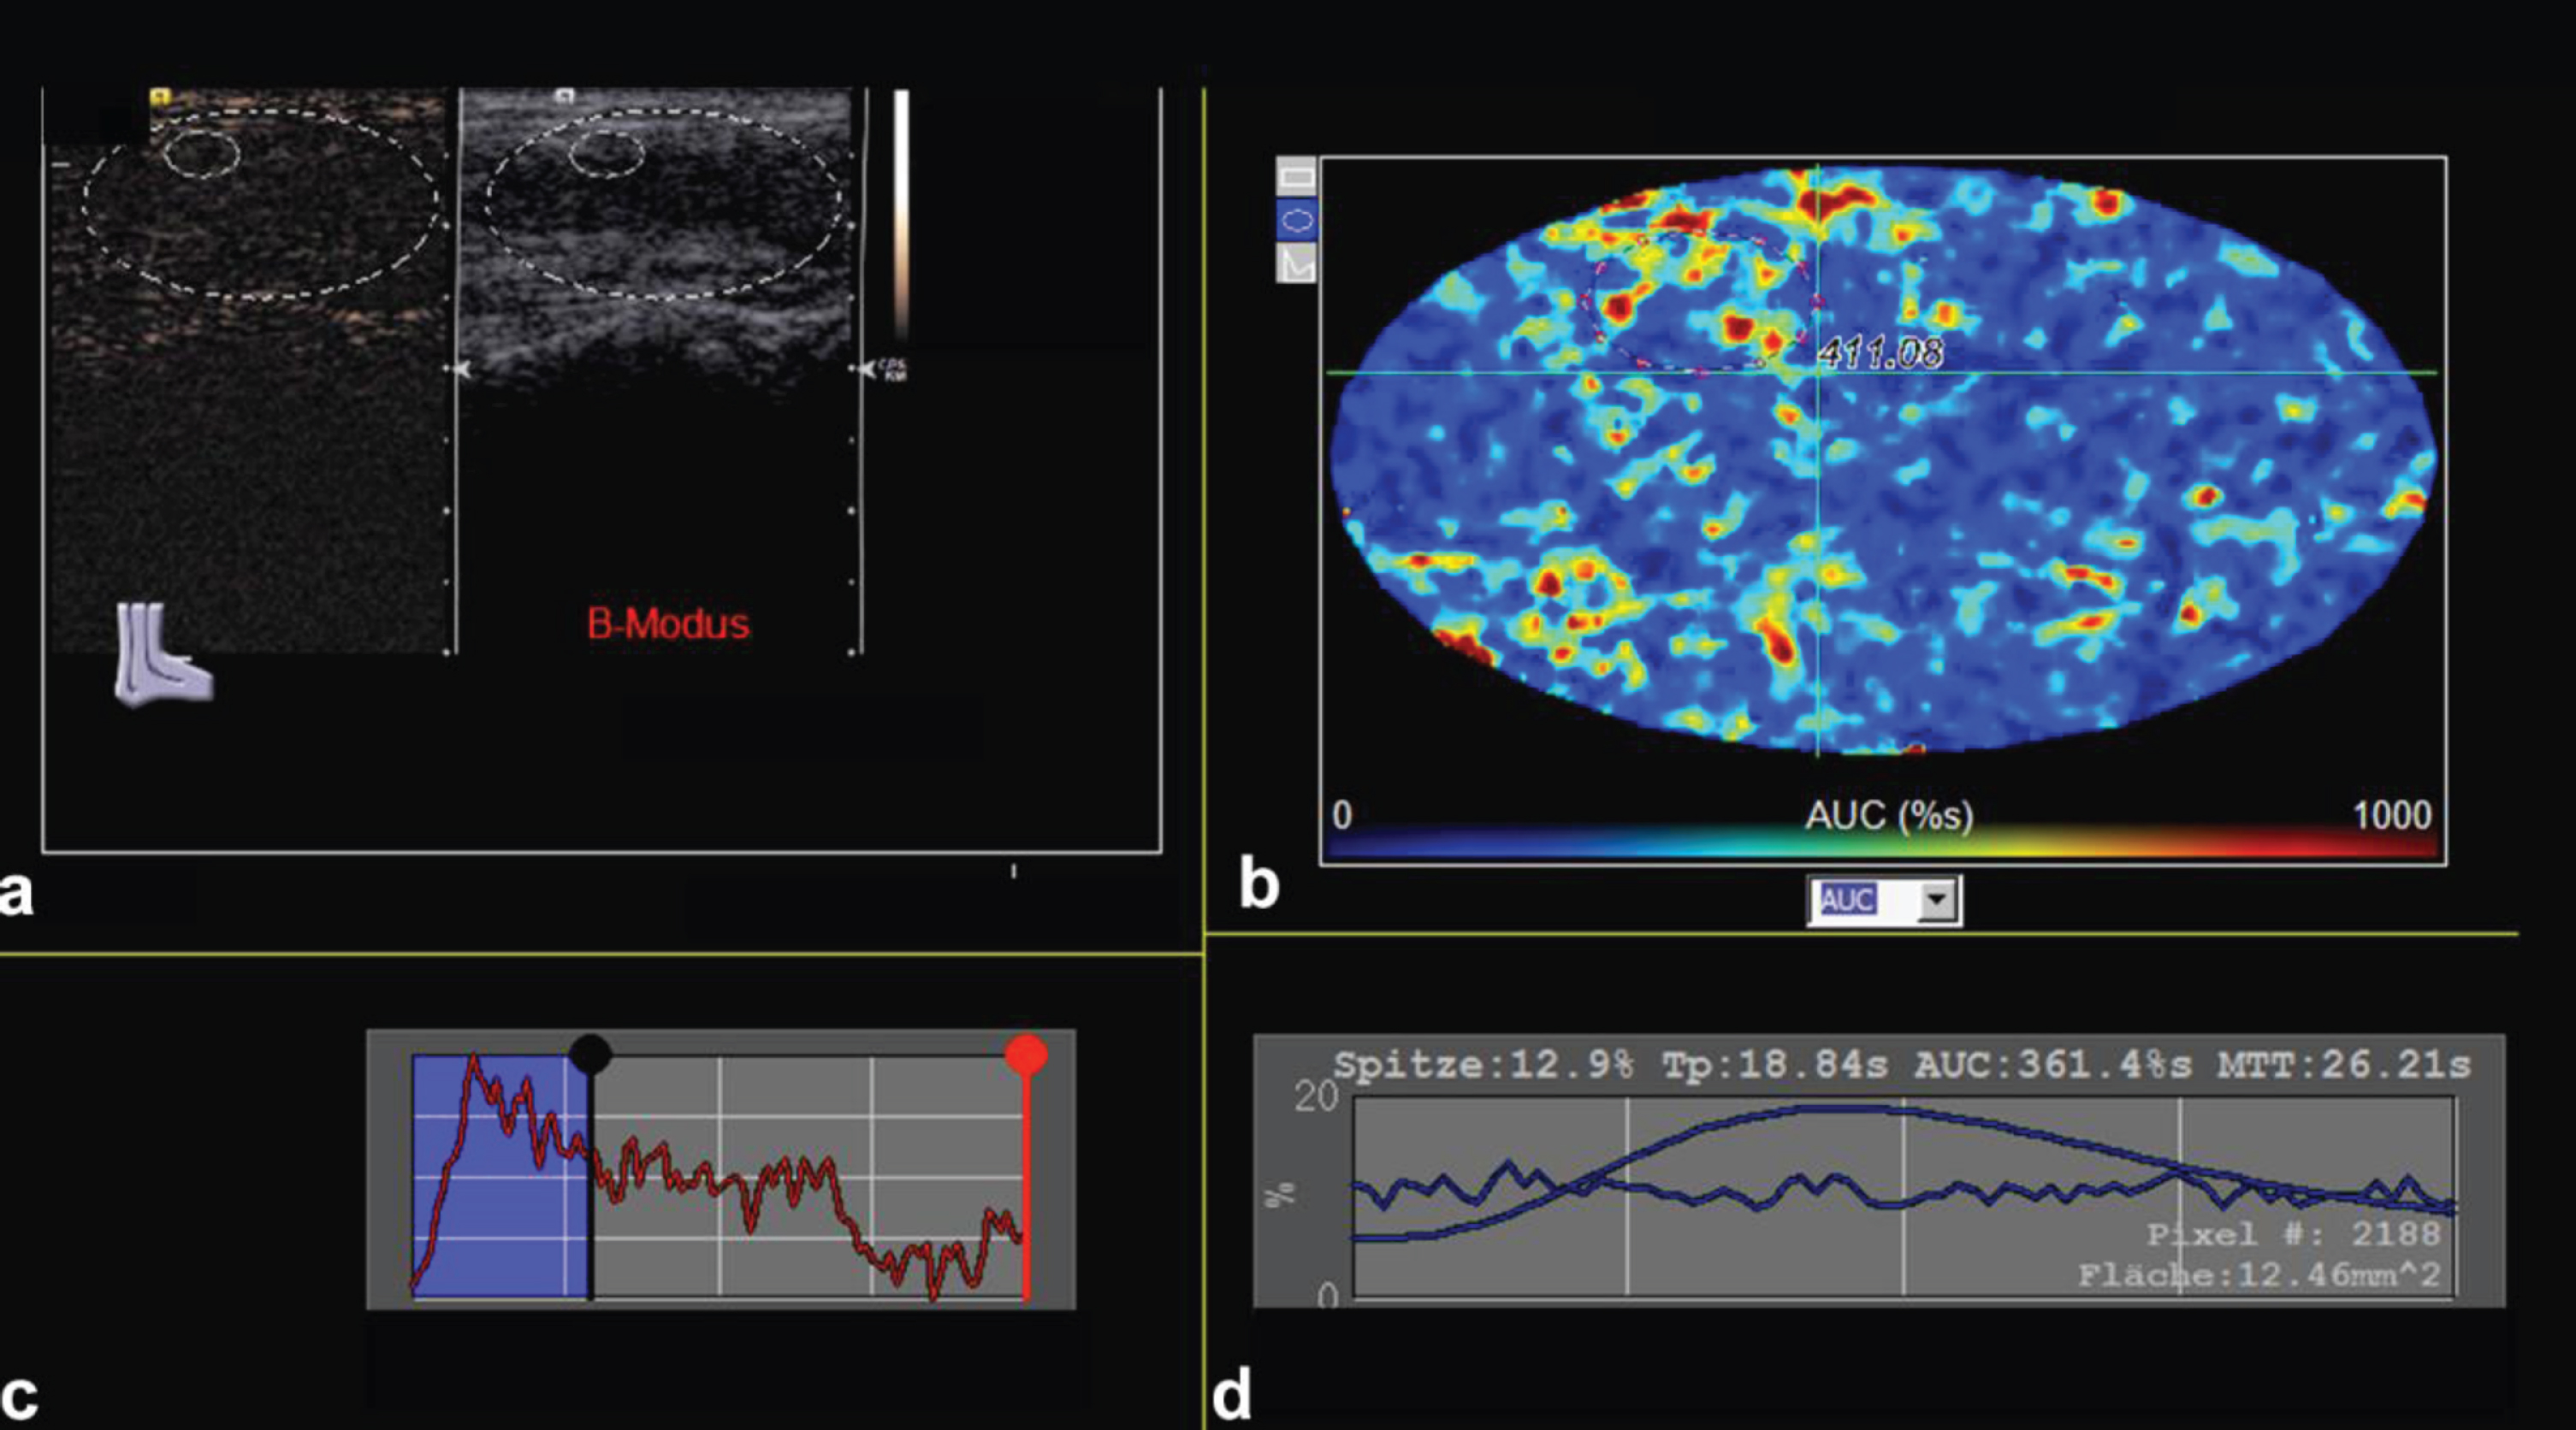
Same 20-year-old female patient with VM over the left ankle after sclerotherapy. a) split screen mode displaying CEUS and B-mode images; b) color-coded perfusion map with ROI in the VM center; bluely coded areas express a low, red areas a high area under the curve; c) dynamic curve analysis of contrast-enhancement over 60 sec; d) quantification of different parameters in the VM center. Spitze: peak enhancement, Tp: time to peak, AUC: area under the curve, MTT: mean transit time.
Of 31 informed and consented patients 8 patients dropped out: examination was carried out at another ultrasound machine in three patients, sonography was incomplete in four patients, and one patient suffered from neurodermatitis and thus contrast medium injection was not indicated.
The mean age of the remaining 23 patients (19 females, 4 males) was 25.3 years (6.6–46.5 years). In four patients the malformation was located in the face (in two patients on the left, in two patients on the right side). In three patients the left, in another three patient the right upper extremity was affected, and in 13 patients the lower extremity was concerned (in six patients the left, in seven patients the right side). One patient suffered from an old thrombosis, representing no contraindication for ethanol-gel sclerotherapy. Averagely 0.032 mL of contrast medium/Kg bodyweight were administered for CEUS (0.014–0.047 ml/Kg body weight), based on VM location. The maximal dose of 2.4 ml was not exceeded. No minor or major complication occurred after the injection of sulphur hexafluoride microbubbles.
Three patients were free of symptoms after the first interventional therapy; thus a second sclerotherapy session was not indicated. In total 20 patients were treated twice and overall 43 sclerotherapy sessions were executed. Different data of this study group was published beforehand. Patients' welfare improved significantly [33] and ethanol-gel sclerotherapy seems to be safe and effective [27].
The results of perfusion analysis in the VM and the surrounding tissue before and after sclerotherapy are displayed in Table 1, the different p-values in Table 2 respectively.
Results of perfusion analysis before and after treatment with ethanol-gel plus/minus standard deviation (TTP: time to peak, AUC: area under the curve, MTT: mean transit time)
Results of perfusion analysis before and after treatment with ethanol-gel plus/minus standard deviation (TTP: time to peak, AUC: area under the curve, MTT: mean transit time)
Before and after treatment, peak enhancement was significantly higher in the VM center in comparison to surrounding tissue (before treatment: p = 0.000029; after treatment: p = 0.00000024).
In the VM center the comparison of results of peak prior to and after treatment resulted in no statistically significant difference (p = 0.6).
In the surrounding tissue data was significantly higher after treatment in comparison to pre-treatment results (p = 0.04).
TTP
TTP was statistically significant longer in the VM center in comparison to healthy surrounding tissue prior to and after treatment (before treatment: p = 0.000017; after treatment: p = 0.0083).
Comparing data in the VM center before and after treatment, TTP was statistically significant shorter after treatment (p = 0.018).
Before and after treatment the comparison of TTP in the surrounding tissue revealed no statistically significant results (p = 0.8).
AUC
Before and after treatment AUC was statistically significant higher in the VM center compared to healthy, surrounding tissue (before treatment: p = 0.00000024; after treatment: p = 0.00000024).
Neither the comparison of results in the malformation center prior to and after treatment (p = 0.2) nor in healthy surrounding tissue prior to and after treatment (p = 0.24) revealed statistically significant differences.
MTT
Prior to treatment MTT was significantly longer in the VM center in comparison to healthy surrounding tissue (p = 0.00025). After treatment there was no statistically significant difference (p = 0.07).
Comparing pre- and post-treatment results of MTT in the VM center, the time was significantly shorter after therapy (p = 0.007).
Regarding surrounding tissue prior to and after sclerotherapy, MTT did not change significantly (p = 0.5) (Table 2).
Comparison of results in different ROIs before and after treatment (TTP: time to peak, AUC: area under the curve, MTT: mean transit time)
Comparison of results in different ROIs before and after treatment (TTP: time to peak, AUC: area under the curve, MTT: mean transit time)
VM is the most common type of congenital low-flow vascular malformations [1, 6]. Depending on its localization and size, patients with VM suffer from symptoms like pain and cosmetic or functional impairment. Whereas formerly an operation with a subtotal resection of malformation portions was the most common treatment option, nowadays percutaneous sclerotherapy is regarded as the therapy of choice [11, 27].
Different sclerosing agents are on hand, each of them with pros and cons. Alcohol, being a potent sclerosant, is coincided with systemic side effects like hypertension, macroscopic hemoglobinuria, and pulmonary embolism [2, 31]. Gelified ethanol, with an aggressive effect locally but a higher viscosity compared to pure alcohol and, thus, only rare systemic side effects, seems to be a potent and safe alternative [5, 27]. In our study patients suffering from VM were treated once to twice percutaneously with ethanol-gel.
The range of applications of CEUS for the dynamic visualization of tissue microvascularization has been investigated for a variety of indications and increases permanently [15, 23]. For example, the recently published EFSUMB guidelines for non-liver application of CEUS state, that CEUS has a high diagnostic accuracy for the detection of alterations of soft tissue vascularization in patients with free tissue transplants [26].
Simultaneously studies have demonstrated the potential of a machine integrated perfusion analysis [7, 20], indicating its ability in distinguishing between different types of vascular malformations and in displaying therapy-induced changes [28, 32]. To our knowledge local effects of ethanol-gel in the therapy of VM on CEUS results have never been examined beforehand.
Under the assumption, that CEUS in combination with a perfusion analysis is capable of differentiating VM center from healthy tissue as well as tissue alterations before and after treatment we examined prospectively, if sclerotherapy with ethanol-gel also induces with CEUS detectable changes of perfusion parameters in the VM center. Furthermore, the aim of our study was to identify parameters allowing for differentiation between healthy, dysplastic, and treated VM portions. And finally, we wanted to investigate the effect of ethanol-gel on healthy, surrounding tissue. Therefore, we identified absolute values for four parameters (peak enhancement, TTP, MTT, AUC) in the VM center and in healthy surrounding tissue at exactly the same, marked and documented transducer position before and after sclerotherapy with ethanol-gel. Results were compared among each other.
Prior to therapy all calculated parameters were significantly higher in the VM center compared to results in surrounding, healthy tissue. Consequently, all of them might identify the most intensive perfused, central VM portion and thus support the exact treatment planning.
Comparing results between VM center and surrounding tissue after treatment, data for peak, TTP, and AUC was still significantly higher in the VM center post therapeutically. MTT was the only parameter that changed significantly in the VM center after treatment and approximated to healthy, surrounding tissue. An explanation might be, that sclerotherapy minimizes blood pooling in the VM and thus MTT –reflecting the wash-in and wash-out time –decreases.
In the VM center we expected a reduction of perfusion after ethanol-gel therapy assuming that sclerotherapy induces an obliteration of blood vessels and consequently blood pooling in the dysplastic venous channels no longer takes place. Consequently TTP, indicating the velocity of contrast enhancement, and MTT, measuring the wash-in and wash-out time of contrast medium, were significantly shorter after sclerotherapy. Simultaneously AUC, as a marker for the blood volume, and peak, representing the percentage of maximum intensity during the transit of the bolus, did not change significantly. This might be due to the fact, that VM is a low-flow malformation with a steady blood flow and no high blood volume. Therefore, changes of blood volume or maximum intensity after sclerotherapy might be only subtle.
Surrounding tissue seems hardly affected by sclerosing therapy with ethanol-gel. Comparing results prior to and after treatment TTP, AUC, and MTT did not change significantly. That could indicate, that the viscous ethanol-gel stays and operates where it is injected without diffusion into surrounding tissue and without inducing additional inflammation and damage there.
In contrast percentage peak increased after therapy (p = 0.04) in the healthy tissue. In VM blood pooling –and thus a pooling of contrast medium - takes place. The occlusion of dysplastic vessels might lead to a quicker blood flow in the capillary system and thus a higher peak enhancement in the healthy capillary system.
In summary all four displayed perfusion parameters were able to differentiate healthy tissue from untreated VM. After ethanol-gel therapy MTT, representing the wash-in and wash-out time, was the only marker that assimilated in VM center and surrounding, healthy tissue. Therefore, MTT might be a diagnostic tool for the efficiency control after ethanol-gel sclerotherapy.
Furthermore, TTP and MTT might be possible parameters to differentiate untreated, perfused from with gelified ethanol sclerotized VM portions and thus could support monitoring and further therapy planning of patients with VM pre-treated with gelified ethanol.
Limitations
A limitation of our study is the low patient number. Furthermore, all included patients suffered from symptomatic VM and were scheduled for treatment. This might be a selection bias, as they are affected more severely in comparison to non-symptomatic patients, and might have an effect on flow patterns in VM and thus influence CEUS results.
Conclusion
CEUS as a dynamic and safe examination of patients suffering from symptomatic VM including children enables the exact differentiation between VM and healthy surrounding tissue. Especially TTP and MTT might assist the planning and monitoring of interventional therapy with ethanol-gel as well as the control of success after sclerotherapy.
Conflict of interest
The authors have no conflict of interest to declare.