






Abstract
Circulating platelets are sometimes exposed to high shear rate environments due to vascular stenosis, and the effect of transiently elevated pathological high shear rates on platelet activation and aggregation function has not been clarified. The aim of this study was to investigate the effect of pathological high shear rate (8302s-1) exposure time (3.16-25.3 ms) on platelet activation and aggregation function. In addition, by adding active ingredients of antiplatelet drugs such as ASA (an active ingredient of aspirin), Ticagrelor, Tirofiban and GP1BA (platelet membrane protein GPIb inhibitor) in vitro, we studied TXA2, P2Y12-ADP, GPIIb/IIIa-fibrinogen and GPIb /IX/V-vWF receptor pathways to determine platelet activation function mediated by pathological high shear rate. In this study, we designed a set of microfluidic chips with stenosis lengths of 0.5 mm, 1 mm, 2 mm, 3 mm, and 4 mm, all with 80% stenosis, to generate pathological high shear forces that can act at different times. The whole blood flowing through the microchannels was collected by perfusion of sodium citrate anticoagulated whole blood at a physiological arterial shear rate (1500 s-1), and the expression levels of platelet surface activation markers (P-selectin and GP IIb/IIIa) and the degree of platelet aggregation were analyzed by flow cytometry; platelet aggregation patterns were observed by microscopic examination of blood smears. The results showed that shearing significantly increased platelet activation and aggregation levels compared to un-sheared whole blood, and the activation and aggregation levels increased with increasing duration of pathological high shear rate. In vitro inhibition studies showed that ASA barely inhibited the expression of P-selectin and PAC-1 on the platelet surface; Ticagrelor effectively inhibited the expression of both P-selectin and PAC-1; Tirofiban significantly inhibited the expression of PAC-1 on the platelet surface and slightly inhibited the expression of P-selectin; GP1BA significantly inhibited the expression of both. Our results suggest that transient pathological high shear rate (8302s-1) exposure can induce platelet activation in a time-dependent manner; however, the mechanism is more complex and may be due to the following reasons: transient elevated pathological high shear rate activates platelets through the GPIb/IX/V-vWF receptor pathway, and after platelet activation, its surface membrane protein GPIIb/IIIa receptors activate platelets through fibrinogen to form platelet-platelet aggregates, and further activation of active substances such as ADP and TXA2 released by platelet alpha particles, which contribute to the formation of irreversible platelet aggregation.
Introduction
Cardiovascular disease is a serious threat to human health and is the main cause of death. Artificial cardiovascular devices such as vascular grafts and stents are often used for surgical treatment or replacement of cardiovascular organs in patients [1]. Studies have shown that when artificial vascular grafts are implanted in blood vessels, the vascular grafts usually become narrowed due to intimal fiber proliferation [2]. During these events, blood flow is accelerated, resulting in elevated levels of shear stress. Because platelets in patients with arterial thrombotic diseases are usually mildly activated [3, 4], these implanted medical devices not only save lives, but also increase the risk of thrombosis [5]. Recent investigations have found that shear exposure can lead to a range of responses, including cell destruction, platelet activation, platelet aggregation and platelet receptor shedding [6, 7].
A Pathological high shear environment plays a key role in platelet activation and can promote a series of biochemical reaction processes such as vWF binding to platelet surface membrane protein GPIb, Ca2+ signaling, actin contraction and cytoskeletal rearrangement [8]. In vitro studies have found that turbulent stress levels from 10 to 100 Pa are considered to trigger platelet activation [9, 10], with a more precise threshold known as the Hellum criterion, i.e. if the product of shear stress and its duration exceeds 3.5 pa [11], the platelets will be activated. When the stress reaches 800 Pa, platelets may undergo hemolysis [12]. On the other hand, a high pathological shear rate may also lead to platelet activation and impaired coagulation pathways. Al-Tamimi et al. (2012) found that the high shear force generated in VAD can lead to the loss of vWF multimers and the shedding of platelet receptors. Research has shown that the material properties of many grafts themselves may lead to platelet activation [13]. Although many studies have investigated the effect of pathological high shear on platelet reactivity, most studies have been conducted in vertebral platelet viscometers unrelated to pathological flow. Such studies are usually characterized by low applied shear force effects with a long duration of action, objectively increasing the risk of vWF molecule breakage and associated receptor shedding. With the development of micro- and nanotechnology and sensors, it has been possible to simulate local vascular characteristics in vitro, creating a fluid shear environment similar to that of the microvasculature in vivo, and to study the interactions between blood cells and plasma proteins in it. Rahman and Hlady (2021) designed microfluidic chip models with different degrees of stenosis and found that as the degree of vascular stenosis increased, the degree of platelet aggregation and activation downstream of the stenosis also increased. These studies have improved our understanding of the mechanisms of shear-induced platelet activation; however, the relationship between fluid dynamics and platelet activation has not been fully elucidated.
Activation of circulating platelets in stenotic vessels requires complex biochemical reactions and mechanical transduction. vWF changes its tertiary structure from a spherical to an elongated state when platelets are exposed to sufficiently high shear rates (>6000 s-1), exposing more of the A1 domain for binding. vWF binds to the platelet surface membrane protein GP Ib, which opens calcium channels and activates platelets [14]. This process occurs in milliseconds within a few hundred microns of platelet displacement through the stenosis [15]. What we do not know is whether increasing the duration of pathological high-shear action can have an effect on downstream platelet activation and aggregation.
To address these issues, microfluidic chip models with different narrow lengths (0.5 mm, 1 mm, 2 mm, 3 mm, 4 mm) were designed to provide a shear environment with different action times (3.16 ms, 6.33 ms, 12.7 ms, 19.0 ms, 25.3 ms). Whole blood flowing through the microchannels was collected, and the expression of platelet surface markers (P-selectin and activated GP IIb/IIIa) and platelet aggregation were detected by flow cytometry. Also, platelet aggregation patterns were observed by smear staining microscopy. In addition, we further investigated the possible mechanism of action by in vitro inhibition assay.
Materials and methods
Materials
Sylgard 184 polydimethylsiloxane (Dow Corning, USA), ASA/Ticagrelor/Tirofiban (TOPSCIENCE, USA), CD42b (Beijing Bioss Biotechnology Co., Ltd.), bovine serum albumin (ORTHO, USA), diphosphate Adenosine (TOPSCIENCE, USA), CD61 (Integrin beta 3) Monoclonal Antibody (VI-PL2), PerCP-eFluor 710/CD62P (P-Selectin) Monoclonal Antibody (AK-4), PE/PAC-1 Monoclonal Antibody (PAC-1), FITC (ebioscience, USA), PBS (gibco, USA), paraformaldehyde (Biyuntian Biotechnology Company), Swiss-Gimza staining solution (Shanghai Genesis Technology Co., Ltd.), microscope slides (Jiangsu Shitai Ltd.)
RSP01-CS two-way push-pull precision injection pump (Jiashan Ruichuang), IX71 inverted fluorescence microscope (Olympus, Japan), plasma cleaner (PDG- 32G-2, Germany), vacuum vein collection tube (Shandong Weigao Technology Co., Ltd.), Solidworks software (Dassault Systemes, USA), Coreldraw software (Corel, Canada), flow cytometer (Beckman Coulter, USA), Flowjo software (BD Biosciences, USA), streampix5.0 software (Norpix, Canada), ImageJ software (NIH, USA), 2 ml syringe (Shandong Weigao Technology Co., Ltd.), GraphPad Prism (GraphPad Software, USA).
Fabrication of microfluidic chips
Microfluidic chips were processed by a soft lithography process based on photoreceptor dry film. Unlike the conventional soft lithography process, this study used photoresist dry film instead of liquid photoresist as the chip anode film. Photoreceptor dry film is a photopolymer material applied to the printed circuit board (PCB) process, which has the advantages of substrate adhesion, flatness, low exposure power consumption and low cost [16] It has the advantages of substrate adhesion, flatness, low exposure power and low cost. Reference for microfluidic chip preparation using photoresist dry film Literature [17]. The brief steps are: design the chip structure by Coreldraw software, and then prepare the mask by inkjet printer. The photoreceptor dry film is evenly pressed onto the glass plate (about 35 μm per layer) using a laminator, and then heated at 60°C for 3 min. After the glass plate is cooled and exposed, the area not covered by the mask undergoes photochemical reaction and becomes hard after UV irradiation, and then the glass plate is placed into the developing solution, and the undeveloped area is removed after the reaction, and the chip positive mold is made after drying. PDMS and curing agent are poured into the chip positive film in the ratio of 10 : 1, vacuumed, de-bubbled, and subsequently cured at 60°C for 3 h to form the microfluidic channel. The microfluidic chip was peeled from the chip positive mold and punched with a flat-ended punch. The clean slide and the microfluidic chip are treated with oxygen plasma to enable irreversible bonding between the two contact surfaces, and finally the microfluidic chip is produced. The microfluidic chip mainly consists of a sample cell, a microchannel and an outlet. The length, width, and height of the microchannel are 7 mm, 1 mm, and 70 um, respectively, and the diameters of the sample cell and outlet are 7 mm and 1.5 mm, respectively. The operating diagram of the analysis system is shown in Fig. 1b. The principle is: loading blood samples into the sample cell, controlling the flow of blood samples into the microchannel at a set shear rate through the negative pressure generated at the outlet, and recording the aggregation behavior of platelets in the microchannel using a microscope imaging system. A physical diagram of the analysis system is shown in Fig. 1c. The relationship between the input shear rate and the syringe pump flow can be calculated according to Poiseuille’s law, i.e.,
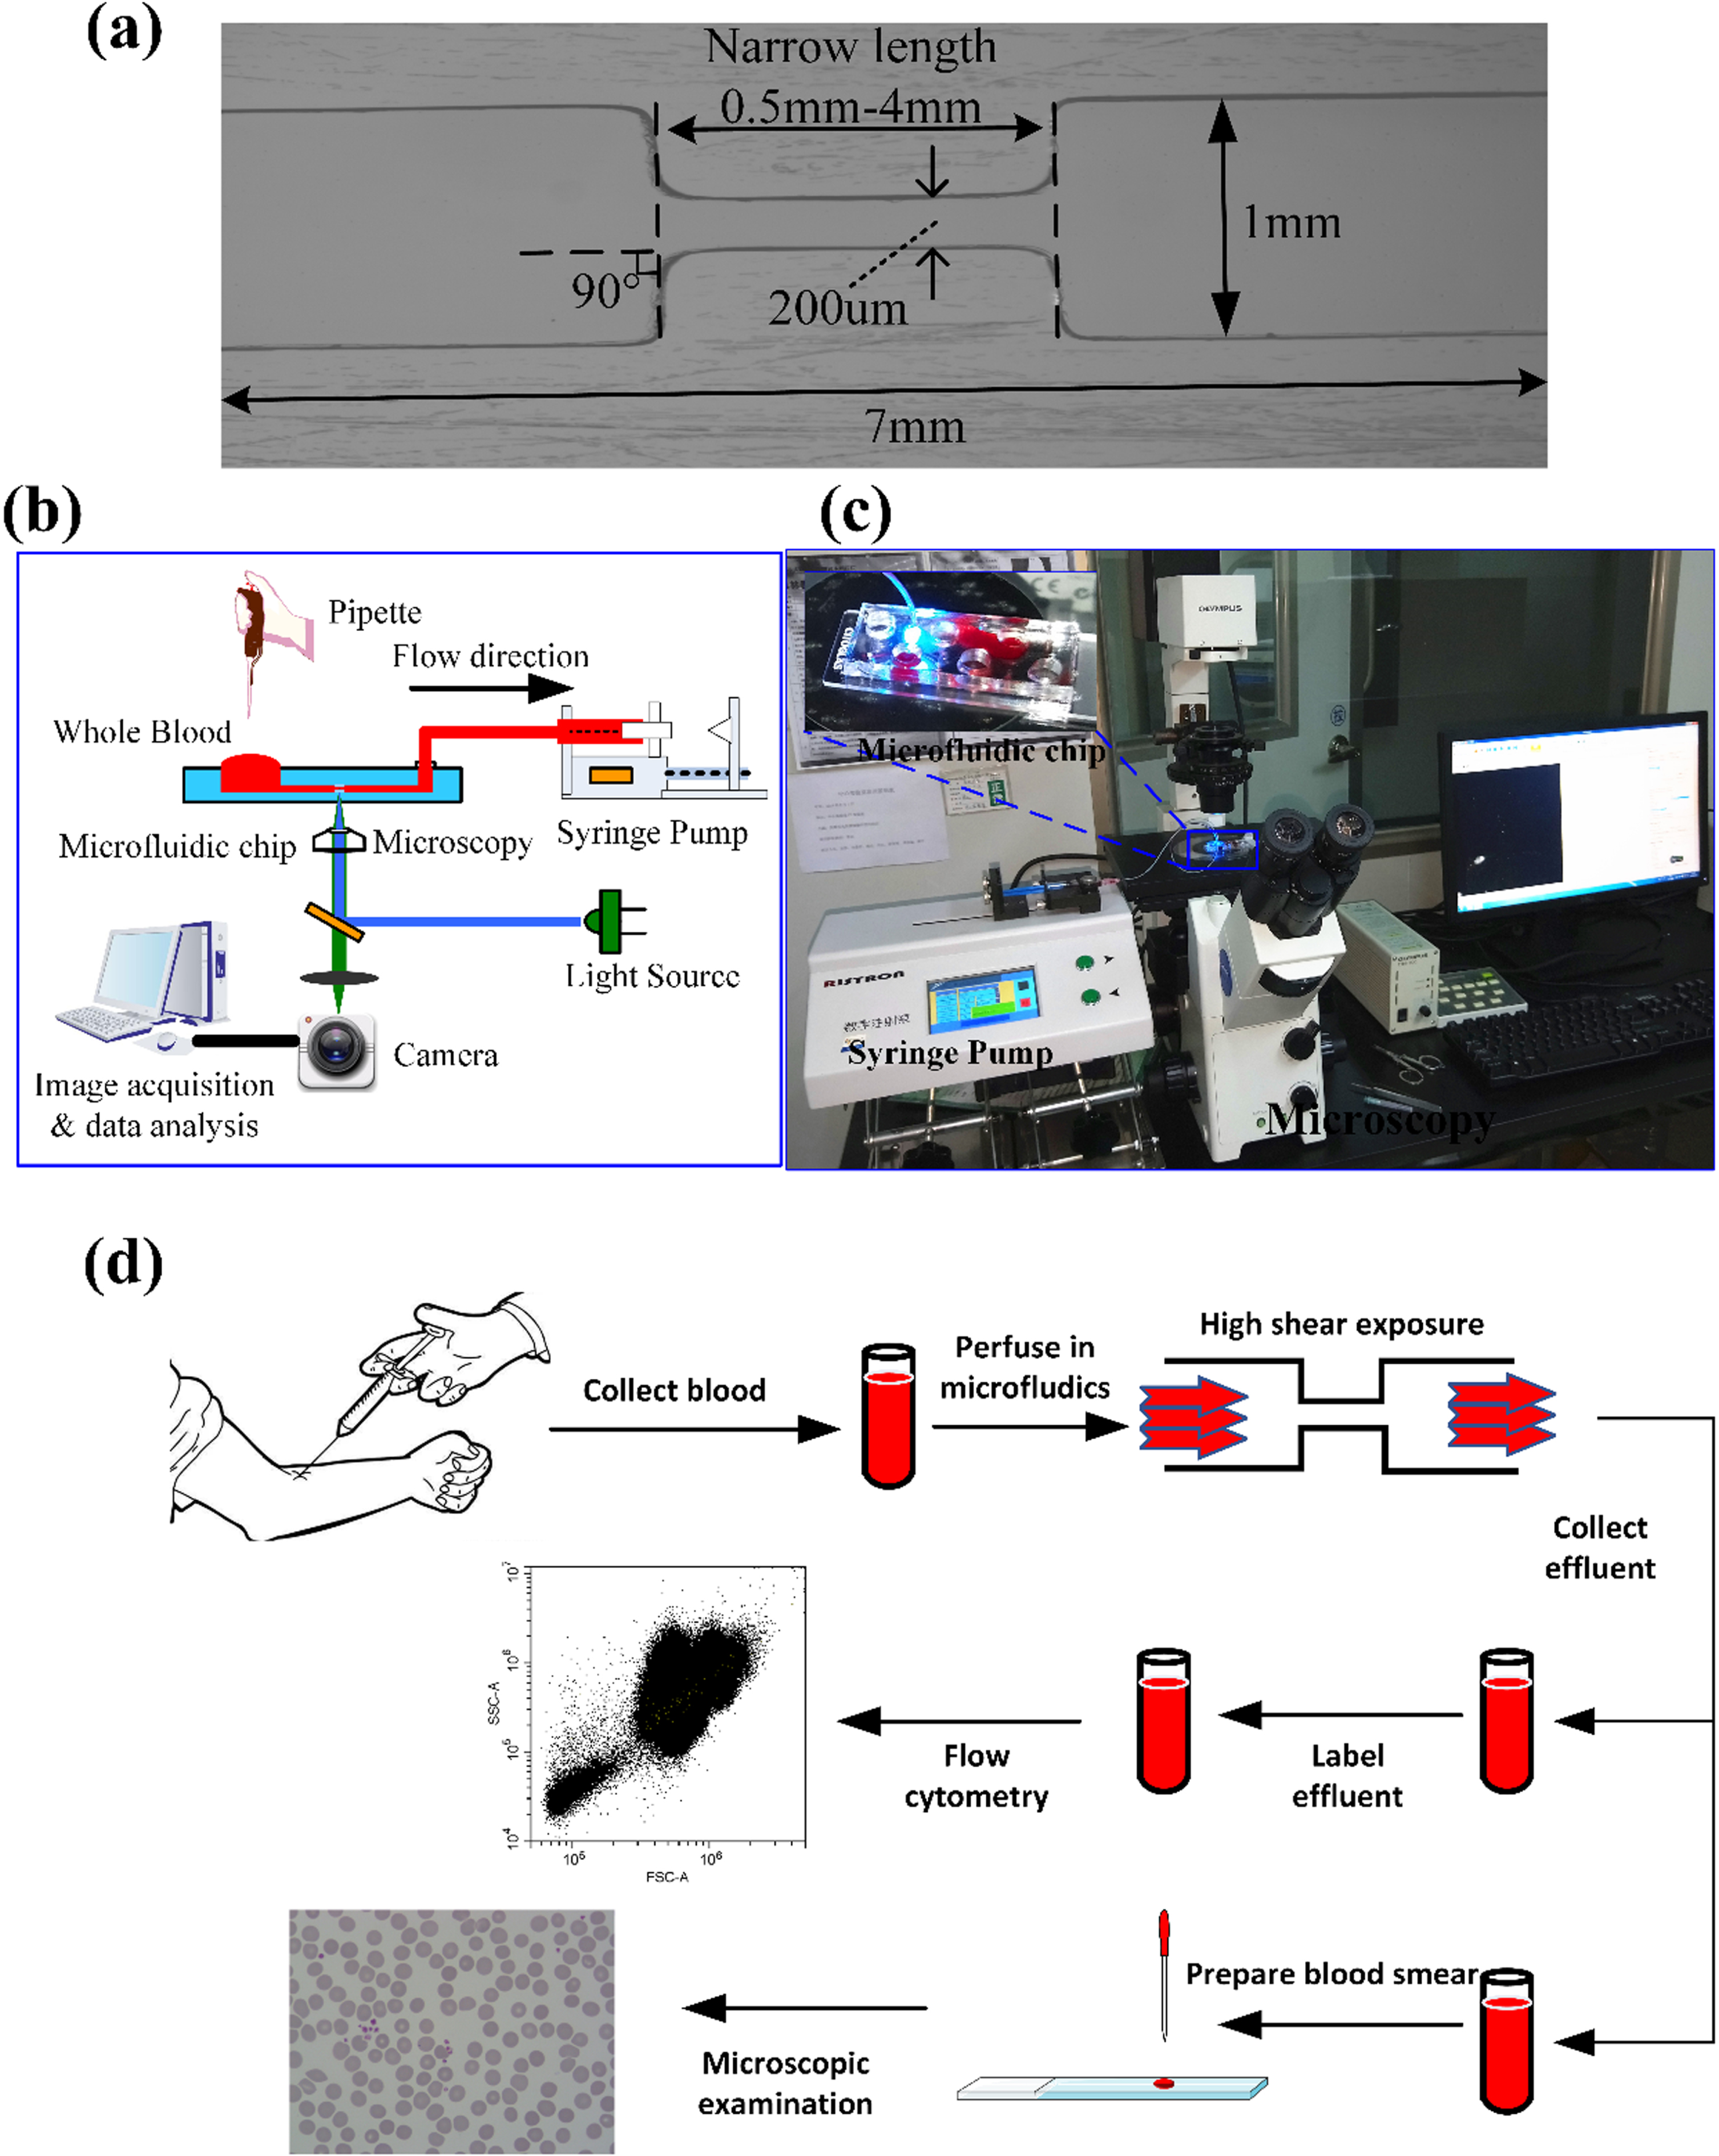
Schematic diagram of microfluidic chip structure and operating system. (a) Microfluidic chip structure parameters. (b)-(c) Schematic diagram and physical diagram of the microfluidic chip operating system. (d) Flow chart of experimental design.
Studies have reported that blood flow in capillaries without constriction produces a wall shear rate (WSR) between 500s-1 and 5000s-1. To simulate the in vivo hemodynamics, we set the outlet volume flow rate to 52 ul/min and the inlet to hydrostatic pressure so that the input shear rate value upstream of the stenosis is 1500 s-1 (the average physiological shear rate of the artery). The microchannel structure was designed by Solidworks software, and the wall shear rate and velocity distribution within the microchannel were analyzed computational fluid dynamics (CFD) by its fluid simulation unit (Solidworks flow simulation). The fluid properties are assumed to be a steady, incompressible laminar flow. 67,752 meshes are created inside the model, and the CFD solution converges to a residual reduction of six orders of magnitude in 155 iterations by solver operations.
Blood collection
Blood samples were collected from 6 healthy adult volunteers randomly recruited from the Chongqing Blood Center Yongchuan Branch between November and December 2021. The inclusion criteria refer to the definition of blood donors by Braune et al [18].: volunteers reported no history of medication, surgery or alcohol abuse within 1 month, and blood cell pressure, platelet count and coagulation index tests were within normal reference values. The study was approved by the Ethics Committee of Yongchuan Hospital, Chongqing Medical University (approval number: 20170318-12), and all subjects signed an informed consent form. Venous blood samples were collected by vacuum, and whole blood samples were anticoagulated with 1 : 9 (v/v) 3.2% sodium citrate, placed at room temperature, and used immediately once collected, and the relevant experiments were completed within 2 h.
Platelet activation study
Figure 1d shows a simple flow chart of the experimental design. The effect of shear exposure time on platelet activation function (CD62P, GP IIb/IIIa) was assessed by flow cytometry. Before perfusion of whole blood, the microchannels were blocked with 5% BSA for 1 h. After that, the microchannels were flushed with PBS. Whole blood was perfused into the sample pool, and 5ul of whole blood flowing through the microchannel was collected and added to a centrifuge tube with 5ul of PerCP-eFluor 710-labeled CD61, FITC-labeled PAC-1 and PE-labeled CD62P, respectively. 20 min of incubation was performed at room temperature and protected from light, followed by the addition of 1 ml 1% paraformaldehyde for fixation. Unstimulated whole blood and ADP-activated whole blood (final concentration 2uM) were used as negative and positive controls, respectively. The experiments were performed on a CytoFLEX flow cytometer using blue (488 nm) and red (633 nm) lasers as excitation light sources. The filter configuration of the fluorescence detector was APC-A700 780/60, FITC 525/40 and PE 585/42. The gating strategy of the analysis is detailed in Figure S2. Briefly, platelet populations were identified by forward scattering (FS) and CD61 monoclonal antibody, then platelet aggregates were excluded, and finally, the expression levels of CD62P and PAC-1 on the surface of individual platelets were determined. Data analysis was performed by flowjo software.
In this experiment, platelet activation studies at different shear exposure times (0.5 mm, 1 mm, 2 mm, 3 mm and 4 mm) and in vitro inhibition studies were performed at arterial physiological shear rates (1500s-1). The inhibition of ASA, Ticagrelor, Tirofiban and GP1BA was studied at the recommended concentrations of 2 μM, 2 μM, 2 μM and 5 μg/ml.
Platelet aggregation studies
Shear-induced whole blood was collected for quantitative and qualitative study of platelet aggregation levels by flow cytometry and blood smear microscopy, respectively. The analysis of platelet aggregation by flow cytometry was performed in the same way as in section 2.5; in brief, platelet clusters were identified by forward scattering (FS) and CD61 monoclonal antibody, and subsequently, individual platelet clusters were gated by FS-Width-FS-H, with the remainder being platelet aggregates [19]. The following is the procedure of smear microscopy: collect the whole blood flowing through the blocked microchannel, take 20 μl drops on the slide for blood smear and perform Swiss-Gimza staining. The procedure is as follows: add Swiss-Gimza A solution (about 0.5ml–0.8 ml) to the blood smear drop by drop and let the staining solution cover the whole specimen for 1 min, then add B solution to A solution (the drop amount is about 2–3 times of A solution), blow the staining solution gently to make it mix well and stain for 3–10 min. After the staining is finished, wash with water, dry and wait for microscopic examination when needed.
Statistical analysis
All experiments were repeated at least three times, and values are expressed as mean±standard deviation (mean±SD). Differences between groups were analyzed by one-way ANOVA and Tukey’s post hoc test, and P < 0.05 was considered a significant difference. The data were analyzed by GraphPad 9.0 software.
Results
Flow field simulation analysis
To determine the effect of pathologically high shear rate action time on platelet aggregation and activation, we performed detailed computational fluid dynamics (CFD) simulations. Figure 2a shows the shear rate maps for microchannels with 80% stenosis and stenosis distances of 0.5 mm, 1 mm, 2 mm, 3 mm, and 4 mm, respectively. We found that the shear rate increases with channel stenosis, with a maximum shear rate of approximately 8302 s-1 for the stenotic channel and consistent with the input shear rate (1500 s-1) for the other non-stenotic regions. Furthermore, the transiently elevated pathological high shear rate peaks in the different stenosis models were consistent. To determine the history of shear rate changes experienced by platelets flowing through the microchannel, we analyzed the wall shear rate (WSR) distribution on the midline of the microchannel floor. The results showed that the longer the microchannel stenosis distance, the longer the pathological high shear rate effect (Fig. 2b, 2c). According to the velocity distribution of particles in the flow field (Figure S1), the maximum flow velocity in the narrow region was about 158 mm/s. The maximum shear rate action times were about 3.16 ms, 6.33 ms, 12.7 ms, 10.0 ms and 25.3 ms when the microchannel narrowing distances were 0.5 mm, 1 mm, 2 mm, 3 mm and 4 mm, respectively.
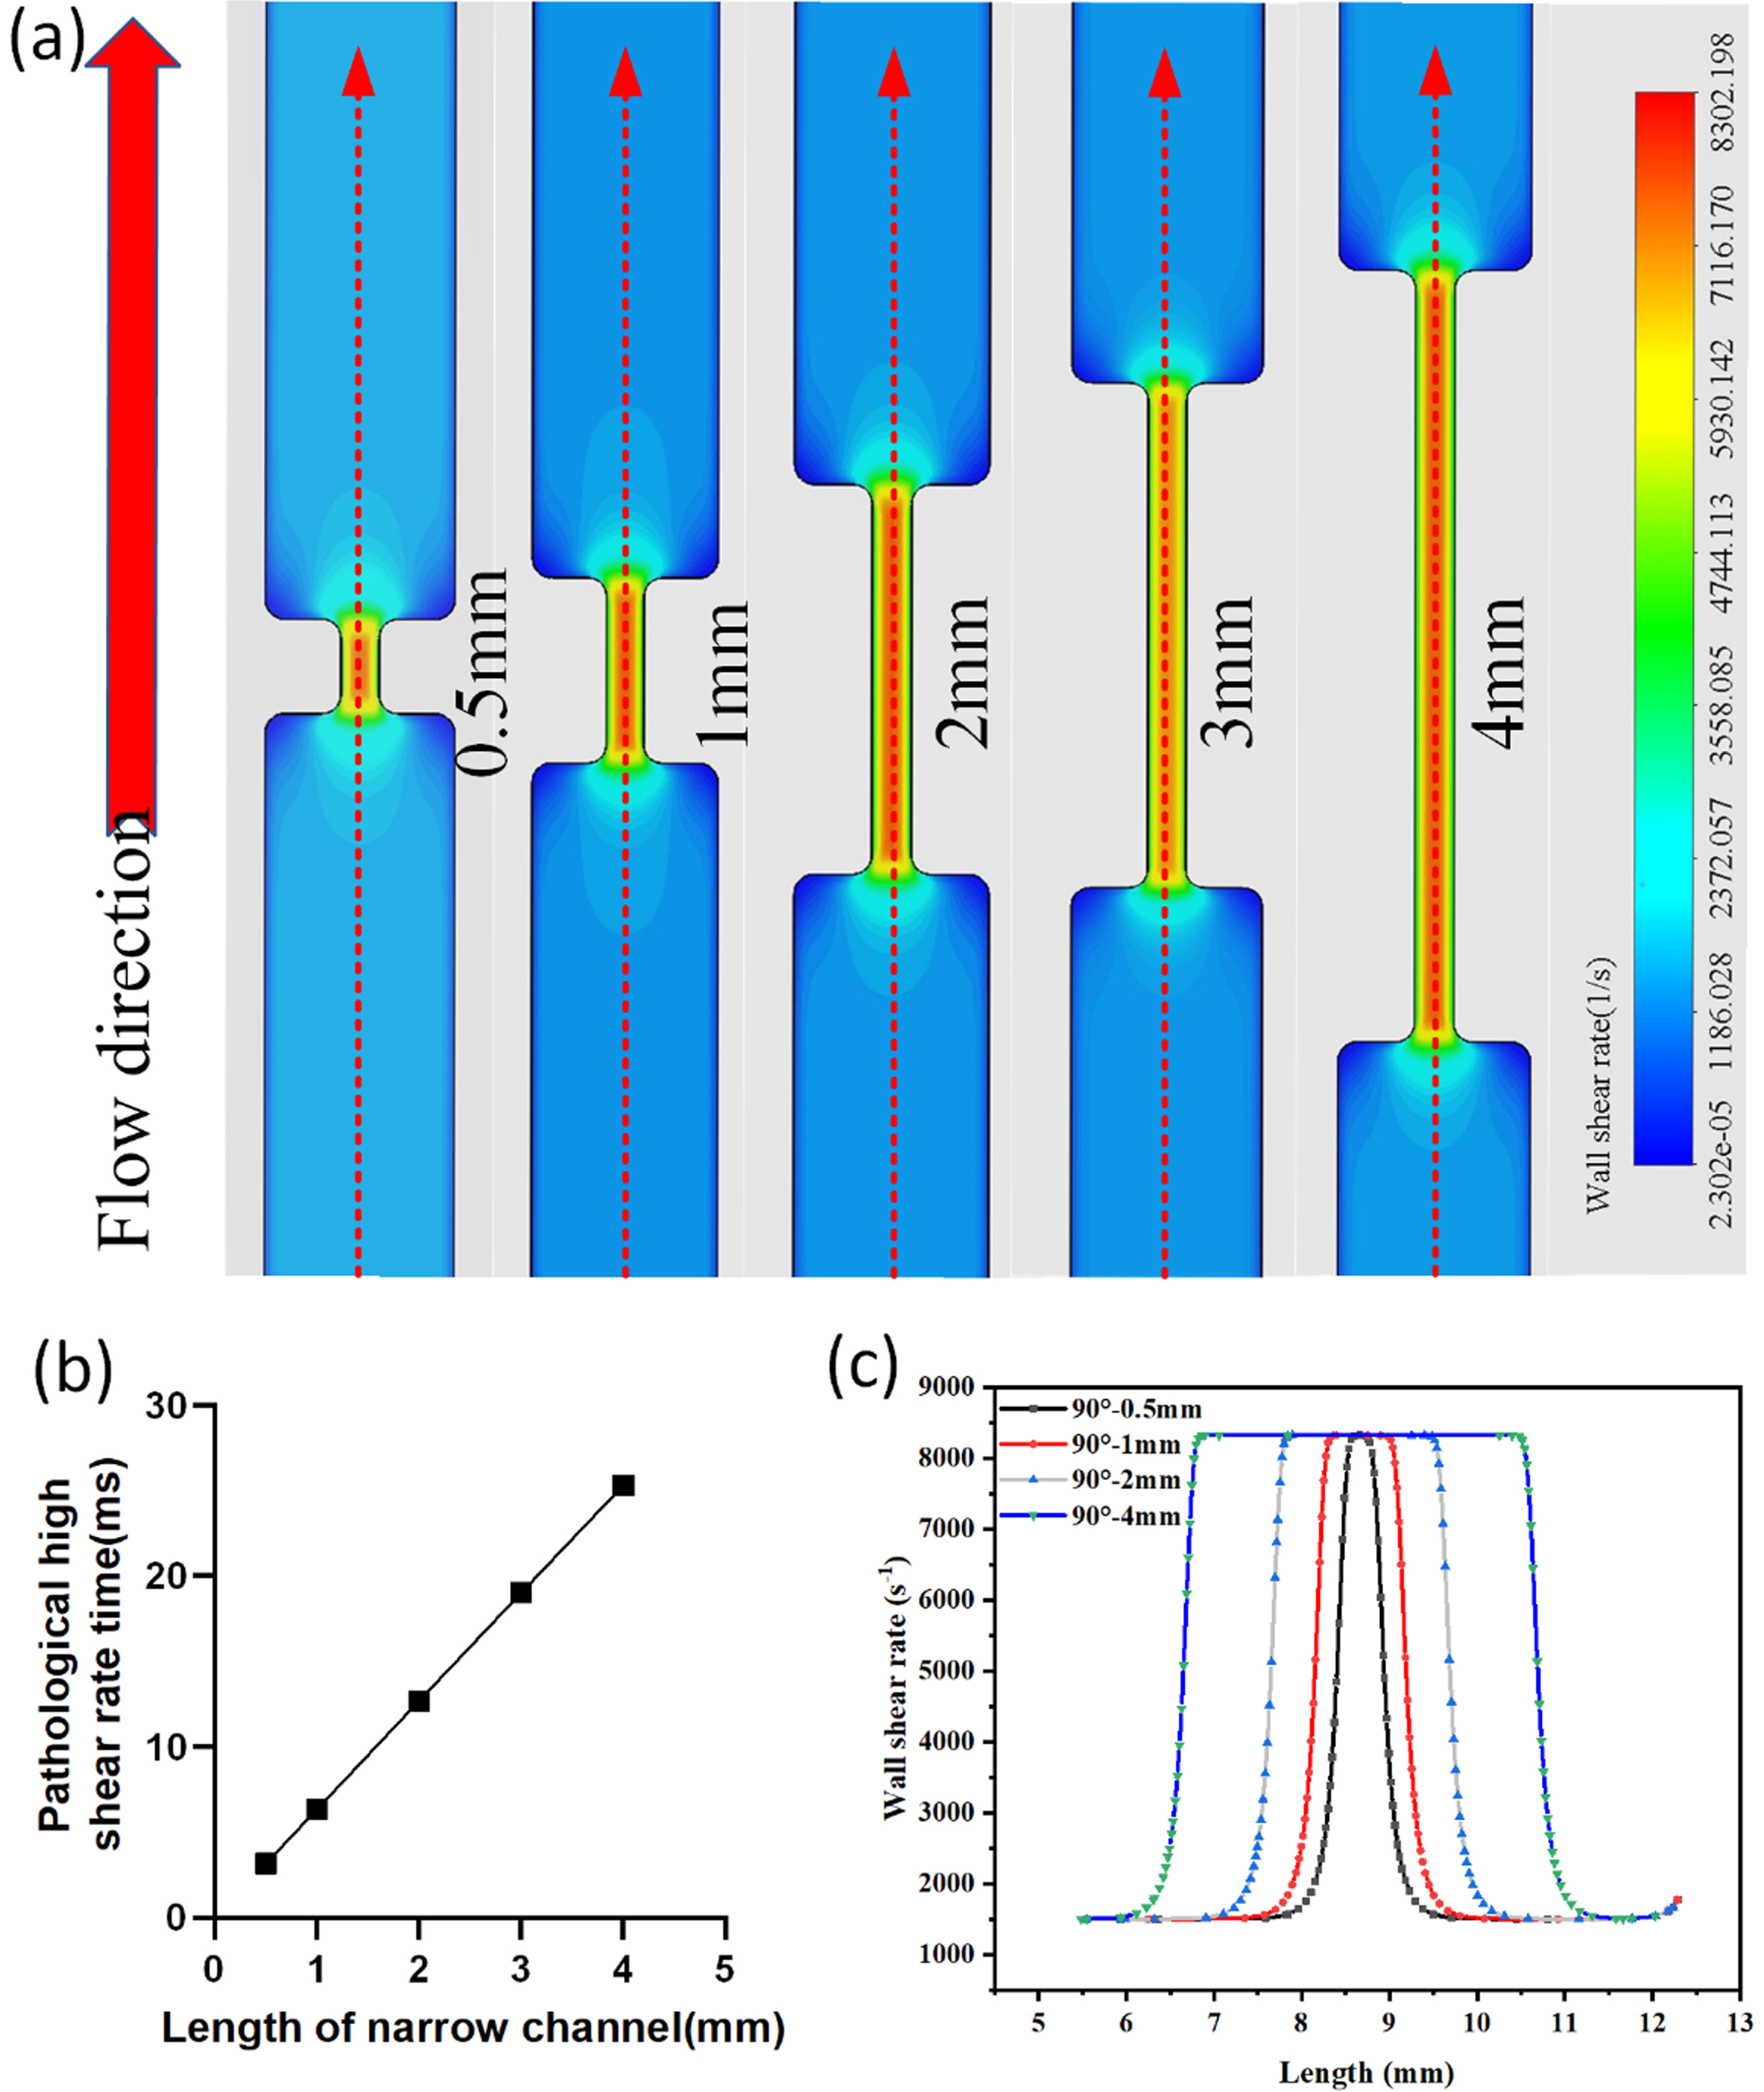
CFD simulation of the microfluidic chip. (a) Shear rate contour plots for microfluidic models with narrow channel lengths of 0.5 mm, 1 mm, 2 mm, 3 mm, and 4 mm, respectively. Variation of the channel width leads to variation of the shear rate, with dark blue indicating the minimum value and dark red indicating the maximum value. (b) Maximum shear rate duration for different stenosis length models, with linear correlation between stenosis length and duration. (c) History of shear rate changes experienced by platelets moving along the midline of the microchannel floor as predicted by CFD simulation (red dashed line). The shear rate increases with stenosis and particles on the flowline undergo rapid shear rate acceleration, persistence, and deceleration phases over a short period of time.
Quantification of activation levels of platelets transiently exposed to high WSR by flow cytometry. Figure 3a and 3b show representative flow cytometry analysis results. When platelets were at rest, platelet surface P-selectin and GP IIb/IIIa were barely expressed, 0.75% and 0.76% respectively (both less than 2%); after ADP stimulation, the expression levels of both were significantly increased (P < 0.05), 52.1% and 50.2% respectively; when exposed to a transiently increased shear rate, the expression levels of platelet surface activation markers were significantly increased, and the longer the exposure time, the more significant the increase in P-selectin and GPIIb/IIIa (Fig. 4c-4d) (P < 0.05)). When the high shear rate exposure time was 3.16 ms, the expression levels of P-selectin and GP IIb/IIIa on the platelet surface were 11.2% and 5.5% respectively; when the exposure time was increased to 25.3 ms, the expression levels of both were 30.8% and 19.1% respectively. These results indicated a shear-dependent enhancement of platelet activation function. The flow cytometry gating strategy for platelet activation function analysis is shown in Figure S2.
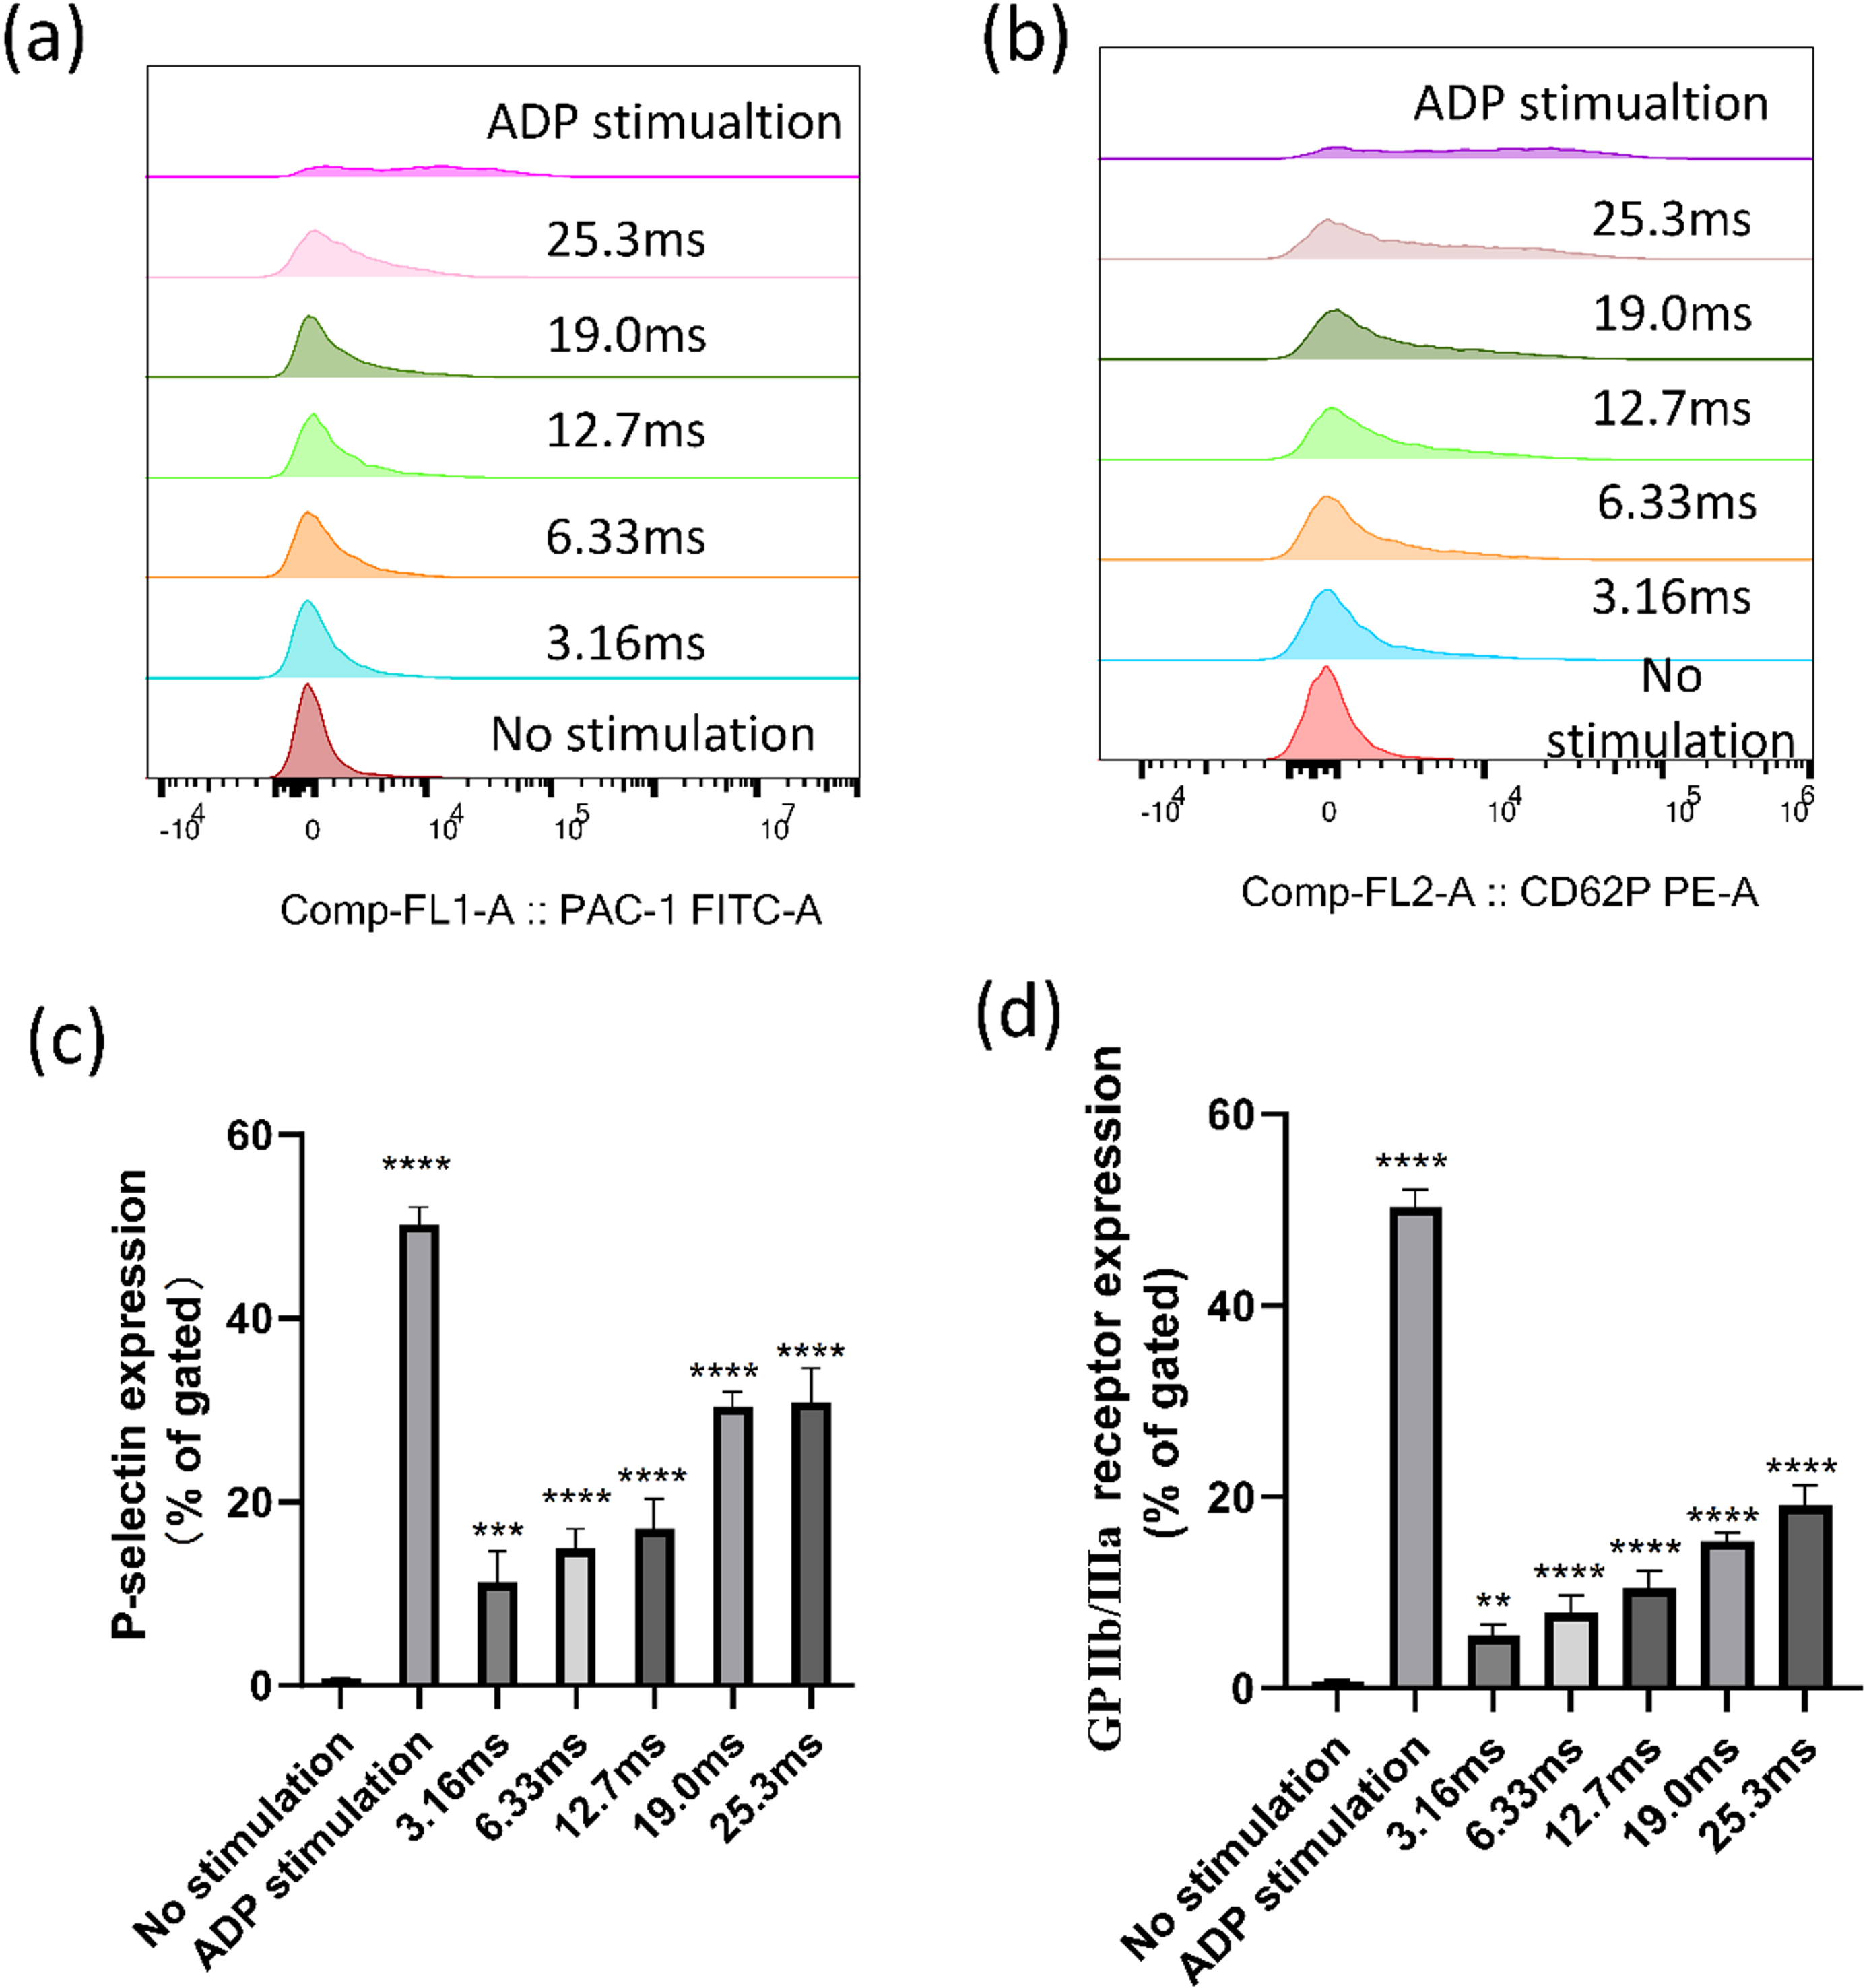
Expression of platelet activation markers (P-selectin and GPIIb/IIIa). (a) Superimposed histogram of platelet P-selectin expression. (b) Superimposed histogram of platelet GPIIb/IIIa expression. (c) Statistics of platelet P-selectin expression levels. (d) Statistics of platelet GP IIb/IIIa expression levels. Results are shown as mean±standard deviation. ***P < 0.0005, ****P < 0.00005.
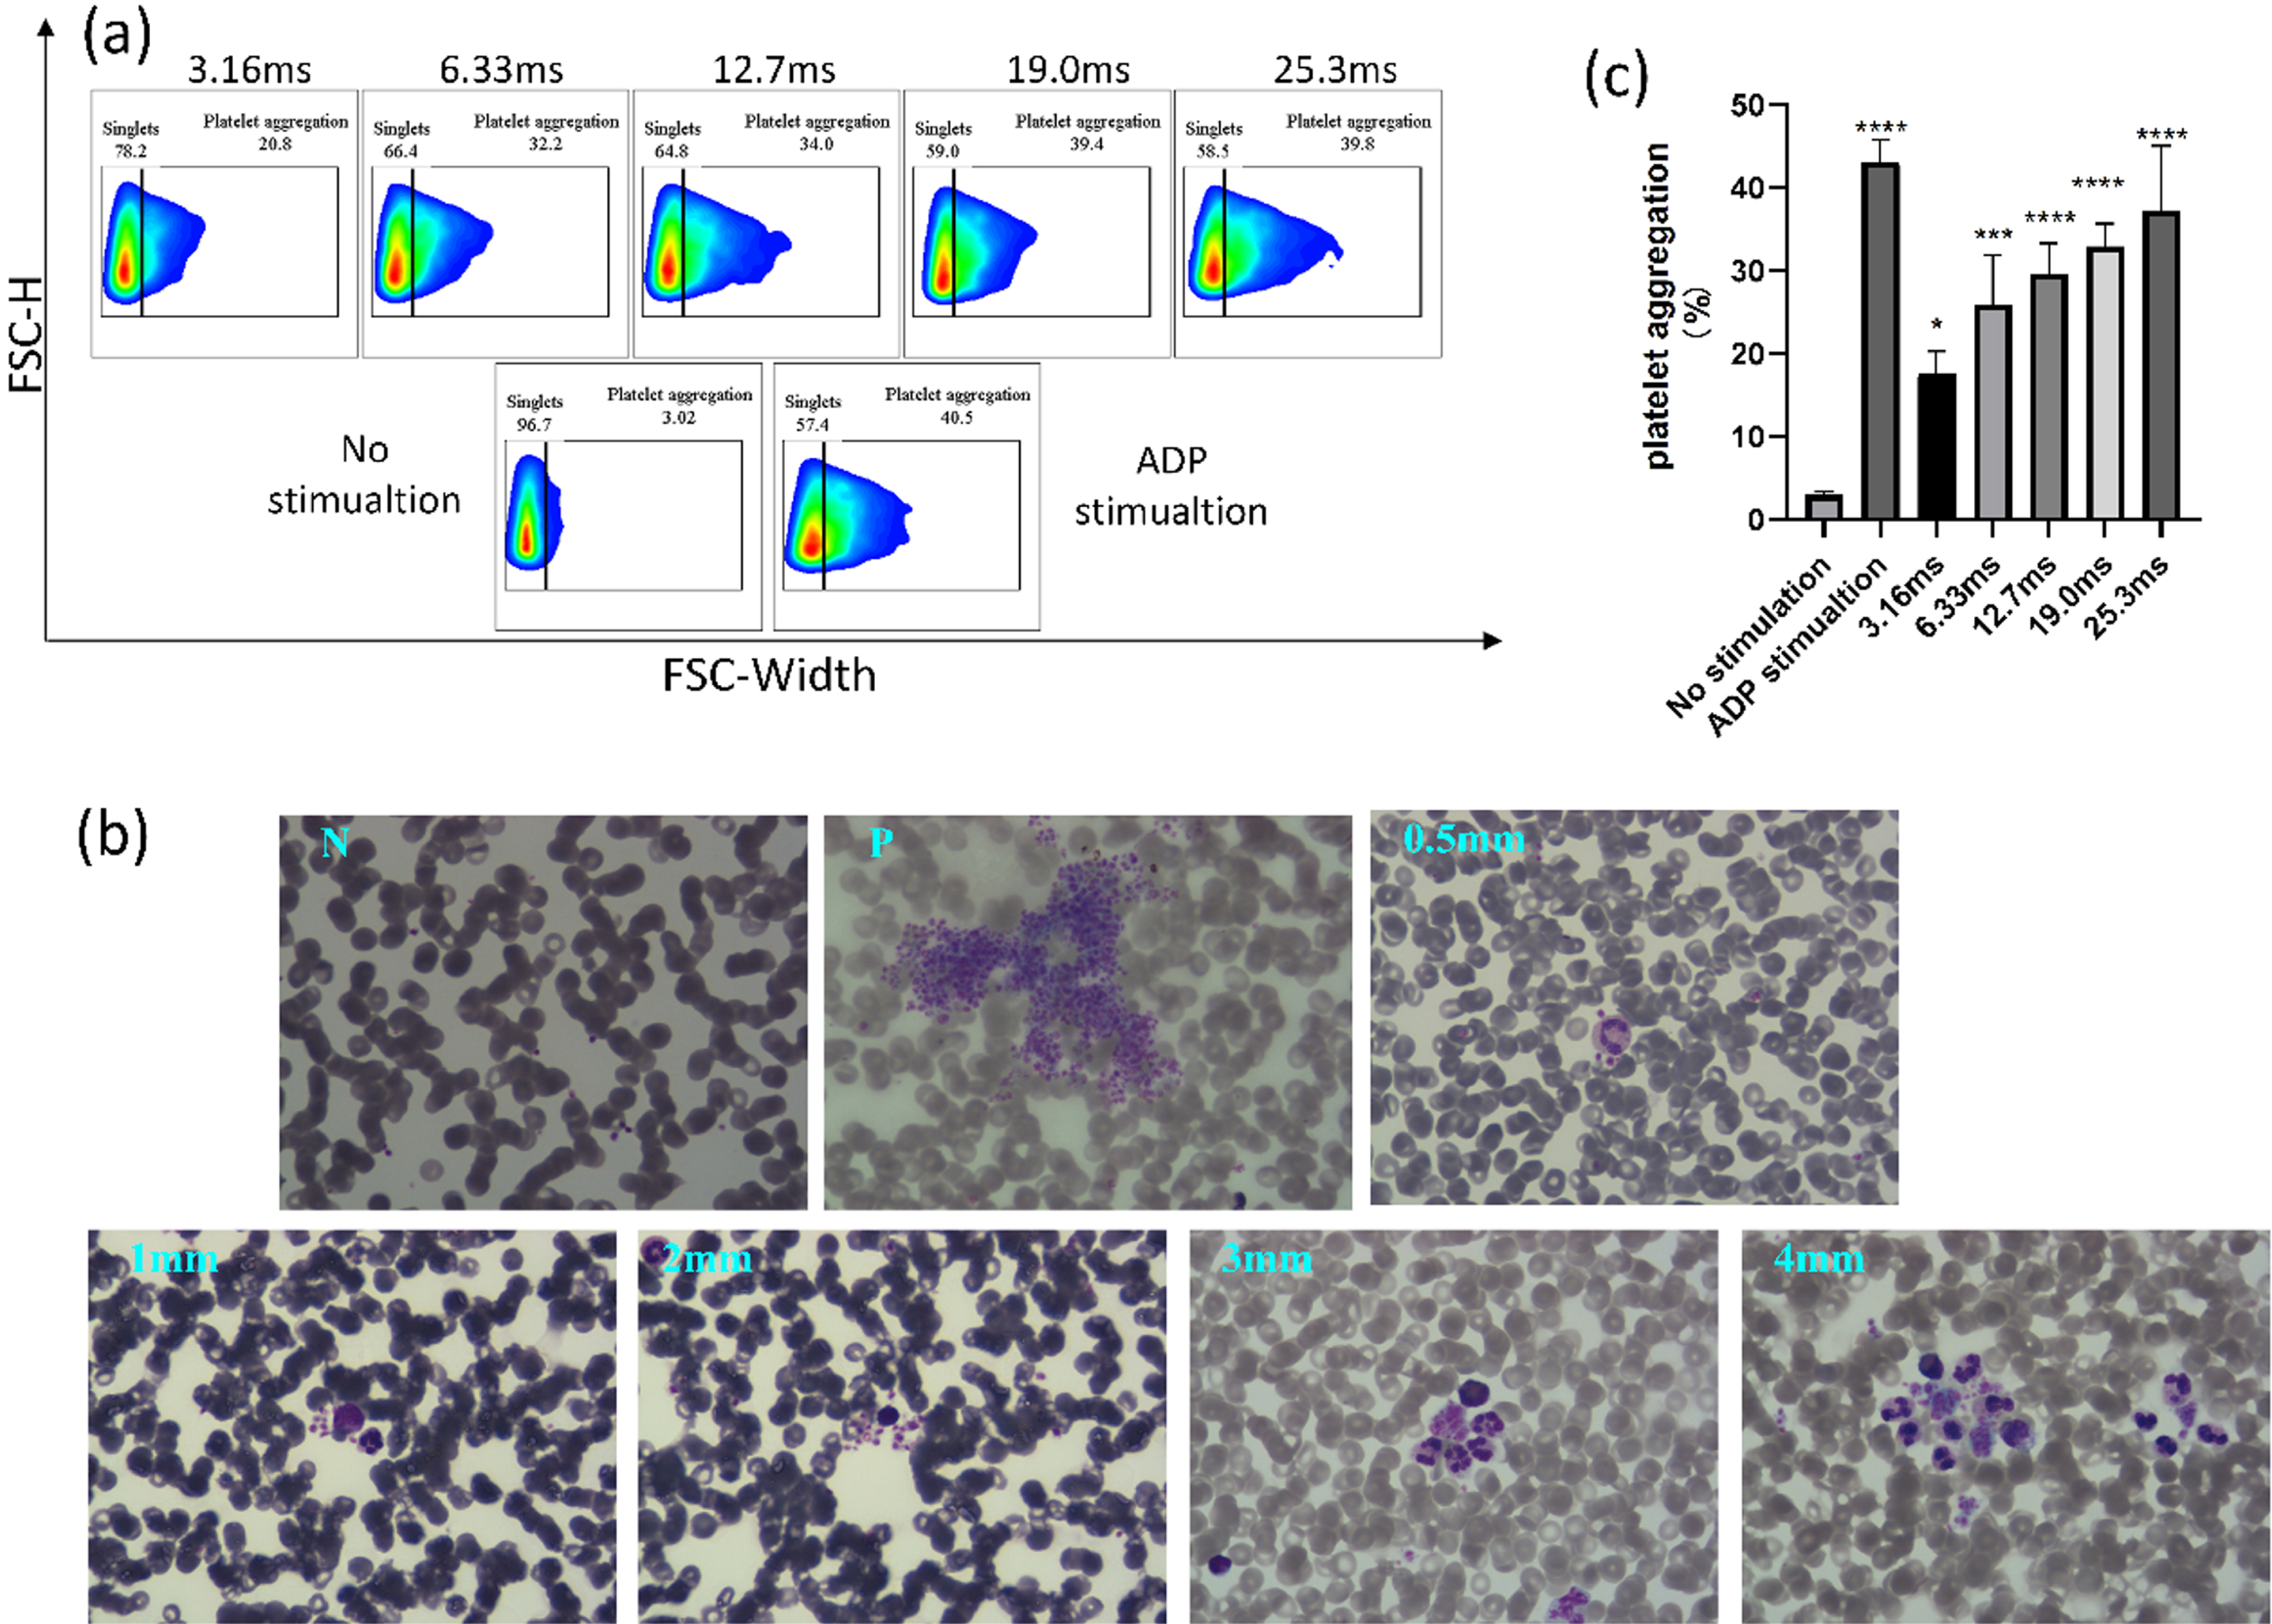
Effect of shear exposure time on platelet aggregation. (a) Flow cytometry analysis of platelet aggregation. (b) Microscopic platelet aggregation pattern (×100). (c) Platelet aggregation statistics. Results are shown as mean±standard deviation. * P < 0.05, *** P < 0.0005, **** P < 0.00005.
To verify the effect of pathologically high shear rate exposure time on platelet activation, we collected whole blood activated by shear induction (microfluidic chip previously blocked by 5% BSA in the same way as the activation part) and analyzed platelet aggregation levels by flow cytometry and blood smear microscopy. The results of flow cytometry analysis showed (Fig. 4a) that the platelet aggregation rate in the resting state was 3.0% with almost no aggregation occurring; after activation by ADP, the platelet aggregation rate was 43.1% with a significantly higher level of platelet aggregation (P < 0.05); platelet aggregation induced by different shear exposure times was different, and when the exposure time was 3.16 ms, the platelet aggregation rate was 20% which was significantly higher than the resting state (P < 0.05), and the platelet aggregation level increased gradually with the increase of exposure time. Microscopic examination showed (Fig. 4b) that there was almost no platelet aggregation microscopically in un-sheared blood smears, and a large amount of platelet aggregation was visible microscopically in samples activated by ADP. Variable numbers of monocyte-platelet aggregates (MPAs) were observed microscopically in samples exposed to pathological high shear, with sporadic numbers of platelets surrounding monocytes visible when the exposure time was 3.16 ms; when the exposure time was increased to 12.7 ms, the number of platelets surrounding monocytes increased significantly; when the exposure time was extended to 19.0 ms, monocytes gradually The results of the study indicated that the ability of monocytes and platelets to aggregate increased with increasing exposure time.
In vitro inhibition studies
In the present study, we investigated the effects of different activation pathways on pathological high shear-induced platelet function by adding the active ingredients of antiplatelet drugs in vitro. Before perfusion of whole blood, we incubated whole blood with the antiplatelet drug for 30 min at 37°C. The experimental control group was the activation level when platelets were exposed to pathological high shear rate for 19.0 ms, and the experimental group was the activation of whole blood after incubation with the drug for 19.0 ms, respectively. The results of flow cytometry studies showed (Fig. 5a-5b) that ASA (the active ingredient of aspirin) had almost no inhibitory effect on the expression of P-selectin and GP IIb/IIIa on the platelet membrane surface (P > 0.05); Ticagrelor was able to effectively inhibit the expression of P-selectin and GP IIb/IIIa (P < 0.05); Tirofiban significantly inhibited the GP IIb/IIIa expression (P < 0.05) and slightly inhibited P-selectin (P < 0.05); GP1BA significantly inhibited the expression of both (P < 0.05) (Fig. 5c-5d).
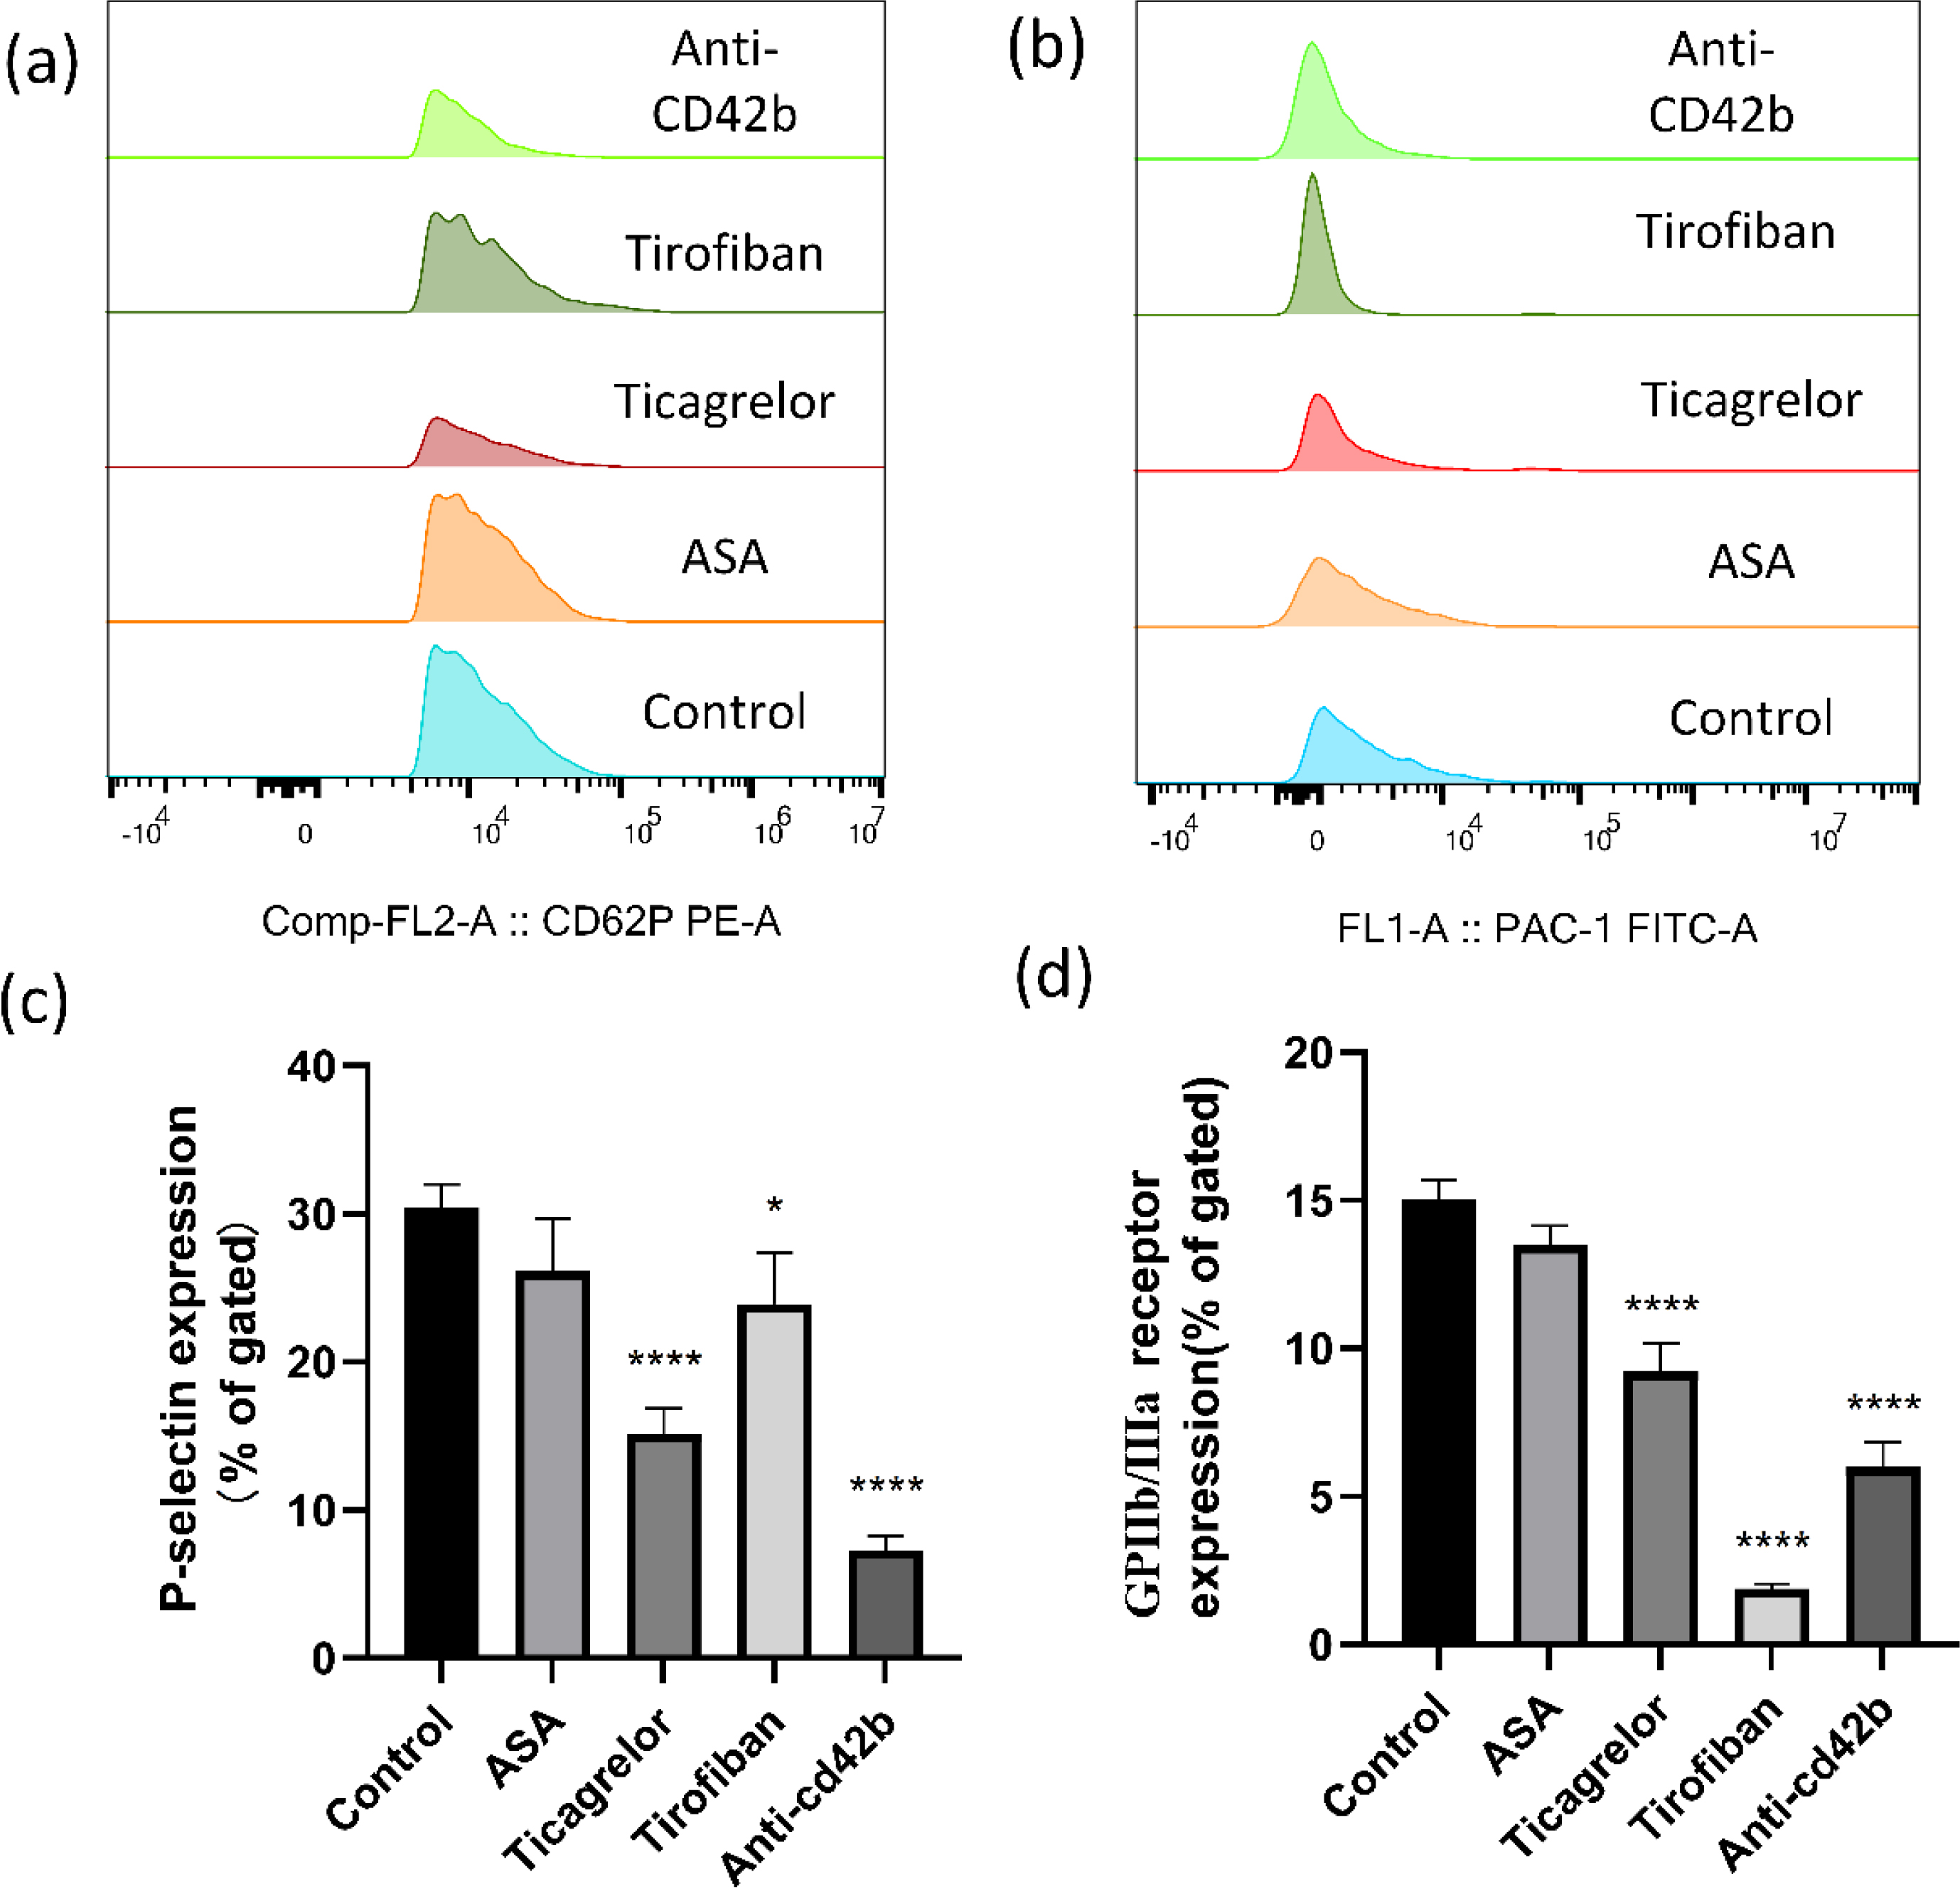
Effect of different inhibitors on platelet activation. (a)-(b):Expression of P-selectin and PAC-1, results are shown as superimposed histograms. (c)-(d) Statistics of P-selectin and PAC-1 expression. Results are shown as mean±standard deviation. * P < 0.05, **** P < 0.0005.
Shear-induced platelet activation and aggregation is a key cause of thrombosis. Many in vitro studies have confirmed that when platelets are subjected to transiently elevated shear forces, a series of biochemical reactions and mechanotransduction processes are induced, including calcium mobilization, granule release, actin contraction, and cytoskeletal rearrangement, ultimately leading to platelet activation [20]. In addition, the shear gradient increases the chance of collision between erythrocytes in the axial flow and platelets in the marginal flow, making them more likely to adhere to the substrate and accelerating thrombus formation [21]. These studies have deepened our understanding of the mechanisms of platelet aggregation and activation under flow conditions; however, the effects of pathologically high shear rate action times on platelet activation and aggregation have not been well addressed. Rahmanetal. (2018) developed a microfluidic device to evaluate the effect of shear rate on the expression of platelet activation markers (P-selectin and GPIb / III a) within the range of shear rate lower than 1000s-1, revealing the key role of transient increased shear rate in downstream platelet activation. However, this study accelerated platelet flow in narrow regions while elevating shear rates, allowing less time to experience the effects of high shear rates. We do not yet know how the sustained effect of pathologic high shear affects platelet function. post-PCI patients often require continued antiplatelet therapy to prevent thrombosis, and studying the effect of antiplatelet agents on shear-induced platelet activation could help guide rational clinical use and, more importantly, contribute to our understanding of the shear-induced platelet activation pathway.
To address these issues, we developed a set of microfluidic chips with different stenosis lengths (all 80% stenosis) to generate pathologically high shear forces of different durations (Fig. 1). With these devices, we constructed a hardware platform for evaluating the effect of shear exposure time on platelet function, which, combined with finite element simulations, allows us to control fluid flow in targeted shear rate intervals. We collected whole blood flowing through the microchannels and analyzed the expression levels of platelet activation markers (P-selectin and GPIIb/IIIa) and the morphology of monocyte-platelet aggregates by means of flow cytometry and staining smears. The results of the study showed that as the length of microchannel stenosis increased, the duration of pathological high shear action increased (Fig. 2), and the expression of P-selectin and GPIIb/IIIa on the platelet surface gradually increased (Fig. 3). Alsmadi et al. (2017) demonstrated in a study that transient exposure (16-73 ms) at high shear rates (80000-100000 s-1) was insufficient to induce platelet activation, particle release, and receptor abscission. In the present study, platelets experienced transient elevations at a peak shear rate of 8302s-1 with exposure times ranging from 3.16–25.3 ms. Despite the similar shear duration of action, our peak shear rate was only 1/10th of the above-mentioned study, and this difference may be an important reason for the inconsistent findings. Numerous studies have demonstrated that the binding of platelet GPIb receptors to vWF is important for shear-induced platelet activation [22, 23]. In a certain range, the binding activity of platelet GP I B and vWF increased with the increase in shear rate. However, when the shear rate is too high, the structure and function of vWF may change, and although the total amount of vWF may remain unchanged, the polymer chain activity of vWF may decrease as the shear rate increases [24], this may be one of the reasons why platelets did not undergo significant activation at high shear rates (>80,000 s-1). In a study by RahmanandHlady (2021), pathological high shear stress (4860s-1 and 11560s-1) caused by stenosis significantly increased platelet activation, and our results support this conclusion to some extent. Shear-induced platelet activation is a complex process, and platelet activation is followed by the transfer of P-selectin from intracellular granules to the outer membrane, conformational changes in GP IIb/IIIa, and increased affinity between fibrinogen and vWF. In addition, activated platelets release P-selectin by cytosolic action, and subsequently, P-selectin binds to P-selectin glycoprotein ligand-1 (PSGL-1), which is constitutively expressed on monocyte membranes, altering the phenotype of monocytes and promoting inflammatory responses. Our smear results showed that there was almost no formation of MPAs in the blood smear without shearing, and after shearing, MPAs started to appear in the smear, and the number and degree of aggregation increased with increasing shearing time (Fig. 4). It has been reported in related studies that platelet-monocyte aggregates may be an ideal indicator for determining cardiovascular disease risk [25], the findings further confirm that the level of platelet activation can increase with increasing time of pathological high shear action.
Aspirin is a clinically used antiplatelet agent that irreversibly inhibits cyclooxygenase-1 activity and reduces the conversion of arachidonic acid (AA) to thromboxane A2 (TXA2) [26]. Our results show that ASA has little inhibitory effect on shear-induced platelet activation, indicating that the TXA2 activation pathway is not a major pathway for shear-induced platelet activation. Studies have shown that the combined use of TXA2 synthase inhibitors and TXA2 receptor antagonists can better reduce platelet reactivity [27]. Ticagrelor can inhibit ADP- P2Y12 receptor pathway-mediated platelet activation and aggregation by reversibly binding to the P2Y12 receptor. Cattaneo et al. (1994) found that ADP can promote SIPA, and our results verify this conclusion from the opposite side. After Ticagrelor inhibition, platelet P-selectin and GPIIb/IIIa expression levels were significantly reduced, suggesting that the ADP- P2Y12 receptor pathway is partially involved in shear-induced platelet activation. Tirofiban can inhibit platelet aggregation by competitively binding to fibrinogen receptors. In the present study, Tirofiban significantly inhibited the expression of GPIIb/IIIa, suggesting that the binding of platelet GPIIb/IIIa to fibrinogen is not only the ultimate pathway for platelet aggregation, but also has a non-negligible effect on shear-induced platelet activation. GP1BA is a specific antibody to platelet glycoprotein GPIb, which can competitively inhibit GPIb and vWF binding. We found that GP1BA significantly inhibited the expression of platelet P-selectin and GPIIb/IIIa, and the findings indicate that the binding of GPIb-IX-V complex to vWF plays a key role in shear-induced platelet activation. Shear-induced platelet activation is an extremely complex process involving numerous molecular mechanisms, which, according to the published literature, may include processes such as mechanical force-induced exposure of the vWF A1 structural domain and binding to the platelet membrane receptor GPIbα, GPIbα transduction stress and activation of the integrin protein GPIIb/IIIa, and mechanical activation of the ion channel protein Pieoz1. Based on the results of our in vitro inhibition experiments, we speculate that pathological high shear-induced platelet activation may undergo the following process: when platelets are subjected to transient elevated shear (8302s-1), the vWF conformation changes, unfolding from a tight spherical shape to a long chain-like structure, exposing the A1 structural domain and binding to the platelet membrane GPIbα receptor, and subsequently initiating subsequent intracellular signaling subsequent initiation of subsequent intracellular signaling events, such as GPIIb/IIIa activation, ADP and TXA2 release. These cellular signaling events further promote platelet activation, allowing GPIIb/IIIa to bind and intertwine with fibrinogen and ADP to in turn promote irreversible platelet aggregation.
Our study also has some obvious shortcomings; our microchannel design has a total length of 7 mm, while the longest stenotic region is up to 4 mm. In this case scenario, although the microfluidic model provides sufficient shear exposure time (25.3 ms), the non-stenotic region is thus shortened, which may have some impact on the shear effect.
Conclusion
In the present study, we developed a microfluidic chip that can be used to mimic arterial stenosis to study the effect of the duration of pathological high shear on platelet activation and aggregation function. The results showed that sustained pathological high shear significantly increased platelet aggregation and activation levels. Our in vitro inhibition study revealed that shear-induced platelet activation was mainly mediated by the binding of the GPIb-IX-V complex to vWF, and the ADP-P2Y12 receptor pathway and GPIIb/IIIa-fibrinogen binding also played a key role in the whole activation process. However, there are some shortcomings in the present study, and we hope to further investigate the effect of transiently elevated pathological high shear rate on GPIb-IX-V complex and vWF molecules structurally and functionally in the future in terms of molecular mechanisms.
Footnotes
Acknowledgments
This work was supported by the National Natural Sciences Foundation of China (11702047), Special Project of Science and Technology Innovation for People’s Livelihood Security of Chongqing (cstc2017shmsA130009), the Chongqing medical scientific research project (Joint project of Chongqing Health Commission and Science and Technology Bureau (2023GDRC008), and the Post-doctoral Research Project of Chongqing (Xm2017082).
Author contributions
Tiancong ZHANG, Xuemei GAO, Xiaojing HUANG, Ling Liu, and Xuanrong HUAN performed the experimental research and data analysis. Tiancong ZHANG and Yuan LI wrote and edited the manuscript. Dan CHEN and Cui HE contributed to the study design, data analysis, and writing and editing of the manuscript. All authors have read and approved the final manuscript and, therefore, have full access to all the data in the study and take responsibility for the integrity and security of thedata.
Conflicts of interest
Tiancong ZHANG, Ling Liu, Dan CHEN, Xuanrong HUAN, Cui HE, Xuemei GAO, Xiaojing HUANG and Yuan LI declare that they have no conflict of interest.

The supplemental material contains a graphical abstract and some additional data. The graphical abstract shows a model of stenotic vessels due to atheromatous plaque formation, where platelets in the circulating blood are subjected to transient elevated shear forces in the stenotic region. Figure S1 illustrates the velocity distribution of the fluid under different stenosis models, with changes in the width of the channel leading to changes in the rate, with dark blue indicating the minimum and dark red indicating the maximum. Figure S2 illustrates the gating strategy for analyzing platelet activation function by flow cytometry, using un-sheared whole blood as a biological negative control, with steps detailed in the Supplementary Material.
Data availability
The data used to support the findings of this study are included in the article. Should further data or information be required, these are available from the corresponding author upon request.