
Abstract
Background:
Metabolic syndrome (MetS) has been associated with increased risk for Alzheimer’s disease and related dementias (ADRD). Understanding the association of MetS risk factors to processing speed and executive function in the pre-clinical stages of ADRD in under-represented groups would offer insight on potential mechanisms through which MetS associates with ADRD risk.
Objective:
Examine association of MetS features and processing speed and executive function across three racial groups.
Methods:
Cognitively unimpaired adults from the Wisconsin Alzheimer’s Disease Research Center and the Wisconsin Registry for Alzheimer’s Disease Prevention completed blood-draws and neuropsychological testing. Six cognitive outcomes were assessed in association to MetS risk factors: Trailmaking Tests A and B, Animal Fluency, Digit Symbol, and composite scores for Processing Speed and Executive Function. Linear mixed effect models were used to assess the relationship between MetS risk factor count and longitudinal cognitive performance across three racialized groups.
Results:
Participant sample sizes varied by outcome analyzed (N = 714–1,088). African American and Native American groups exhibited higher rates of MetS than non-Hispanic Whites. MetS was associated with processing speed and executive function across all racialized groups. Three-way interaction by racialized group was limited to one cognitive outcome: Trailmaking Test A.
Conclusion:
Metabolic dysfunction incrementally affects cognitive trajectory, with generally similar associations across racial groups. Since racialized groups exhibit higher levels of both MetS and ADRD, MetS may represent a driving factor for increased ADRD risk experience by racialized group and an important and modifiable target through which to reduce risk of ADRD.
Keywords
INTRODUCTION
Metabolic syndrome (MetS) in mid-life represents a known risk factor for Alzheimer’s disease and related dementias (ADRD) [1, 2] as well as a potentially modifiable target for intervention [3]. Representing a cluster of several inter-related vascular risk factors, including insulin resistance, visceral adiposity, atherogenic dyslipidemia and hypertension [4, 5], MetS is associated with risk of ADRD in addition to risks conferred individually by its subsumed vascular risk factors [6]. Evidence suggests that ameliorating these factors in mid-life before ADRD symptoms emerge, and potentially before significant neurodegeneration occurs may be associated with reduced cognitive impairment in late life [7]. While this avenue appears promising, our current understanding of the relationship between metabolic risk factor burden and ADRD is largely based on data derived from non-Hispanic White cohorts [8–11]. Given demonstrated racial disparities in both metabolic risk factors [8–11] and ADRD prevalence [8, 12–14] with higher rates of both MetS and ADRD among Black and African American (B/AA) and American Indian, Native American (AI/NA) participants, there is an urgent need to examine the interplay of these syndromes in racially diverse cohorts.
Race is a social rather than biological or genetic construct. We note that the term racialization or societally defined group status is a more accurate description of the process by which individuals are designated as belonging to a specific group [15]. Importantly, racialized group status is associated with factors downstream to health outcomes, i.e., advantage for White race and marginalization for Indigenous and Black groups.
While cognitive ability does not uniformly worsen with MetS nor with ADRD, two cognitive domains well recognized to decline with both disorders include processing speed and executive functioning [16, 17]. Psychomotor processing speed, or the amount of time taken to complete a set of cognitive operations [18], is affected by cerebrovascular disease, particularly among individuals with greater metabolic burden [19–21]. Slowed processing speed is associated with white matter hyperintensities in the brain [21], which reflect underlying cerebral small vessel ischemic disease [22]. Further, processing speed is one of the strongest predictors of overall cognitive performance on cognitive assessment batteries [23]. Similarly, executive function, comprising a set of cognitive abilities underlying cognitive control and regulation [24] is considered an early cognitive marker of brain changes related to both vascular disease [25] and ADRD [26]. Indeed, executive function has been suggested to mediate declines in memory associated with increasing age, and declines in executive function specifically may function both as a risk factor for AD dementia and as a marker of preclinical disease [27]. Recent evidence of associations between vascular disease, biomarkers for AD, and global cognitive outcomes across racialized groups [28] highlights the importance of clarifying relationships between vascular risk factors and those cognitive domains directly affected by these conditions, i.e., processing speed and executive function. This is particularly vital considering significant racial disparities in prevalence of both MetS and ADRD.
To address this gap, we analyzed data from two on-going cohort studies: the Wisconsin Alzheimer’s Disease Clinical Core (ADRC) and the Wisconsin Registry for Alzheimer’s Prevention (WRAP). Included are individuals with intact cognition from three self-denoted non-Hispanic racialized groups: Black/African American (B/AA), Native American (NA), and White adults. We evaluated the relationships between elevations in metabolic risk factor burden and performance on measures of processing speed and executive function over time in mid-life, an optimal time to address preclinical disease. We hypothesized that the underlying links between MetS and ADRD risk would be similar regardless of race. More precisely, we hypothesized that a higher number of metabolic risk factors would be associated with cognitive trajectory across racialized groups, such that increased metabolic dysfunction would be similarly associated with poorer cognitive performance in all three racialized groups.
MATERIALS AND METHODS
Study design and subjects
In this ex post facto designed study, we analyzed data collected in two parent studies, both of which are longitudinal observational cohort studies: the Wisconsin Registry for Alzheimer’s Prevention (WRAP) [19] and the Wisconsin Alzheimer’s Disease Research Center (ADRC) [29]. Over 1,600 participants in the WRAP study were enrolled based on family history of dementia and have been followed since 2001. The Wisconsin ADRC cohort study began in 2009 and involves comprehensive examination and collection of cognitive data from over 1,000 participants who span the AD continuum. Both ongoing parent studies employ longitudinal data collection with visits occurring annually in the Wisconsin ADRC and biennially in the WRAP study. Information obtained at each visit includes vital signs, physical exam, fasting laboratory blood work, neuropsychological testing, medical interview, and questionnaires with the option of neuroimaging and cerebrospinal fluid biomarker studies for identifying AD pathology [19, 20].
Participants were included in the current analyses if age > 40 at baseline and cognitively intact at study entry. All participants were fluent English speakers, had visual and auditory acuity sufficient for neuropsychological testing, and had no competing neurological diagnoses.
Inclusion in the current study was additionally limited to individuals who self-identified ethnically as non-Hispanic, and who self-identified racially as one of three racialized groups: White, Black, or NA. All study participants had completed at least two visits at which all necessary covariate information was obtained.
Independent variable: metabolic syndrome risk
Per the 2005 revised criteria by the National Cholesterol Education Program (NCEP) Adult Treatment Panel III (ATP III) [5], MetS is defined as having three or more of the following risk factors: elevated waist circumference (e.g., waist circumference≥40 inches in males or≥35 inches in females), hyperglycemia (e.g., fasting glucose≥100 mg/dL), hypertriglyceridemia (e.g., triglyceride level≥150 mg/dL), low HDL (e.g., high density lipoprotein level < 40 mg/dL in males or < 50 mg/dL in females), or hypertension (e.g., blood pressure≥130/85 mm/Hg). MetS count was analyzed as a time varying covariate. Self-reported sex, time varying age, and baseline education years were also included as covariates. In the current study, medication use information was not available for use in the NCEP ATP III criteria. For this reason, our resultant variable, MetS count, is based on participants’ objective data, i.e., the number of NCEP ATP III MetS criteria noted by vital signs and bloodwork collected at the study visit, regardless of whether the participant was receiving treatment.
Cognitive measurements of processing speed and executive function
To measure processing speed and executive function, we utilized four individual test scores and two summary scores. Individual test scores included: Trail Making Test A [30, 31], a test of processing speed, speeded attention, and sequencing; Trail Making Test B [31], a measure of executive function, speeded sequencing, and mental flexibility; Animal Fluency [32], a test of executive function and language requiring speeded generation of words in a semantic category; and Digit Symbol [33], a task of processing speed and speeded coding. Due to the right skewed distribution, scores for Trail Making Tests A and B were natural log transformed before model fitting. The two summary scores included a Processing Speed composite score, comprised of Digit Symbol and Trail Making Test A (i.e., the sum of the reverse coded log Trails A score and the standardized Digit Symbol score), and an Executive Function composite score, comprised of Animal Fluency and Trail Making Test B (i.e., the sum of the reverse coded log Trails B score and the standardized Animal Fluency score). Standardized Z scores for composite scores were created for each test at each visit using the mean and standard deviations of the baseline visit scores. Baseline cognitive performance was defined as the earliest cognitive outcome data point for a given participant used in any modeling.
Statistical analysis
Linear mixed effects models were used to identify differences in vascular risk factors and cognitive test performance between racialized groups. Linear mixed effects models using restricted maximum likelihood fits were used to assess whether MetS count similarly predicted change in cognitive performance across racialized groups for each of the six cognitive outcomes. All models included main effects of self-identified sex, years of education, the three-way interaction between age, MetS count and racialized group (dummy coded), and all corresponding nested main effects and two-way interactions between age, MetS count, and racial group. Longitudinal age represented the effect of time in all models and associated graphs. Random effect structure consisted of subject specific intercepts. Subject-specific slopes were not used due to convergence and identifiability issues when included [34]. Confidence intervals for each three-way interaction were constructed by the percentile method of the parametric bootstrap with over 2,000 replications.
A secondary analysis assessed the relative contribution of the 5 MetS count health conditions, employing a Bayesian Information Criterion (BIC) reduction procedure. The BIC is a goodness-of-fit metric where a lower BIC number corresponds to better fit. For each cognitive outcome, the starting model was the same as that used in our primary analysis but focused on individual metabolic conditions rather than MetS count. Specifically, instead of MetS count, each of the 5 health condition indicators were entered in models and included a three-way interaction with age and racialized group, in addition to estimates of nested interactions and main effects. From this starting model, health conditions and their interactions (condition main effect, interaction with age, interaction with race, and three-way interaction with age and race) were removed from the model and resulting BIC change recorded. Reductions in BIC were ranked, and the condition resulting in the greatest reduction in BIC was subsequently removed. The iterative process continued until either all health conditions were removed, or the removal of any remaining condition did not reduce BIC.
Statistical significance was assessed at the 0.05 alpha level. Model diagnostics were run to ensure no regression assumption violations occurred. For each outcome, a test of dropping all three-way interactions was conducted using the Likelihood Ratio Tests (LRT) after models refitted using the maximum likelihood. To address type 1 error due to multiple comparisons, we employed Benjamini-Hochberg correction controlling False Discovery Rate at 5% across the LRT results. All analyses were performed in R version 4.2.0 [35] using the lme4 package [36].
RESULTS
Table 1 provides study participants’ demographic information. Data from a total of 1,258 participants were analyzed, of whom 1,141 were White, 98 were AA, and 19 were NA. All identified as non-Hispanic. Mean age of all participants was 63.43 years (SD 7.31) and 67.2% identified as female. Significant differences were observed between the three racialized groups in waist circumference, fasting glucose levels, protective cholesterol levels (HDL), and metabolic risk factor count (Mets). Specifically, 80% of AA participants, 90% of NA participants, and 49% of White participants had waist circumferences above the NTEP criteria waist circumference cut points of 40 inches for males and 35 inches for females (p < 0.001). Similarly, significant differences between groups were seen in fasting glucose levels with 45.9% of AA, 63.2% of NA, and 27.5% of White participants displaying fasting glucose levels above specified cut point of ≥100 mg/dL (p < 0.001). HDL levels were also significantly different between groups with 25.5% of AA, 47.4 NA, and 16% White participants exhibiting levels above established cut points (p < 0.001). Further, as depicted in Fig. 1, metabolic risk burden was significantly different between racialized groups, with mean MetS count of 2.22 for AA, 2.79 for NA, and 1.5 for Whites. Post-hoc analyses confirmed significant differences in MetS count between AA and White participants (p < 0.001) and between NA and White participants (p < 0.001).
Demographics of participants
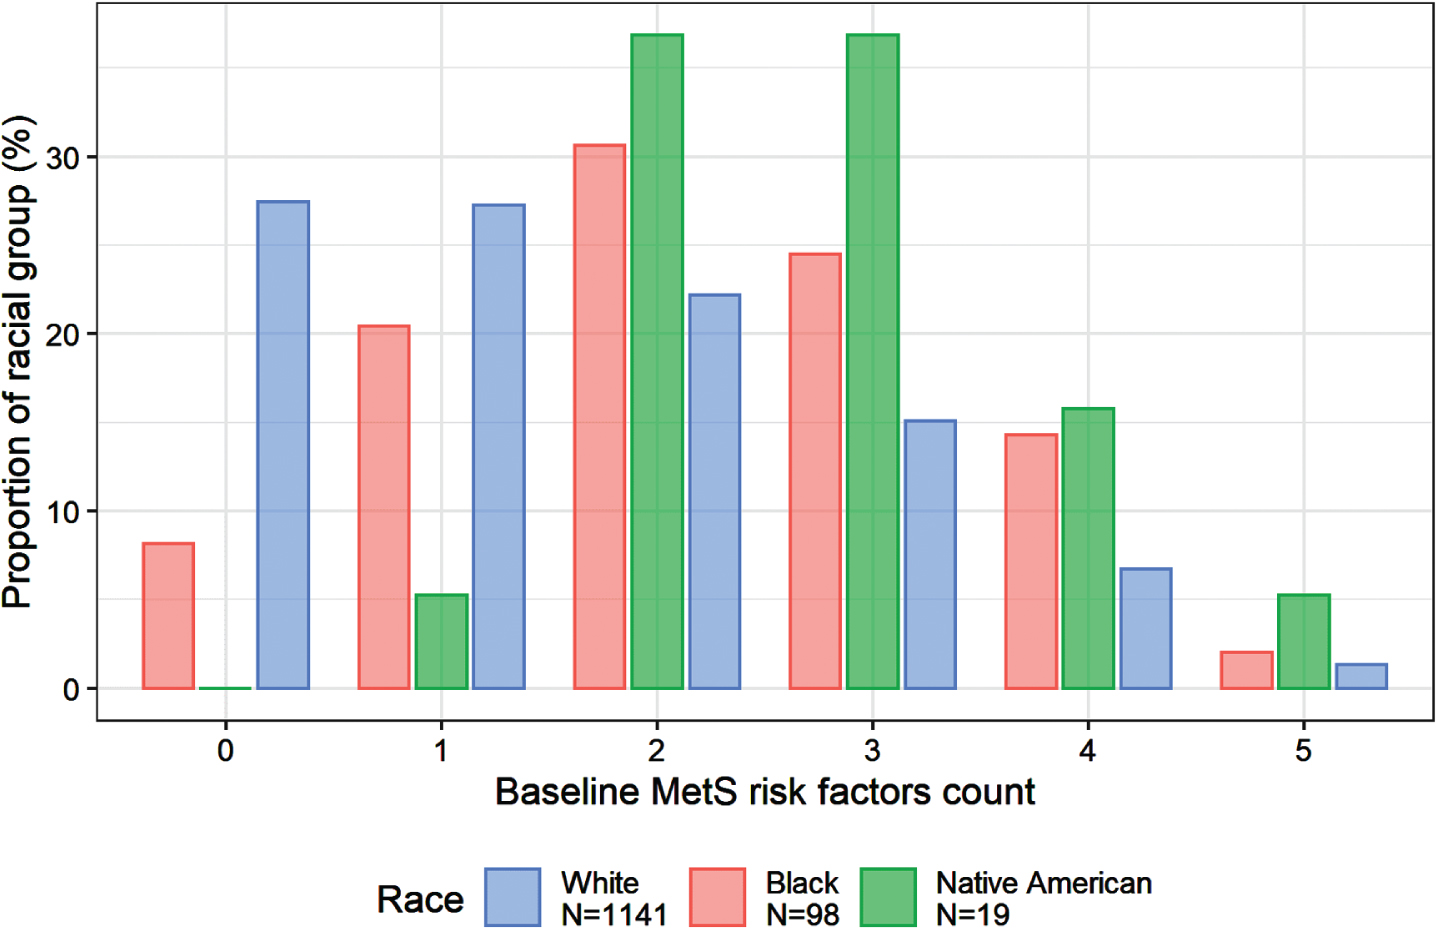
Bar chart of metabolic syndrome risk factors by race.
Cognitive test scores are also presented in Table 1. Significant differences emerged between racialized groups on all cognitive tasks, with patterns of performance conforming to previous reports of racial differences on cognitive measures [19, 37]. Higher education was associated with better cognitive performance level in regression models.
Across all groups, MetS risk factors incrementally associated with cognitive trajectory, such that a higher number of metabolic risk factors was associated with slower processing speed. Increasing MetS count was significantly associated with cognitive trajectory for Trails A and Trails B, as well as for both composite scores. Given that associations were not significant for metabolic risk factors and Animal Fluency or Digit Symbol, associations between MetS count and both composite scores were possibly driven by those between MetS count and Trails A and B.
Total sample sizes varied depending on the outcome analyzed and ranged from 714 to 1,088 subjects. Sample sizes for each outcome are provided in Supplementary Table 1. Results of linear mixed effects regression analyses examining associations of three-way interactions between age, race, and metabolic risk factors for six cognitive outcomes are displayed in Table 2. Findings associated with most of the cognitive outcomes demonstrated a similar pattern. Interaction analyses suggested no race by age by metabolic count effect; that is, after adjusting for sex and education, the three-way interaction was not significant for any outcome with one exception.
Estimates from linear mixed effects models
Trails A represented the one outcome for which a significant interaction by race emerged. White participants demonstrated the pattern described above of slower processing speed with increasing metabolic dysfunction. By contrast, for AA and NA groups, there was an unexpected association in the opposite direction, such that lower metabolic count was associated with slower processing speed. This effect was small for AA but larger for NA. Figure 2 provides a graphic depiction of the three-way interaction for Trail Making Test A assessing the impact of metabolic risk factors on a speeded task of attention for non-Hispanic Whites, Blacks and NA.
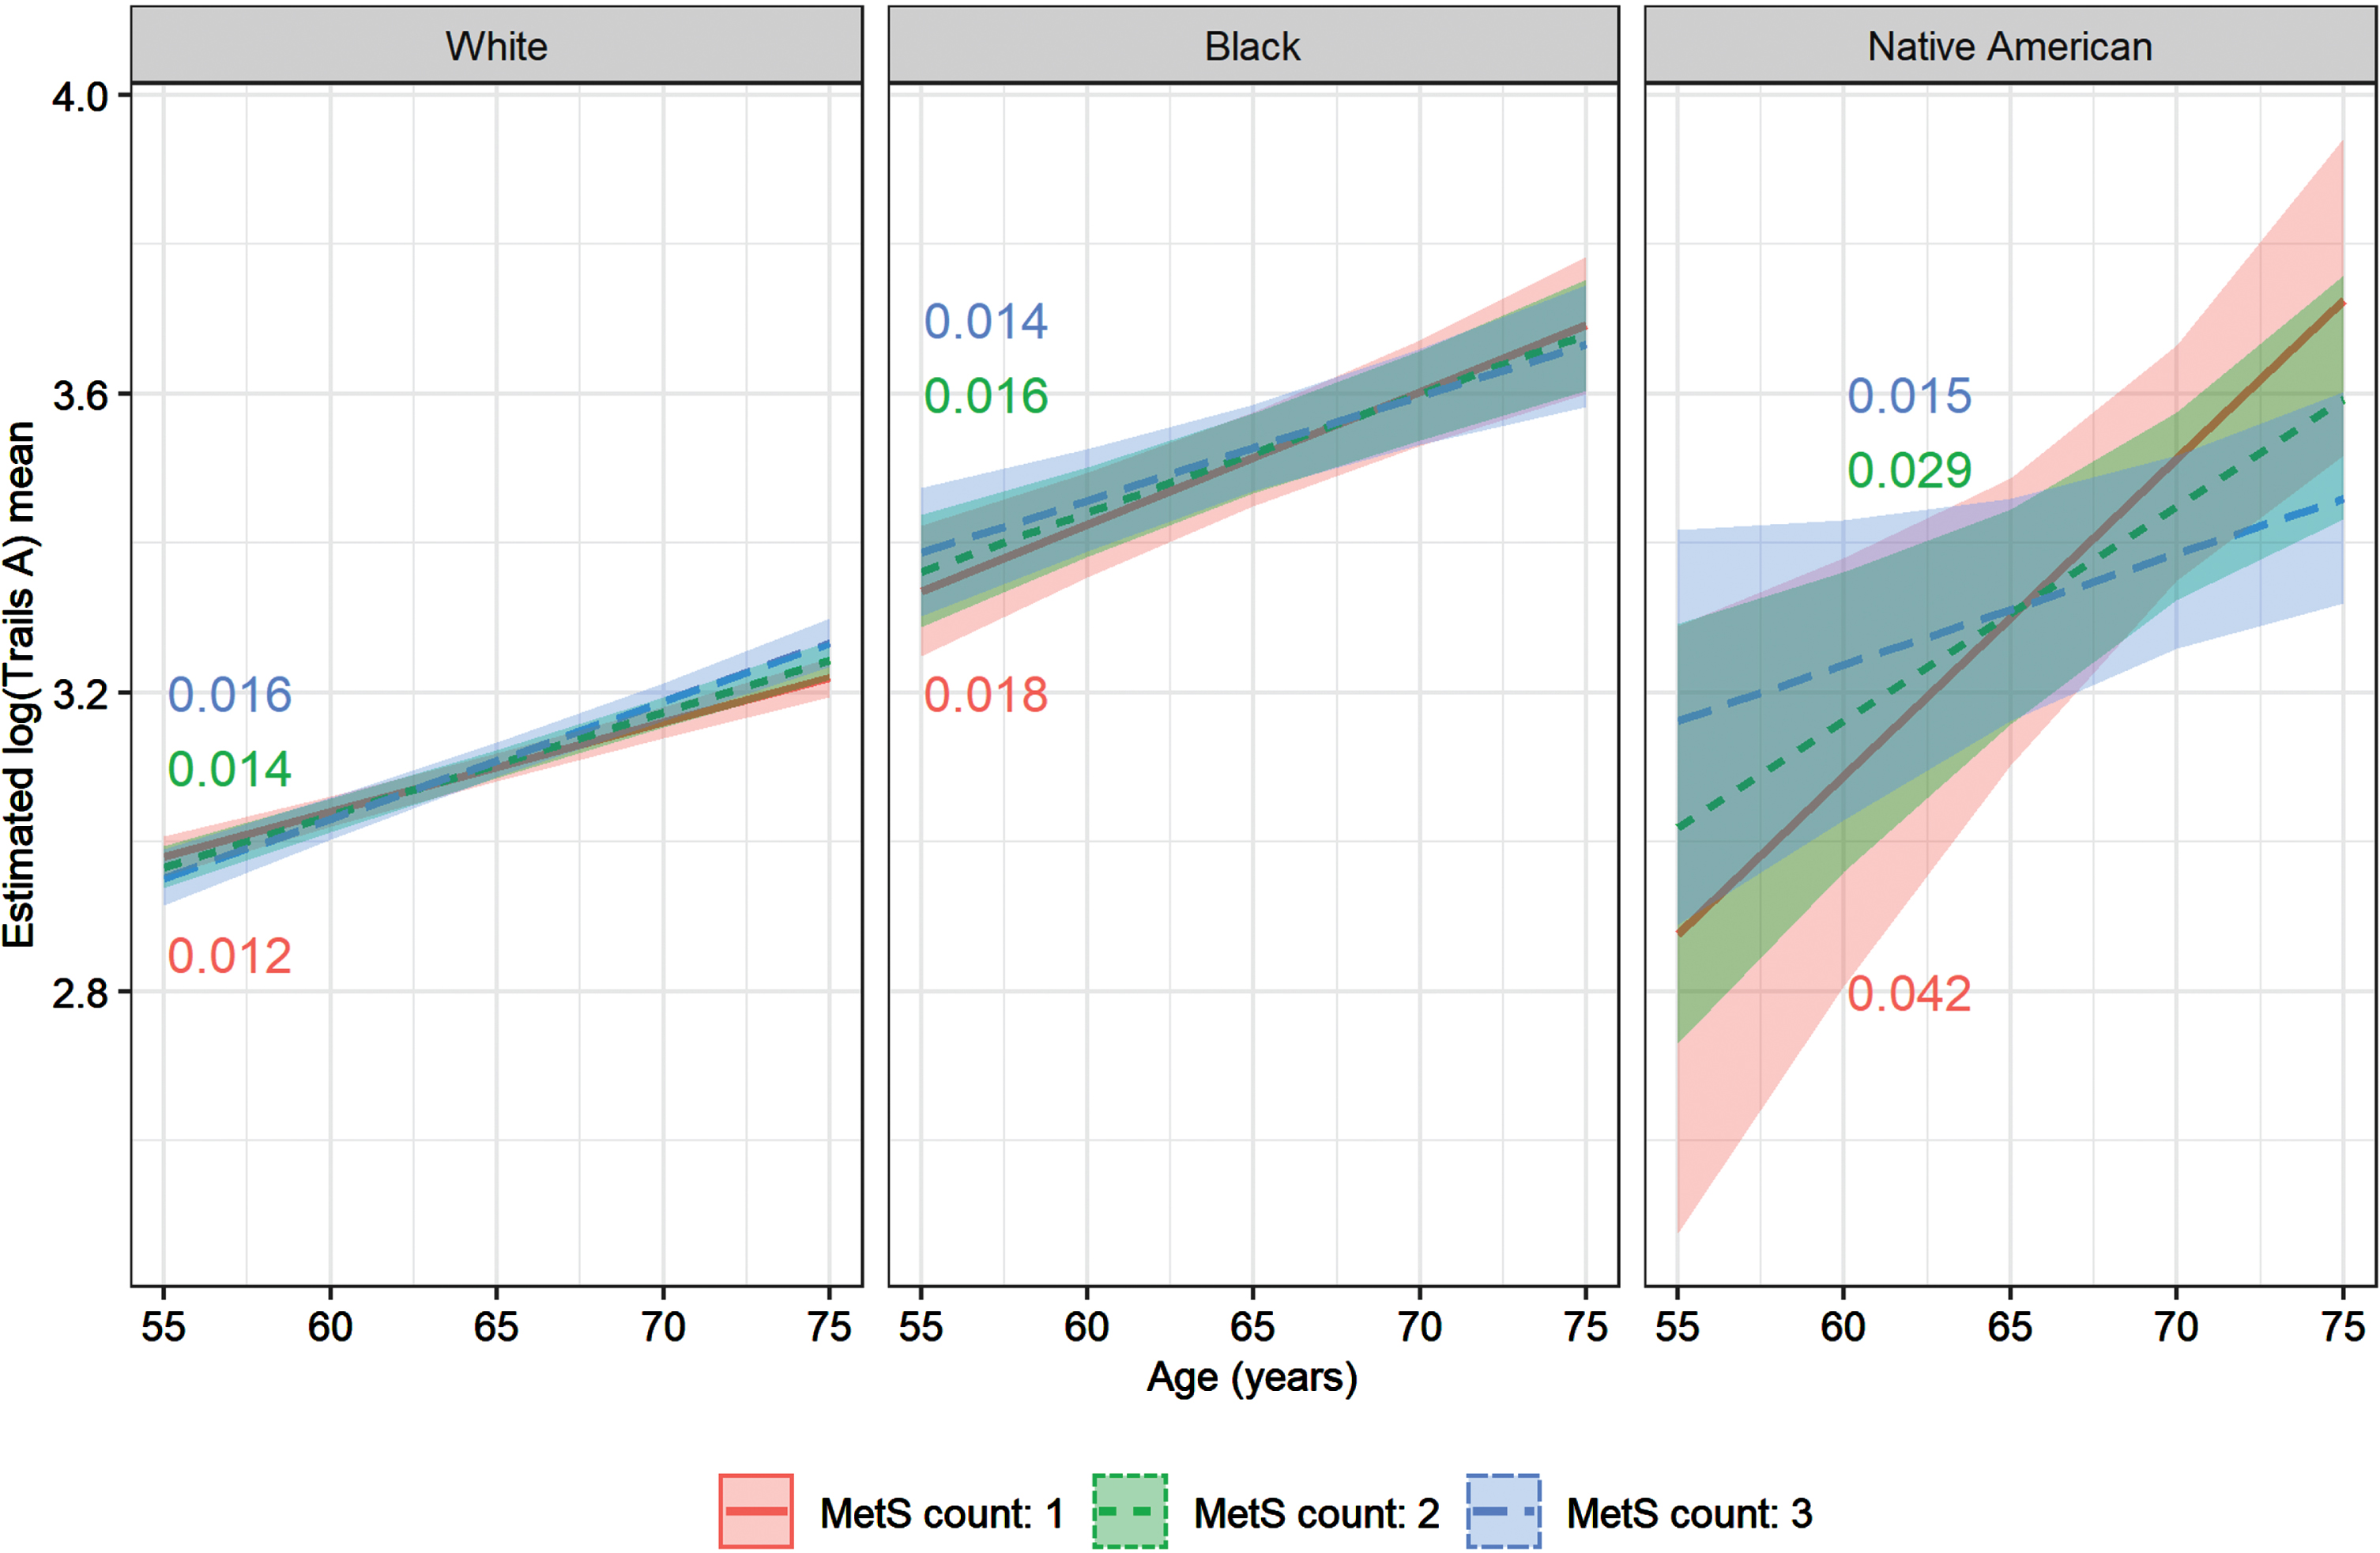
3-way interaction between performance on Trails Making Test-A by # metabolic risk factors by racialized group, with annotated slopes. Estimation performed for females with 16 years of education (gender mode and education median of the data).
Finally, we compared models to assess the influence of individual metabolic risk factors. The BIC reduction analyses indicated that no one health item appeared to be driving the result for this three-way interaction, as all health items were dropped from the Trails A model. As such, total MetS count, rather than its individual component elements appeared responsible for the interaction (see Table 3).
BIC analysis results
BIC is “Bayesian Information Criterion”, and is similar to a goodness-of-fit metric, where a lower BIC number means a better fit (generally). All models started with all 5 MetS item indicators and the three-way interaction with Age and Race, along with the nested two way interactions and main effects. An item was dropped from the model if it lowered the BIC when dropping it (and its interactions), and it was the item that lowered the BIC the most. After an item was dropped, the iteration starts again, and continues until either all 5 MetS items are removed, or removal of any remaining MetS item does not lower the BIC.
DISCUSSION
Metabolic burden affected cognition in an incremental manner across three racial groups
In this longitudinal observational cohort study of three racialized groups, we evaluated the effect of metabolic dysfunction on cognition. Our results suggest that across all groups, metabolic risk factor count associated with cognitive trajectory in an incremental manner such that greater metabolic dysfunction predicted worsening cognitive performance. Our findings provide support to the growing body of literature highlighting relationships between metabolic dysfunction, cognitive decline, and dementia and extend findings to a multi-racial sample.
Significant three-way interactions were limited to one measure of processing speed
While a significant overall statistical trend in associations between MetS count and cognitive decline was observed across racialized groups, an unexpected exception to the relationship emerged for Trails A. AA and NA both exhibited faster performance with increased metabolic dysfunction on one measure, Trails A. This effect was modest in the AA group but more pronounced in NA participants. Based on our relatively small samples of AA and NA, we interpret these findings with considerable caution. Unless replicated, they may be spurious. For example, an examination of participant level data revealed several of our oldest NA participants demonstrated performances in superior ranges despite high MetS count burden. These results may reflect a ‘super aging’ effect in a few individuals. Compared to the general population, super agers appear resilient and resistant to the pathological changes known to occur with aging [38]. Other possible explanations include differential loss to follow-up of older, more impaired patients in our racially marginalized groups, and/or differences in recruitment leading to cognitively healthier AA and NA participants at baseline. In total, follow-up studies with larger NAcan samples are needed to further clarify the role of metabolic dysfunction in these populations.
MetS may impart similar cognitive effects regardless of race
Apart from the Trails A results described above, models tested in three racialized groups suggested a similar pattern. Specifically, increasing MetS burden was incrementally associated with worse cognitive performance. This association occurred across racialized groups, suggesting that MetS works similarly regardless of racial identity. Our findings are consistent with previous studies revealing comparable brain effects of MetS across racialized groups. For example, in a longitudinal study of vascular risk factors and dementia incidence, diabetes, pre-hypertension, and hypertension were all found to be associated with subsequent dementia risk in both Blacks and Whites; the authors suggested that mechanistically, these vascular risk factors contribute similarly to AD risk in the two groups. [39]
Notably, the lower baseline cognitive performance among AA and NA participants compared to Whites, consistent with previous reports [19, 37], was independent of their metabolic burden, indicating that additional factors likely contributed to the differences seen in cognitive performance. Specifically, distal features such as environmental, behavioral, sociocultural, and biological factors likely also contribute. Recruitment and testing bias [40], higher levels of lifetime stress, differences in socioeconomic status, and level and quality of education may play individual and/or combined roles in the lower average baseline cognitive performance [41–44]. Taken together, these elements may also contribute to lower cognitive reserve which reduces the threshold for progression to cognitive impairment among racialized groups.
Because AA and NA exhibit higher levels of both metabolic dysfunction and ADRD, associations between metabolic risk factors and cognitive trajectory are particularly relevant for these populations. Consistent with previous studies, we found dissimilar amounts of metabolic dysfunction between the three racialized groups. Metabolic dysfunction is associated with multiple concomitants of underlying socioeconomic status disparities observed in racialized groups, and is potentially modifiable through multiple pathways (e.g., exercise, diet, pharmacological intervention, etc.). It may represent an accessible target through which to reduce dementia incidence in minoritized groups who are at greatest risk for disease.
MetS has also been associated with cognitive decline and dementia via disruption of the blood-brain barrier through neuroinflammation [45], arterial stiffness [46], and with global brain atrophy [47]. Given that many of these studies were conducted with White samples, our finding of similar effects of MetS on processing speed and executive function represents an important step toward extending these findings across racialized groups through improved research inclusivity. Moreover, our results are consistent with our hypothesis of similar mechanisms underlying associations between metabolic risk factors and cognitive function across racialized groups. Still, future studies will need to confirm the underlying biological mechanisms through which MetS affects cognitive decline in racialized groups.
Finally, we note that it is largely agreed that race is a social rather than biological construct, and a marker of exposures linked to the phenomenon of being racialized as Black or NA in the US [15]. Our comparison by racialized group does not imply that White race is the gold standard. Rather the goal was to ascertain whether being marginalized as a racialized group altered the relationship between metabolic dysfunction and cognition.
Study limitations
The generalizability of our findings is limited by the relatively smaller sample sizes of our AA and NA groups compared to non-Hispanic Whites. Small sample sizes in these groups raise concern for model overfitting in the BIC analyses. The smaller subject numbers for all racial groups in the digit symbol and simple speed models (see Supplementary Material) also make comparisons of results from these models to the other models difficult and should be interpreted with caution. Also, due to the inability to include subject-specific slope random effects, the fixed effects estimates related to longitudinal change represent some mixture of between-person and within-person longtitudinal variation. Additional longitudinal studies are needed to investigate associations between metabolic dysfunction and cognitive trajectory over greater durations. For future planning, it will be vital to be fully inclusive of other racial or ethnic groups to further assess differences in metabolic dysfunction.
Conclusion
Metabolic dysfunction incrementally affects cognitive trajectory, with generally similar associations across racialized groups. Since racialized groups exhibit higher levels of both MetS and ADRD, MetS may represent an important and modifiable target through which to reduce risk of ADRD—especially for marginalized groups. To this end, we must first increase the racial and ethnic diversity of our clinical research populations.
Footnotes
ACKNOWLEDGMENTS
Dr. Bouges would like to acknowledge her mentors, Drs. Carlsson, Gleason & Lindsey Clark, the Gleason & Zuelsdorff lab, the Wisconsin ADRC & WRAP Core Studies, and the Division of Geriatrics for all their support.
FUNDING
Funding included the National Institutes on Aging-National Institutes of Health (R01AG054059 Gleason, R01AG27161 Johnson, R03AG063303 Zuelsdorff), the Alzheimer’s Association (AARF-18-562958 Zuelsdorff, AARF-19-643973 Ennis), the Wisconsin ADRC P30AG062715, PI Sanjay Asthana, MD, and the use of resources and facilities of the William S. Middleton Veterans Hospital.
The views expressed in this article are those of the authors and do not necessarily reflect the position or policy of the Department of Veterans Affairs or the United States government.
CONFLICT OF INTEREST
The authors have no conflict of interest to report.
DATA AVAILABILITY
The data are not publicly available due to privacy and ethical restrictions. Data may potentially be available on request but require a data use agreement be in place first before data sharing can occur.