






Abstract
Energy storage using batteries is emerging as a fundamental element of standalone power system based on non conventional energy sources like wind and solar to increase the penetration level of these sources. The planning of standalone power system incorporating renewable sources and storage necessitates a vigilant study on modeling of a storage system. In most of the planning study reported in literature pertaining to battery storage, charging efficiency (CE) of a battery is assumed to be fixed at constant value. However, CE and State of charge (SOC) of the battery both are correlated. In this paper, Interval Type(IT)-2 fuzzy logic has been applied for determining CE of battery relative to a specific SOC. For evaluating reliability indices i.e. Expected Energy not served (EENS), probabilistic analysis using analytical method has been applied to the standalone power system, situated near Kandla Port in Gujarat, India. The effect of considering CE of battery as a function of SOC has been compared with the constant value of CE of battery for the different groups consisting of solar-battery storage, wind turbine(WT)-battery storage, and wind-solar battery storage systems.
Introduction
Renewable energy based generation has seen tremendous growth in the recent years. A large expansion of intermittent renewable energies (wind and solar) will consequently require in the future an important deployment of storage facilities. Battery storage is essential for such systems to keep adequacy level of reliability and to create them more dispatchable. For stand-alone Hybrid power systems, the design and sizing of the PV array, wind turbine generating units, and the battery storage capacity strongly depends on the performance of the batteries, an adequate prediction of the battery’s behavior is essential [10].
In the standalone hybrid power system a safe battery use is ensured by keeping away the battery from over-charge or over-discharge that can lead to prematurely battery damage. For this reason, the real-time battery SOC should be eternally updated. The SOC indication plays a major role to compute the battery available energy and hence to predict its independence. The battery is a complex electrochemical system, a sensor cannot directly evaluated the battery SOC. Thus it should be determined. The available SOC estimation methods have some confines and cannot be generalized to unidentified battery dynamics configurations, and therefore are not generic. Furthermore, these methods do not take into account the variables battery internal characteristics and its uncontrollable use conditions in real-time applications. Sometimes the battery is to be disconnected to compute parameters to give a SOC estimation which is not possible during operation. Accordingly, providing a reliable SOC evaluation for any battery technology regardless of its internal characteristics and its use conditions in real-time applications such as smart grid is required.
Numerous battery models have been explained in the literature [19], most of the author concentrate on SOC, open circuit Voltage, battery lifetime and temperature. CE of battery assumed to be Constant by many of the system planning studies. Yang et al. [20] focused on battery power, SOC, battery charging/discharge characteristics, self-discharge rate. The voltage evaluation depends on the O/C voltage of the lithium-ion battery [23] by which SOC is estimated. In [24], a set of new battery energy storage system (BESS) models based on SOC is presented that is configured and parameterized for utilizing in system impact studies as well as transmission planning studies. For battery SOC assessment, sliding mode observer is applied and, it is used as a tough and reliable tool for estimation of SOC in the presence of parameter uncertainties and disturbances [25]. SOC is analyzed with combination of Open Circuit(O/C) voltage and Coulomb Counting method [26]. In small-grid, energy efficiency for lithium-ion as storage device is considered in [27]. Wen-Yeau Chang [33] presented the review on battery SOC estimation under chargeing/discharging condition. The SOC of the battery will also influence CE. With the battery at a partial charge, the CE may be over 90%, dropping to nearer 60% when the battery is above 80% charged. However, it has been found that if a battery is only partially charged, efficiency may be reduced with each charge. If this situation persists (the batteries never reaching full charge), the life of the battery may be reduced [41]. Peukert’s equation [21] is used to determine CE of the battery.
In [22], it is shown that the relation between CE and SOC of the battery is non-linear. The SOC of a battery varies significantly if it is used in combination with the non-conventional sources due to their inherently unpredictable nature. Thus assuming a constant CE of the battery may provide an unrealistic study utilized in the planning of system.
In this study, IT-2 fuzzy logic model is applied for determining CE of lead acid battery related to SOC. The efficacy of proposed method has shown by conduct reliability evaluation studies for a standalone system based on non-conventional resources and energy storage. Analytical technique [3] is used to perform the reliability evaluation.
In Table 3 data for lead-acid battery (1000 Ah) is given which is used in this work. Lead-acid battery is extensively used rechargeable battery. Lead-acid batteries have Low capital costs, quick response times, less self-discharge rates (less than 0.3%) and cycle efficiencies are comparatively high, compared to other batteries. Now a day the advancement on lead-acid batteries concentrates on:
To performance enhancement innovating materials like enhancing the deep discharge capability and extending cycling times. To use in the solar and wind power integration, implementing the battery technology.
Battery SOC estimating methods
SOC estimation of battery is turn out to be an increasingly major issue for the purpose that include renewable resources along with battery. Several SOC estimation methods has been proposed in literature for evaluating the amount of energy required from the storage. Some techniques are given below [17–37].
Direct measurement: Physical battery Characteristics are used in this method, for example, the impedance and voltage of the battery.
OCV method, Terminal voltage method, Impedance method, Impedance spectroscopy method. Book-keeping estimation: In this technique discharging current is integrated concerning time for estimation of the SOC
Coulomb counting method, Modified coulomb counting method. Adaptive systems: The SOC for different discharging conditions can automatically adjust in this technique. It is a self-designing method.
BP Neural- Network(NN) RBF NN Fuzzy Logic Method Fuzzy NN Kalman Filter Hybrid methods: It allows a global estimation performance. In a comparison of individual methods, the hybrid techniques generally produce high-quality estimation.
Coulomb counting and EMF combination Coulomb counting and Kalman filter combination Per-unit system and EKF combination
The most commonly used technique for SOC calculation is ampere hour counting method [15]. In this method, estimation process is suitable for tracking the fast changes of SOC. For calculation of battery SOC, it is essential to know the initial point SOC, the value of current and period of discharge/charging, then SOC can be obtained using following equations [37]:
Equation (1) represents a SOC of the ideal battery,
Where,
= initial point SOC,
= initial point time and time period considered respectively in hours,
= capacity of the battery in amp-hours,
= value of current in Amp.
Although in charging, discharging operation and during the storage period, losses will occur, consider these factors in the study, the SOC of the battery is calculated using Equation (2):
Where σ is the self-discharge rate, generally 0.2 percent for each day is suggested, ηbattery represents charging and discharging efficiency of the battery.
Autonomous hybrid power system which involves storage assuming constant CE of the battery. On the other hand, their exist strong correlation between CE and SOC of battery. John W. Stevens et al. [22] conduct a test on the lead-acid battery and have found that CE is a nonlinear function of SOC. At the higher value of SOC, CE is no longer constant.
Hence in optimal system planning assumption of a constant CE can direct to false study. For determining CE of battery relative to SOC, IT-2 fuzzy logic model has been represented in this work.
According to the literature survey for measuring the progress of electric utilities with the initiatives of the smart grid, first reason for the implementation of these efforts is reliability. Reliability is a method of addressing the long-term adequacy of electric systems for supplying energy to its customers along with the security of supply [1]. Reliability assessment of hybrid electrical power system can be performed either analytically or numerically [4]. An analytical approach has been successfully reported in the literature due to its excellent computational performance over numerical method (Monte Carlo Simulation) [2, 3]. In this paper, the systems are represented by mathematical models for implementing the analytical technique for a standalone system composed of renewable sources and battery storage. Various steps for the reliability assessment of standalone power system using the analytical procedure as follows:
Modelling of renewable resources
The random behavior of wind speed & solar irradiance cause problems in the reliability assessment as the production from these sources is stochastic. Hence the adequate modeling of available meteorological information like wind speed, temperature and solar radiation are very necessary. R. Iqdour et al. use the TS fuzzy logic system for modeling the daily solar radiation [34]. Mihalakakou [5] represented solar irradiance time series model based on Neural Network. A survey on AI methodology for forecasting and modeling of the solar radiation is shown in Mellit et al. [6] where numerous techniques have been evaluated. Time series method, Markov transition matrix, and Probability distribution function have been widely used by many researchers for generation of meteorological data [35, 36].
In this work, two-parameter Weibull distribution in Equation (3) and standard beta probability distribution function(pdf) in Equation (4) are utilized in modeling of wind speed and solar radiation respectively [9–40]. The wind speed and solar radiation vary unpredictably which have a strong correlation with time. Thus in order to negate the effect of correlation the study period (1 year) is divided into the number of time segments(8760 segments) each time segment having a period of 1 hr. The obtained models of solar irradiance and wind speed have been combined together by listing all the possible combinations of the renewable resources to produce complete renewable resource model for each time frame. The power output calculation from the WT unit shown in Equation (5) and solar unit in Equation (8), corresponding to states of wind speed and solar radiation respectively are explained in [11, 12].
Where,
= Speed of wind (m/s)
= weibull pdf for v
= shape and scale parameter
= Solar radiation (kw/m2)
= Beta pdf for s
= beta pdf Parameters
The output power from WT units for wind speed can be calculated as:
Where,
= Rated output power WT unit in kW
= Wind Turbine cut-in speed (m/s)
= Wind Turbine rated speed (m/s)
= Wind Turbine cut-out speed (m/s)
The current and voltage of a PV unit are function of solar irradiance, therefore output power generated from PV module is also a function of solar irradiance. The maximum power from a Photo Voltaic array comprising of N modules can be calculated as:
Where
= OCV (V)
= PV unit S/C current (A)
= voltage at MPP (V)
= Current at MPP (A)
= S/C current (A)
Based on forced outage rate of generating units, System Availability and unavailability Model has been developed. This model comprises of various output states of individual generating units with corresponding probabilities. The development of availability and unavailability model has been discussing in [3, 4]. The procedure for development of availability model of generating unit is briefly discussed below [13, 14]:
Developed various output states of the individual wind turbine (WT) generating units and convolving to develop availability model of WT generating units. Developed various output states of individual Photovoltaic (PV) unit and convolving to develop availability model of PV generating units. Combining the availability models of WT generating units and PV units to obtain overall availability model of generating units which composed of all probable combination of o/p states of generating units with their corresponding probability shown in Equation (10).
Where
= Availability model
= vector comprising of o/p states of solar and WT unit
= Probability associated with Cm
= Capacity level of PV arrays
= Capacity level of WT units
In next step, combine the developed models presented in Sections 3.1 and 3.2, for calculation of output power. The power output from generating units depends on their relevant sources with their status (whether available or unavailable) [3] can be expressed as:
Power output from PV units shown in Equation (12):
Power output from WT units shown in Equation (13):
Battery will undergo charging/discharging operation based on power availability from PV-WT generating units and loading conditions. Thus, energy availability in battery and consequently battery SOC of the following time segment is a function of discharging/charging operation occurring in previous time segments [15]. In this work battery SOC model proposed in [16] has been adopted. The battery State of Charge for following time segments can be evaluated as shown in Equation (14):
Where
= Battery SOC for (n + 1) th time segment
= Battery SOC for nth time segment
= Rated battery capacity (kWh)
= self discharge rate (% per day)
= nth time segment length (1 hours)
= Battery charging/discharge efficiency
= Charging/Discharging power through battery during nth time segment (KW).
The maximum charging/discharging power flowing through battery is constraints by the limit of SOC as well as limits of charging/discharging current. In this work probabilistic battery storage model has been used, for every hour the probability of SOC is updated depending on charging/discharging of the battery. The development of model has been discussed in [13].
Reliability indices reflect power system reliability level. The models discussed in previous section (i.e. 3.1 to 3.3) are combined for evaluating reliability indices. For a period considered (1 year), by monitoring power margin hourly, energy not supplied (ENS) in kWh can be obtained. The reliability indices calculated in this work is Expected energy not served (EENS). EENS is described as the amount of energy which the generating unit capacity is unable to supply over the study period.
Interval type-2 fuzzy logic system for determination of battery CE
Zadeh [18] introduced the theory of Type-2 fuzzy logic as an extension of the theory of a type-1 fuzzy logic set. An IT-2 Fuzzy Logic system [7, 8] covers rule base, fuzzifier, an output processor and fuzzy inference engine. The output processor includes defuzzifier and type-reducer.
CE of battery is related to SOC, having high value at low SOC and reduces when close to full charge [22]. For determining CE of battery relevant to appropriate SOC, an IT-2 fuzzy logic model has presented in this study. Fuzzy is a rule-based system, and CE can be simply approximated employing this method. An IT-2 Fuzzy Logic model is characterized by IF-THEN rules.
In this work, input fuzzy variable is State of Charge and output variable is CE of a battery. Membership functions are assigned to both input and output fuzzy variable as shown in Figs. 1 and 2. The formation of membership function is based on experimentation conduct on lead acid battery [22]. The inference rules used in the model are asfollows:
IF SOC is Extremely High THEN Efficiency is very Low. IF SOC is High THEN Efficiency is Low. IF SOC is Medium THEN Efficiency is Medium. IF SOC is low THEN Efficiency is High.
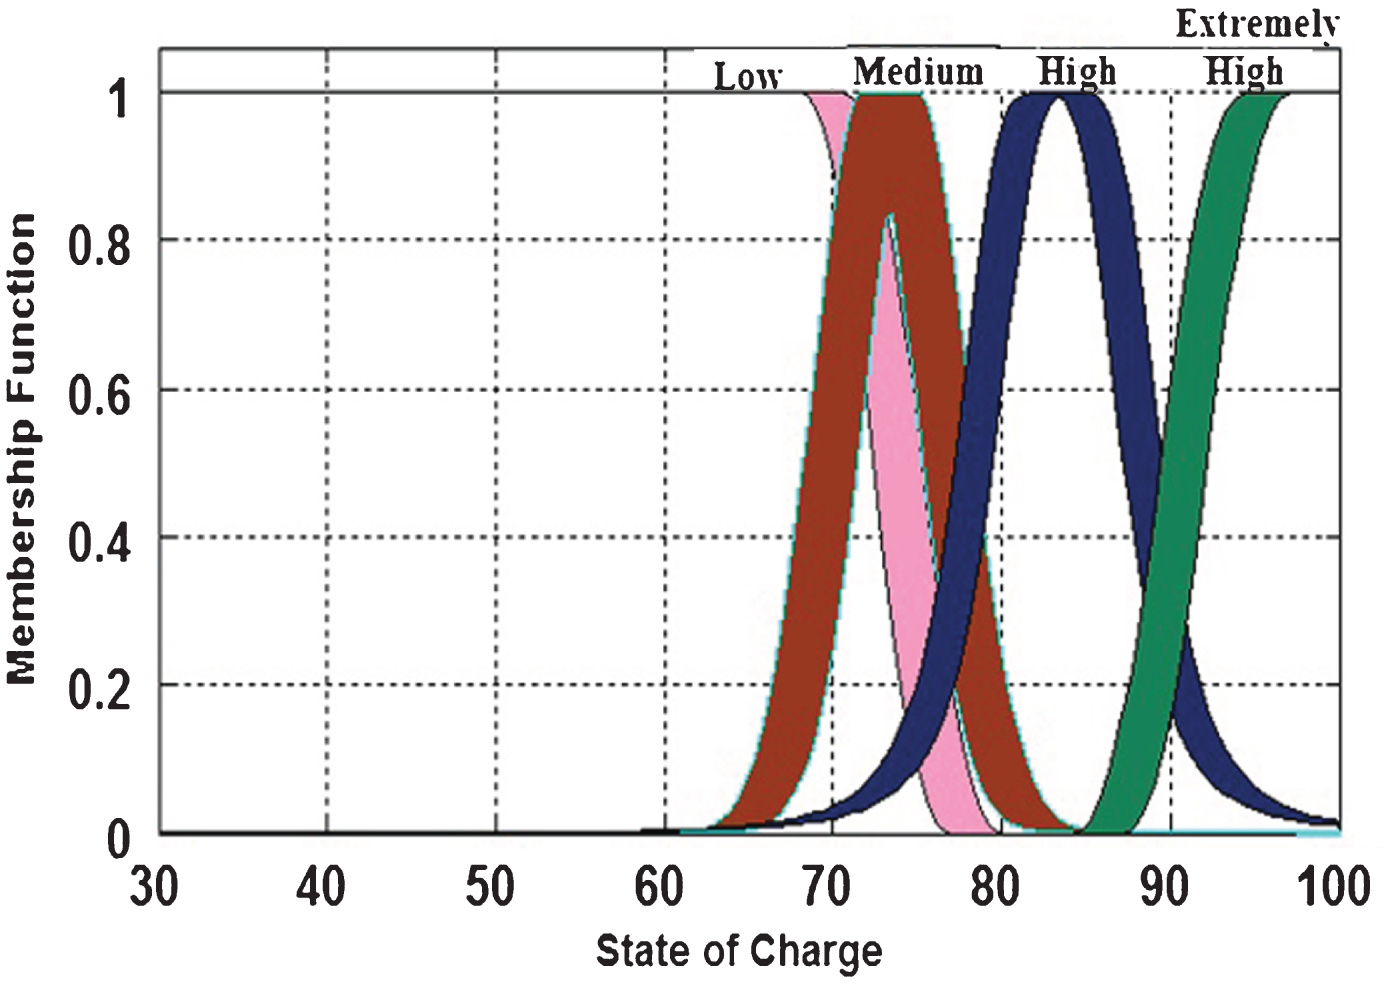
IT-2 Membership function plot for SOC.
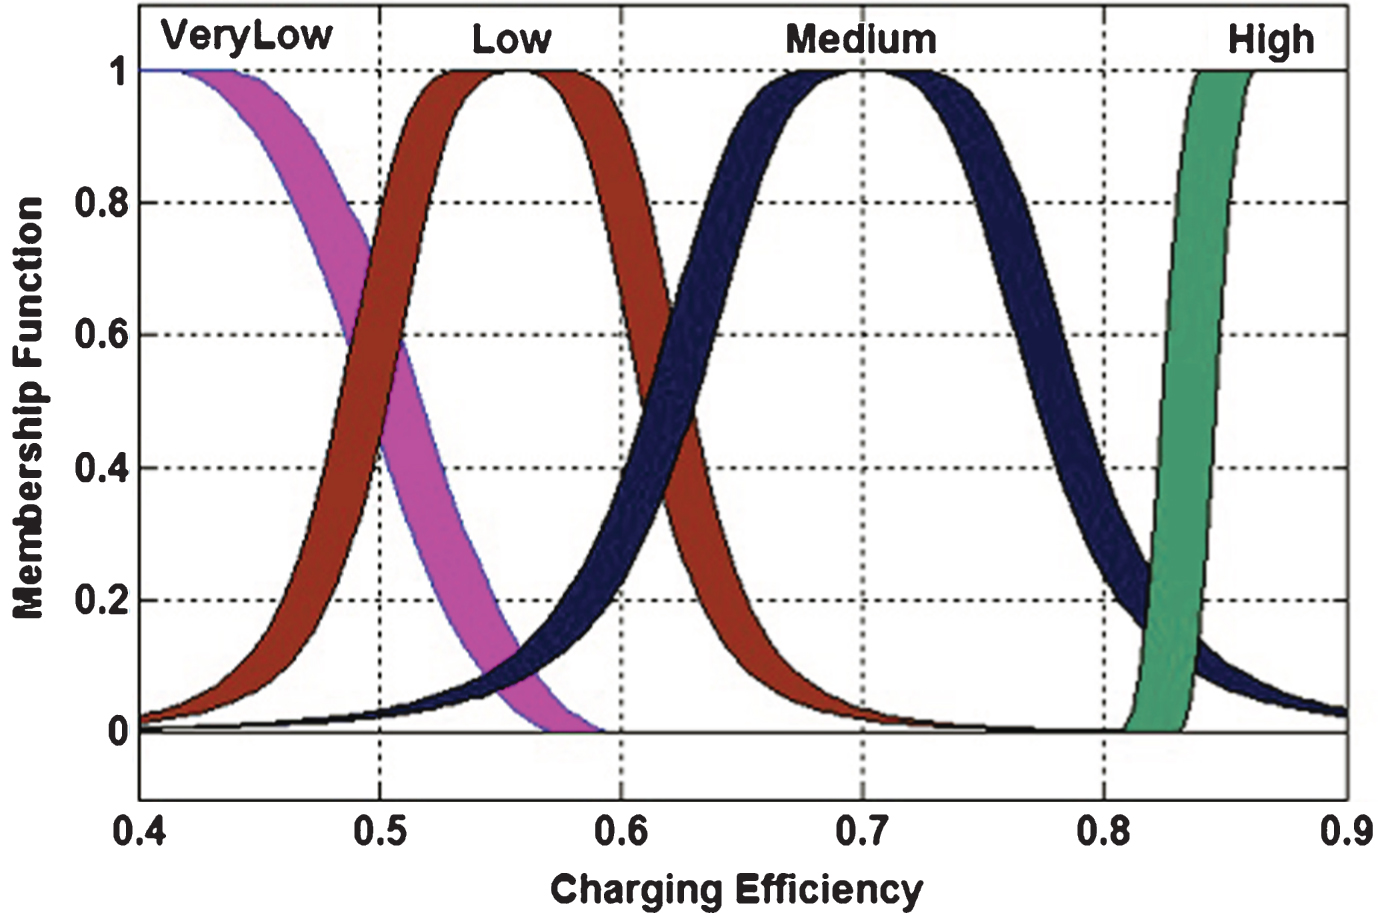
IT-2 Membership function plot for CE.
It is observed from the Fig. 3 that with the higher value of battery SOC, CE is no longer constant. Hence assumption of a constant CE of the battery can lead to inappropriate results.
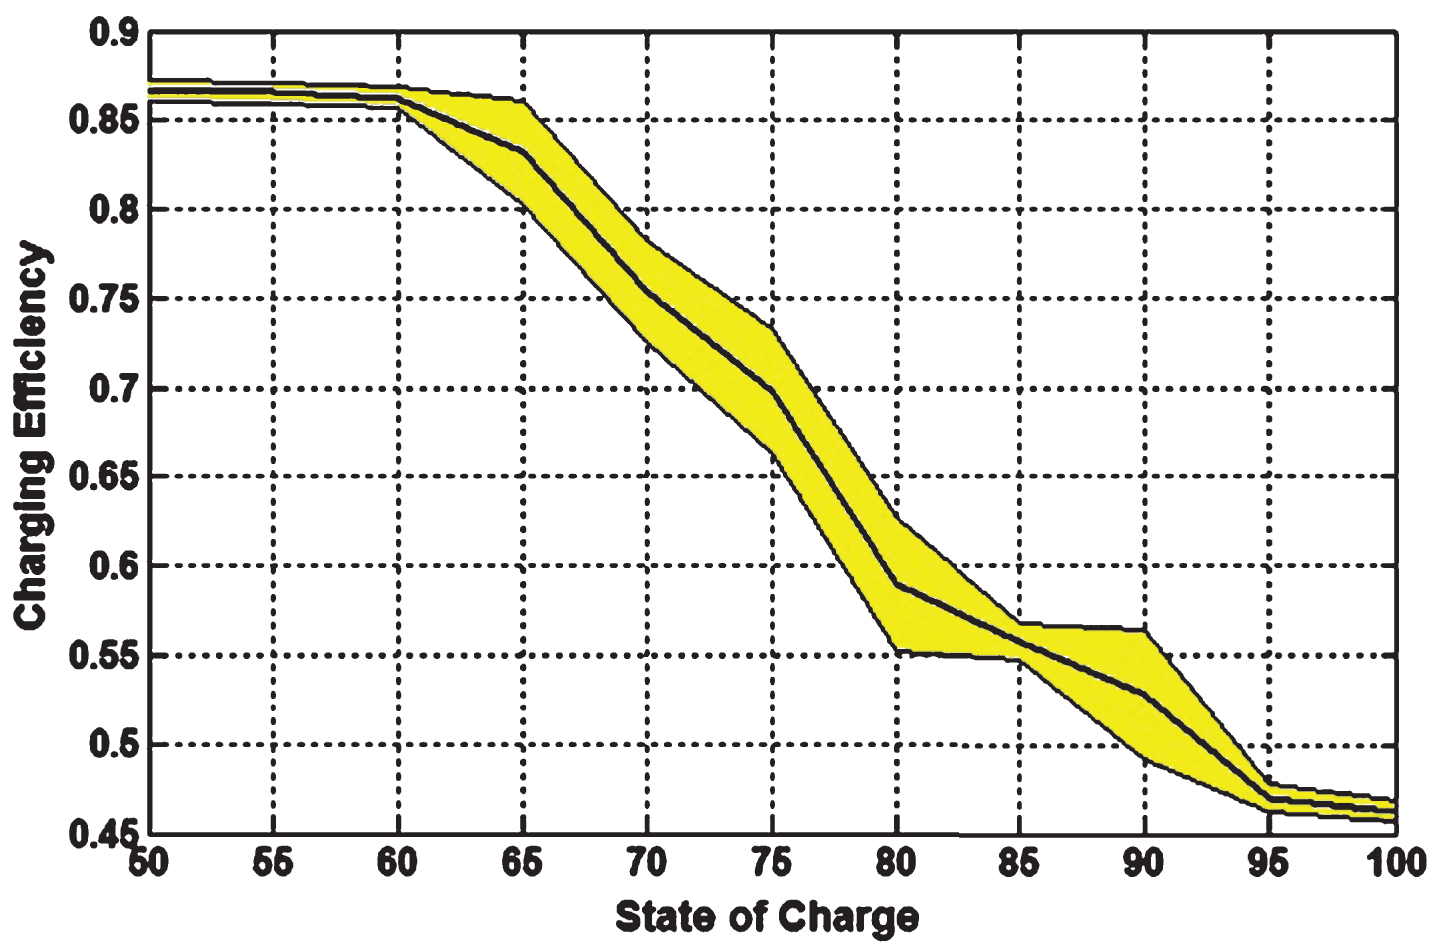
CE relative to SOC determine through IT-2 fuzzy logic.
By applying IT2 fuzzy logic model, the obtained characteristic of Battery SOC and CE is same as actual characteristic of battery as shown in Fig. 3.
The proposed technique has been applied to a standalone power system, situated near Kandla port (Gujarat, India) for reliability assessment [38, 39]. The developed IT-2 fuzzy logic model for determination of CE has been validated with respect to constant CE in terms of reliability indices. The impact on different parameters such as SOC, reliability indices (EENS), battery charging power, and power supplied by the battery is examined by considering constant CE of battery and CE of battery determined through Interval Type-2 fuzzy logic. For the site under study, the necessary data for wind speed and solar irradiance ambient temperature have been obtained from [28, 29]. The Load data has been taken from IEEE Reliability Test System [30]. The study period of a year is dived into 8760 segments and each segment referring to one hour, load for a particular time segment is fixed. Converters and storage system are supposed to be 100% consistent. The specification of PV module and WT used in this work are given in Table 1.
Specification for PV Module and WT unit
Specification for PV Module and WT unit
The technical parameters used in the study pertaining to battery storage (Lead Acid batteries), PV arrays and WT units, are given in Table 2. The Reliability indices evaluation for different sizing pertaining to solar- storage, wind- storage, solar-wind-storage is given in Tables 3–5 respectively.
Parameters for battery storage, PV array and WT units
Reliability indices for different sizing of solar and storage
Reliability indices for different sizing of WT unit and storage
Reliability indices for different sizing of Solar, WT unit and storage
In Figs. 5–7 demonstrate and compare the effect of CE through two approaches (Constant and obtained through IT-2 Fuzzy Logic) on the different parameters such as charging power in kW, EENS in kWh, and SOC. Constant CE has been assumed as 0.75. The study is shown for a day of winter month concerning different sizing of generating sources and storage. Similar analyses are obtained for different time segments as well. In this work, EENS is measured by both the approaches and it can be observed that CE obtains through IT-2 Fuzzy Logic gives more accurate results. Figures 4–8 demonstrate power supplied by renewable energy resources and storage system. From Fig. 4 it is observed that capacity of PV array during a sunshine hour is sufficient enough not only to supply load but also be able to charge the battery storage and thus maintaining the reliability of a solar-battery system. The variation in power charging with two approaches is shown in Fig. 5. From the result obtained in Figs. 5– 7 it can be observed that CE obtained relative to battery SOC can be lower and higher than assumed a constant value of CE thus affects power availability in storage.
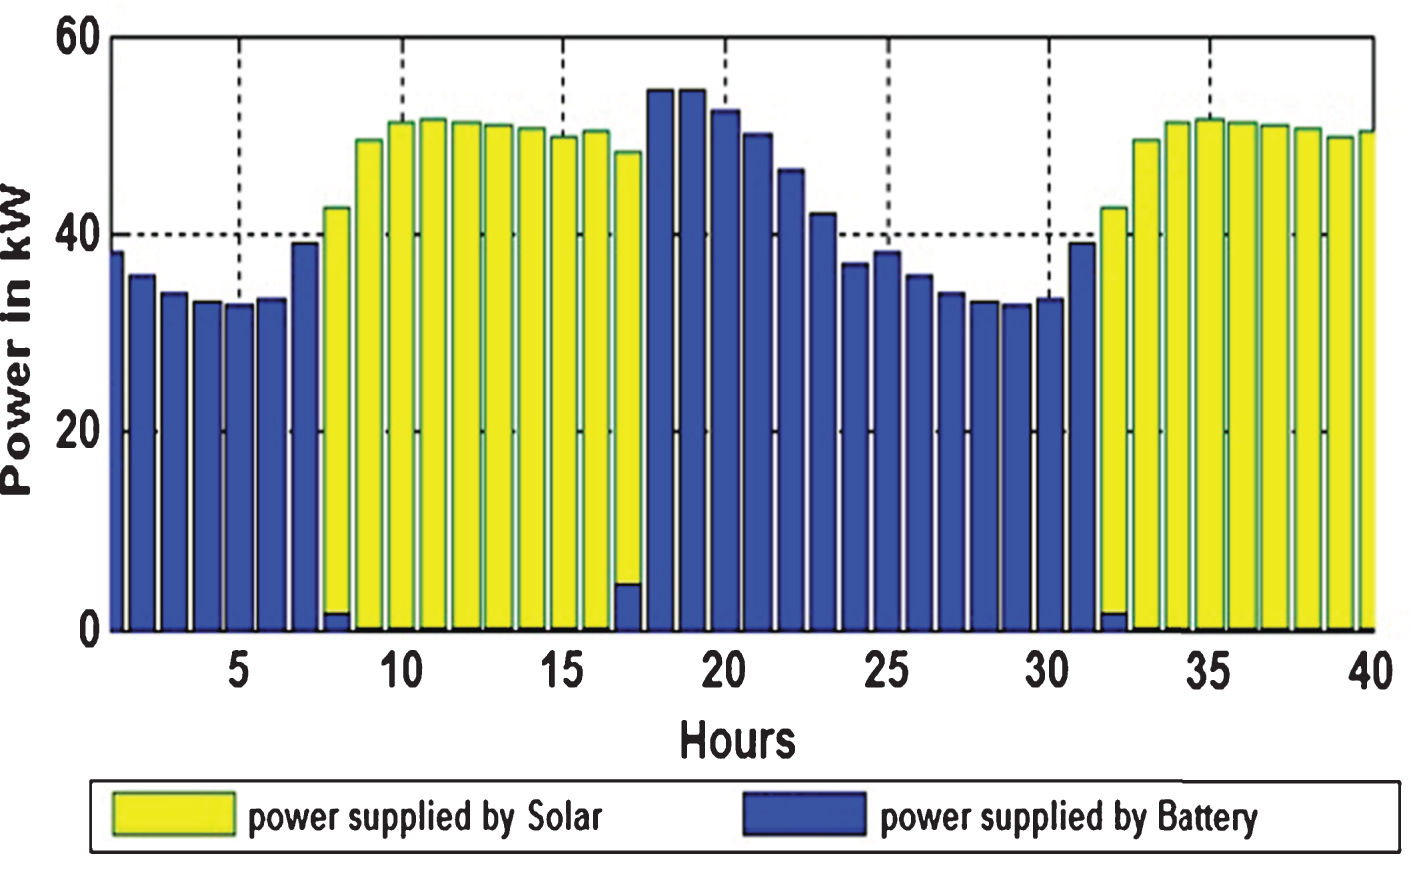
Distribution of power supplied for case 1 pertaining to solar and storage.
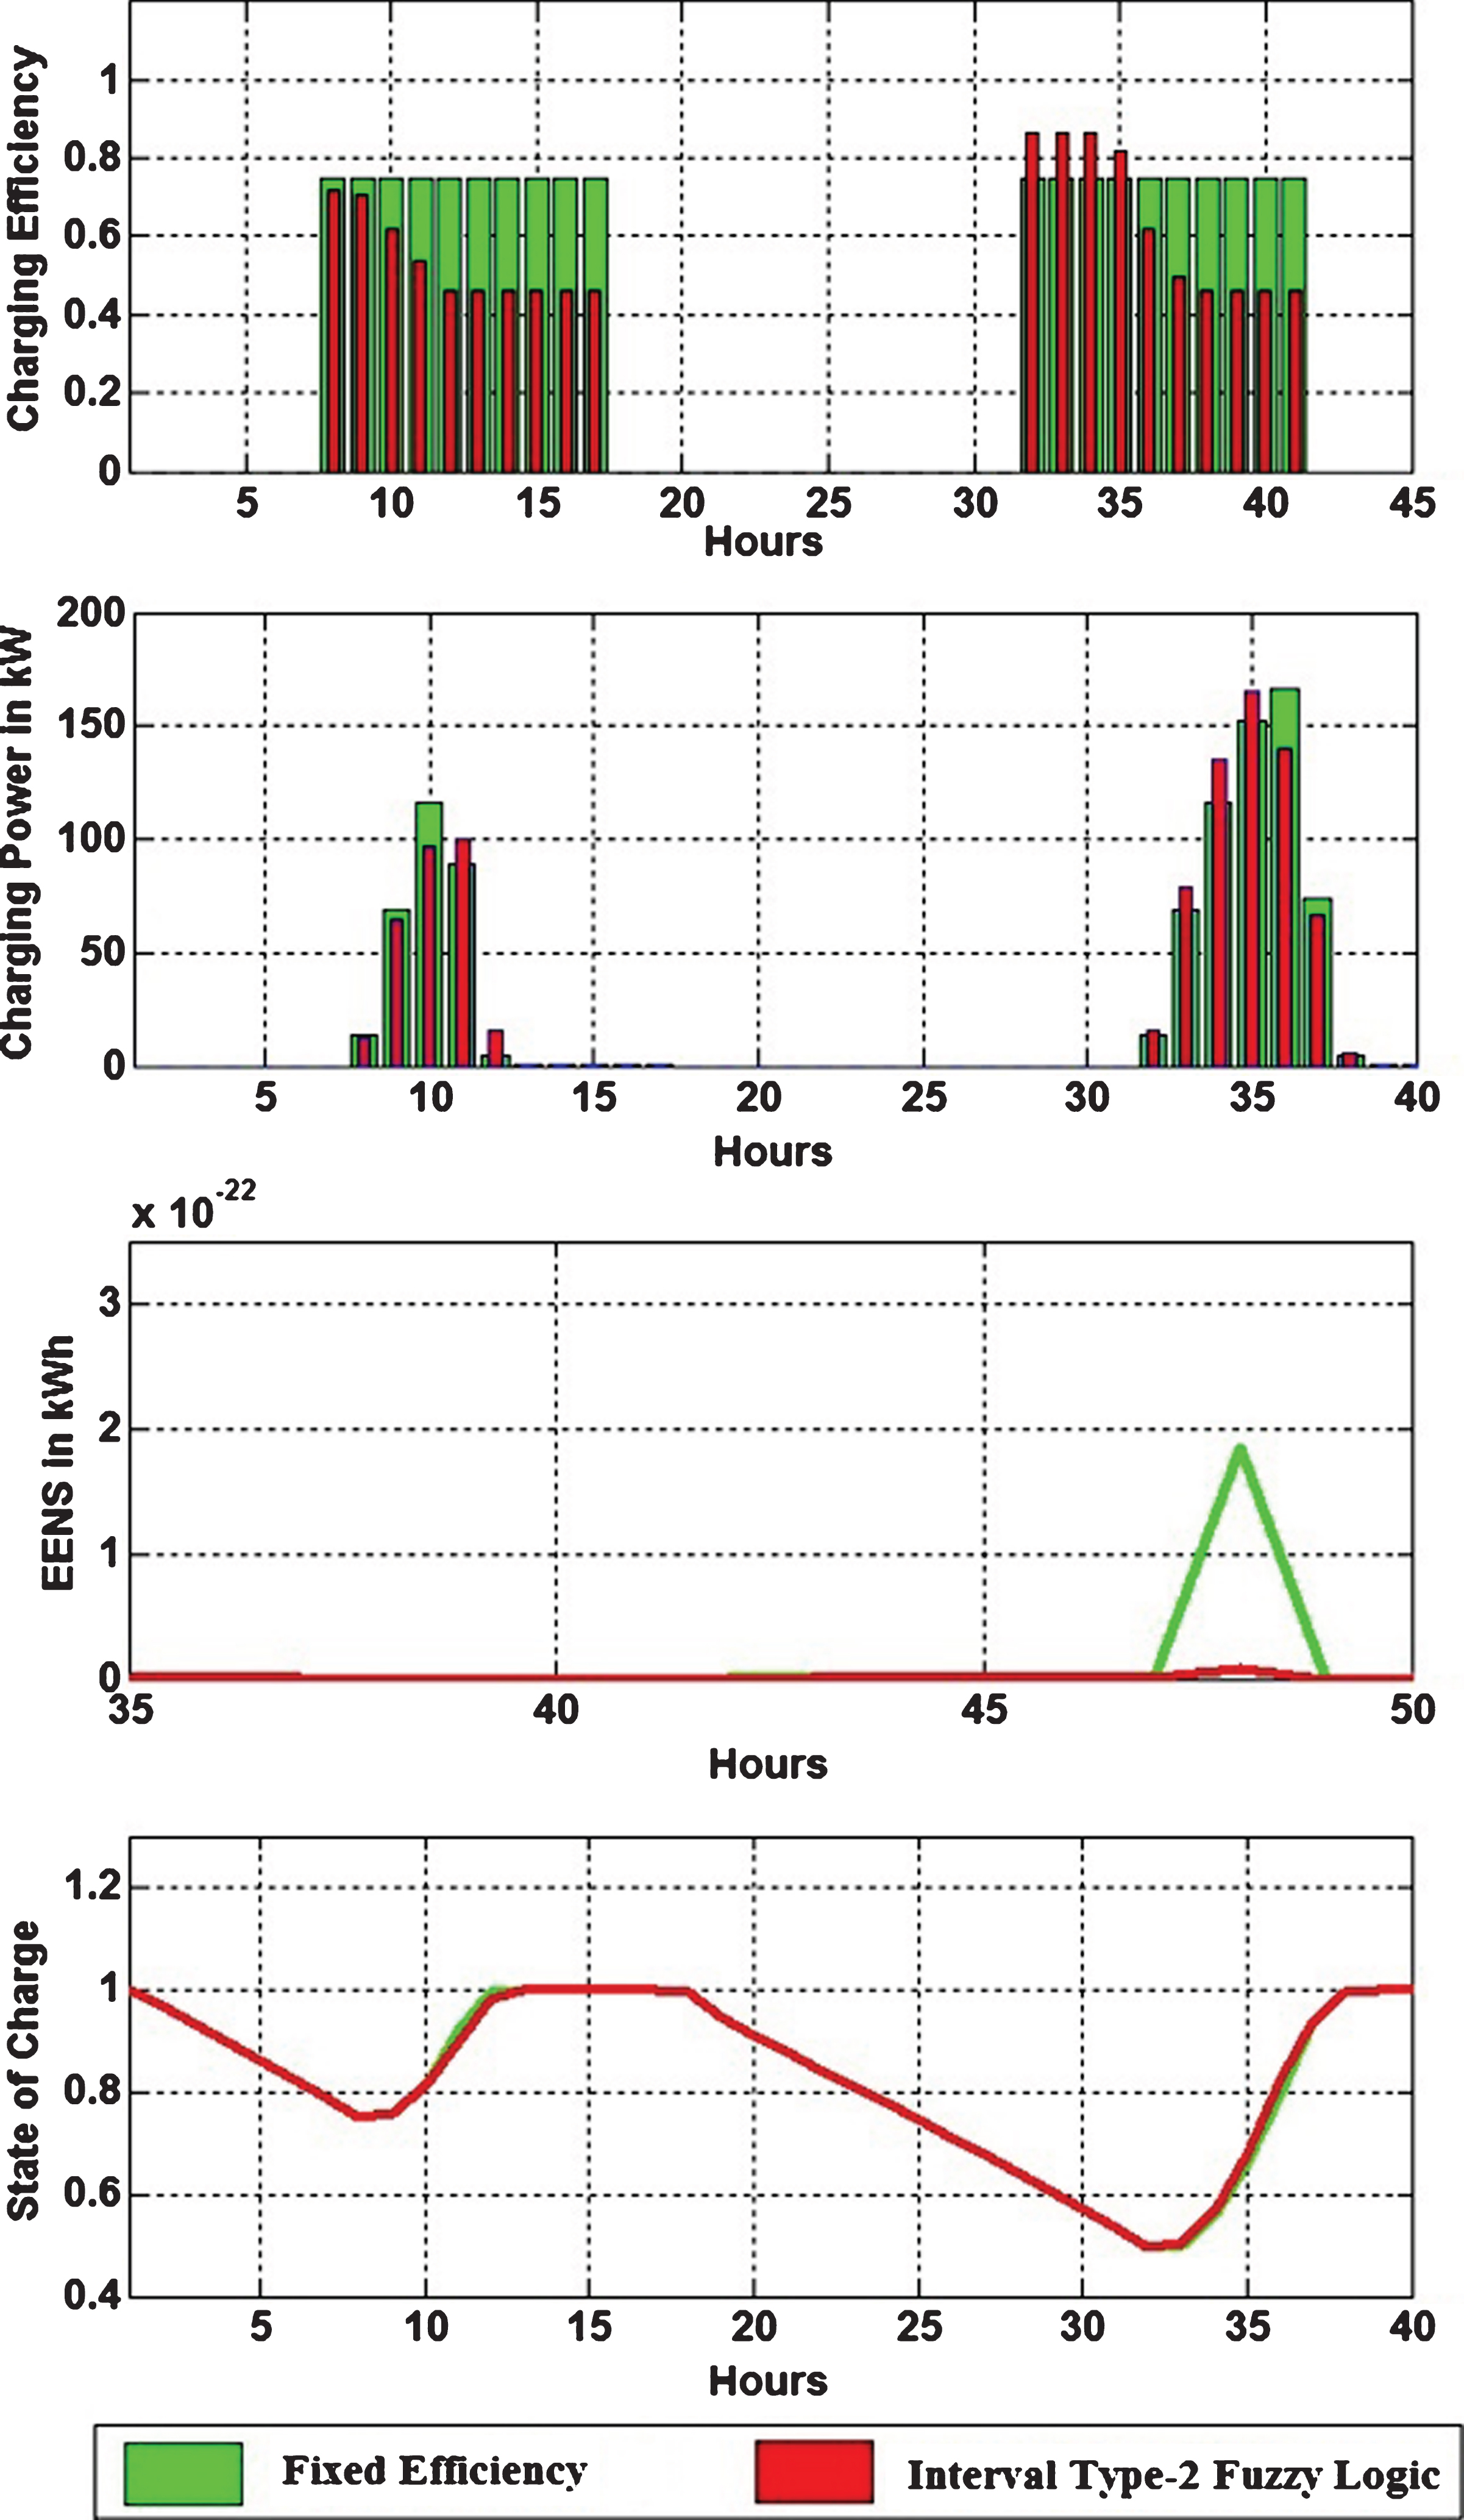
Effect of CE on parameters through IT-2 fuzzy logic for case 1 pertaining to solar and storage.
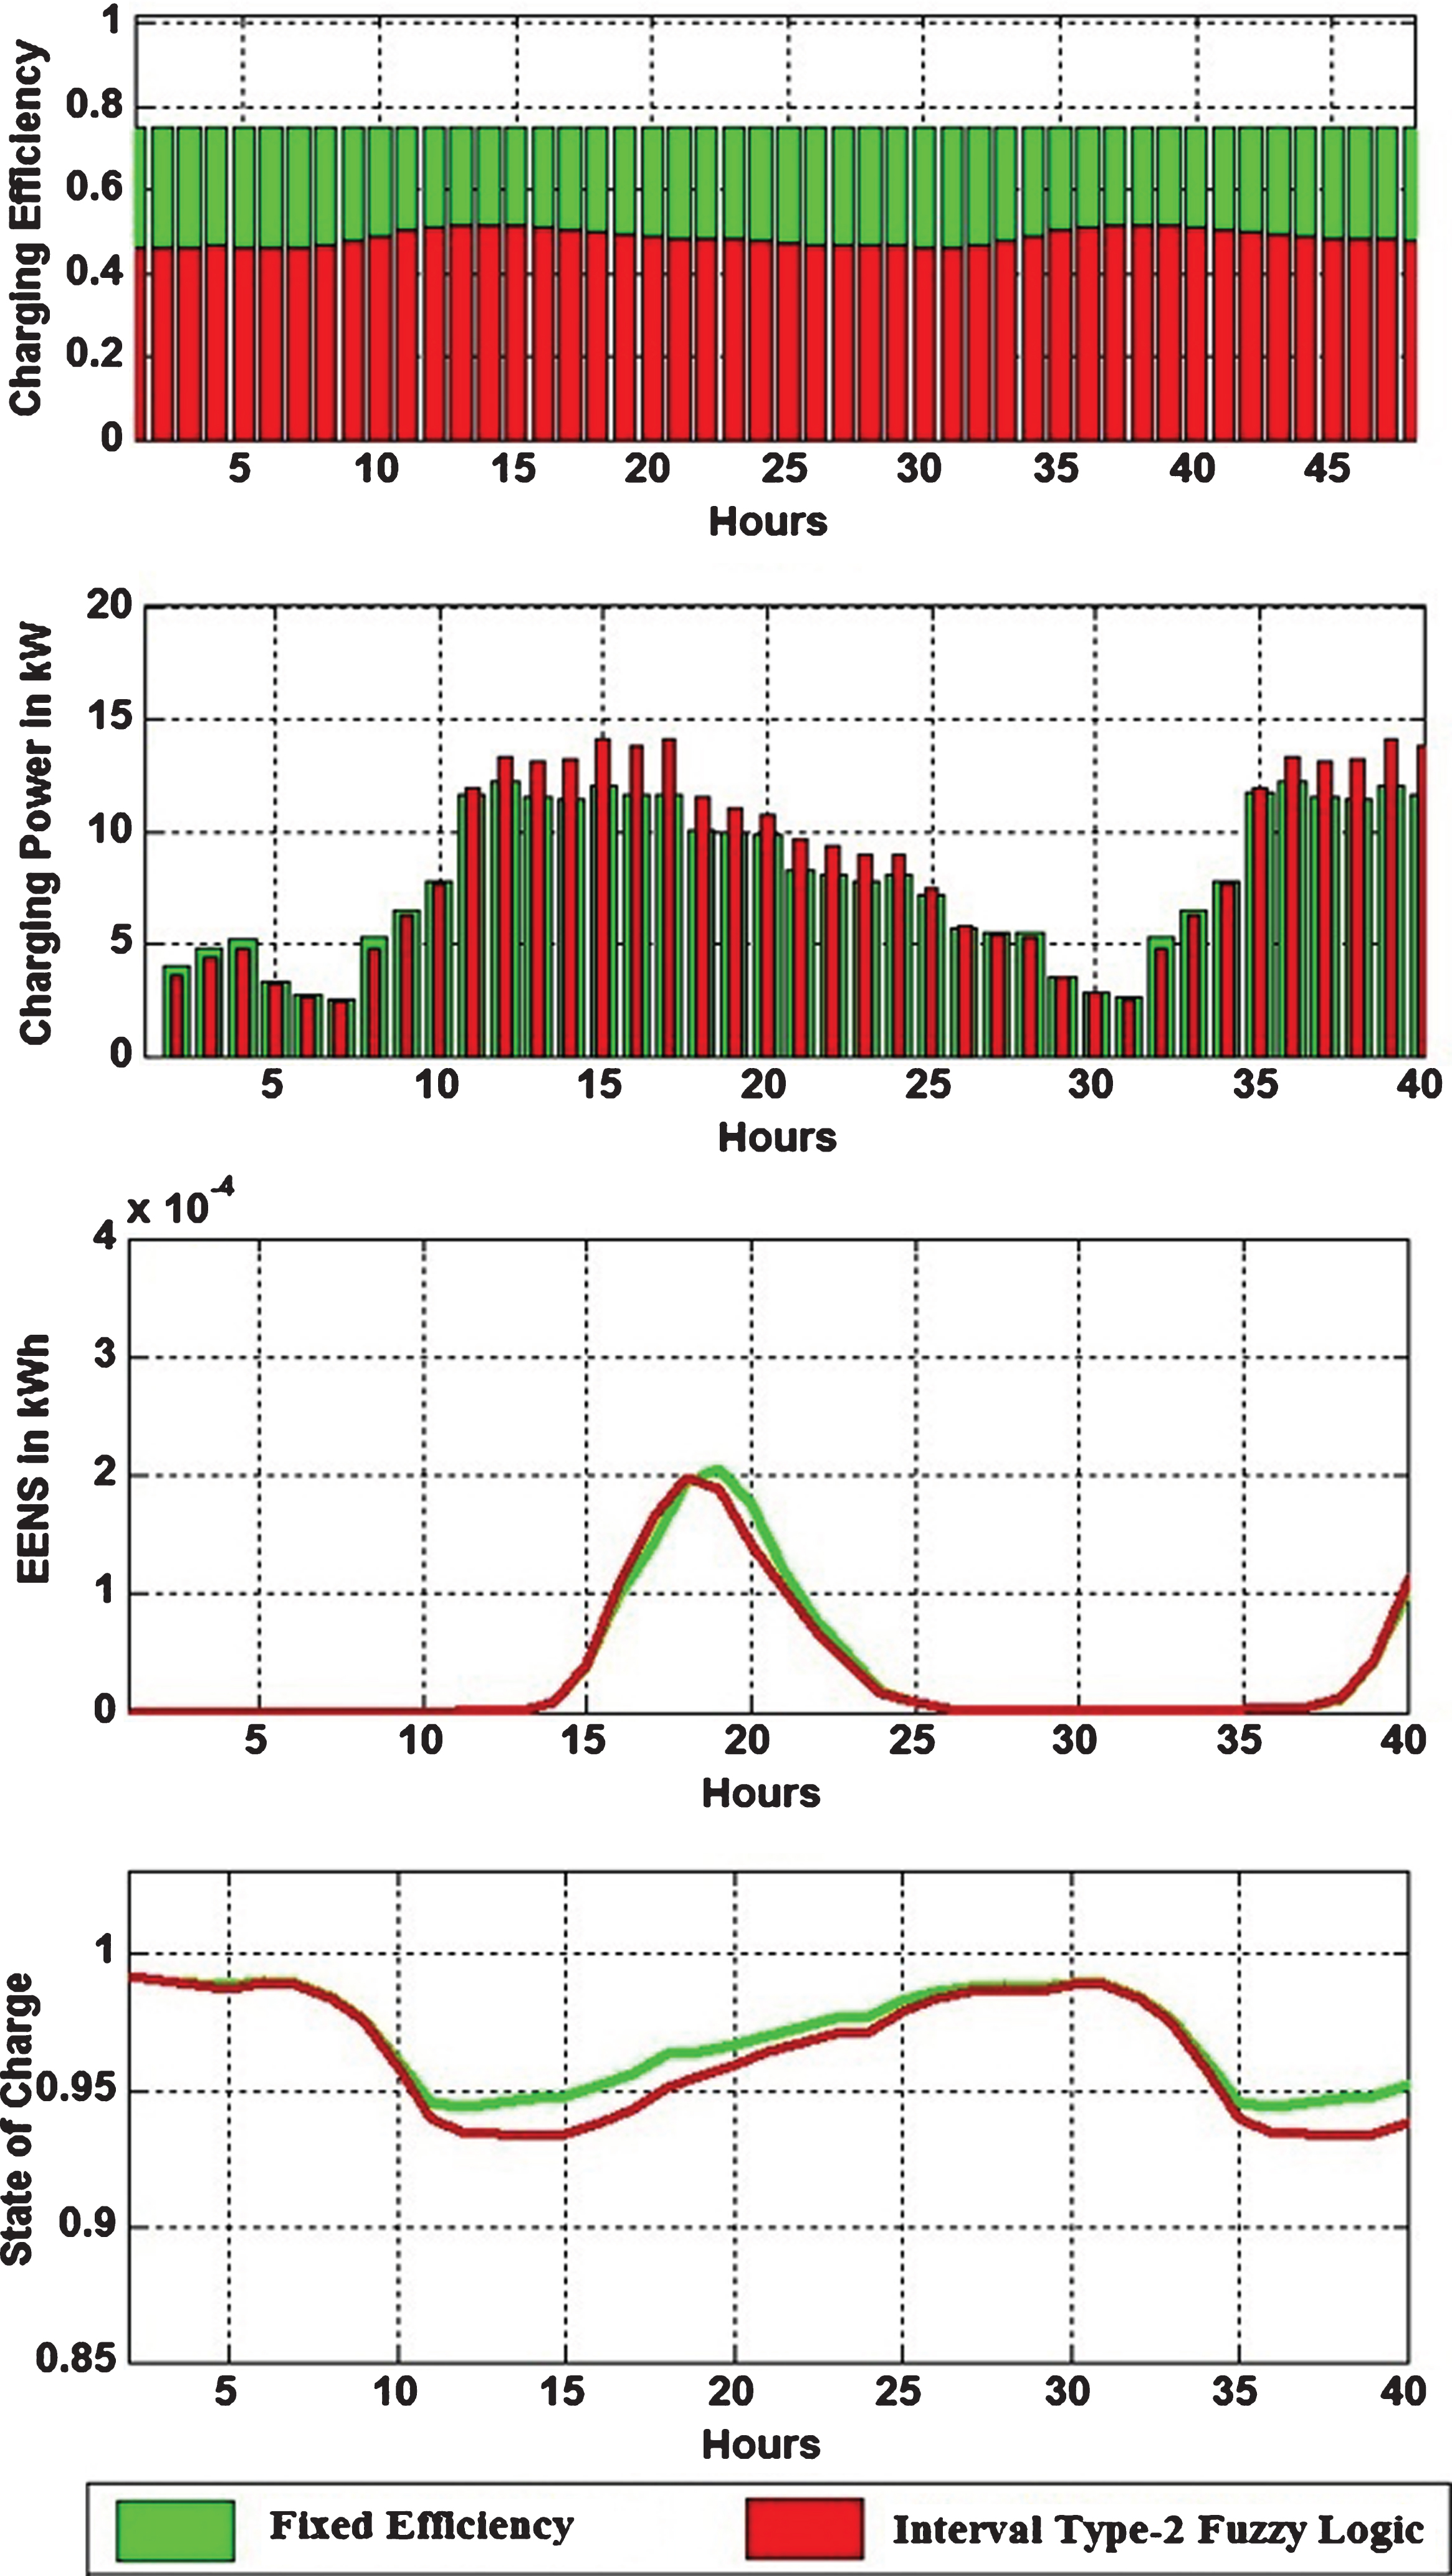
Effect of CE on parameters through IT-2 fuzzy logic for case 1 pertaining to WT unit and storage.
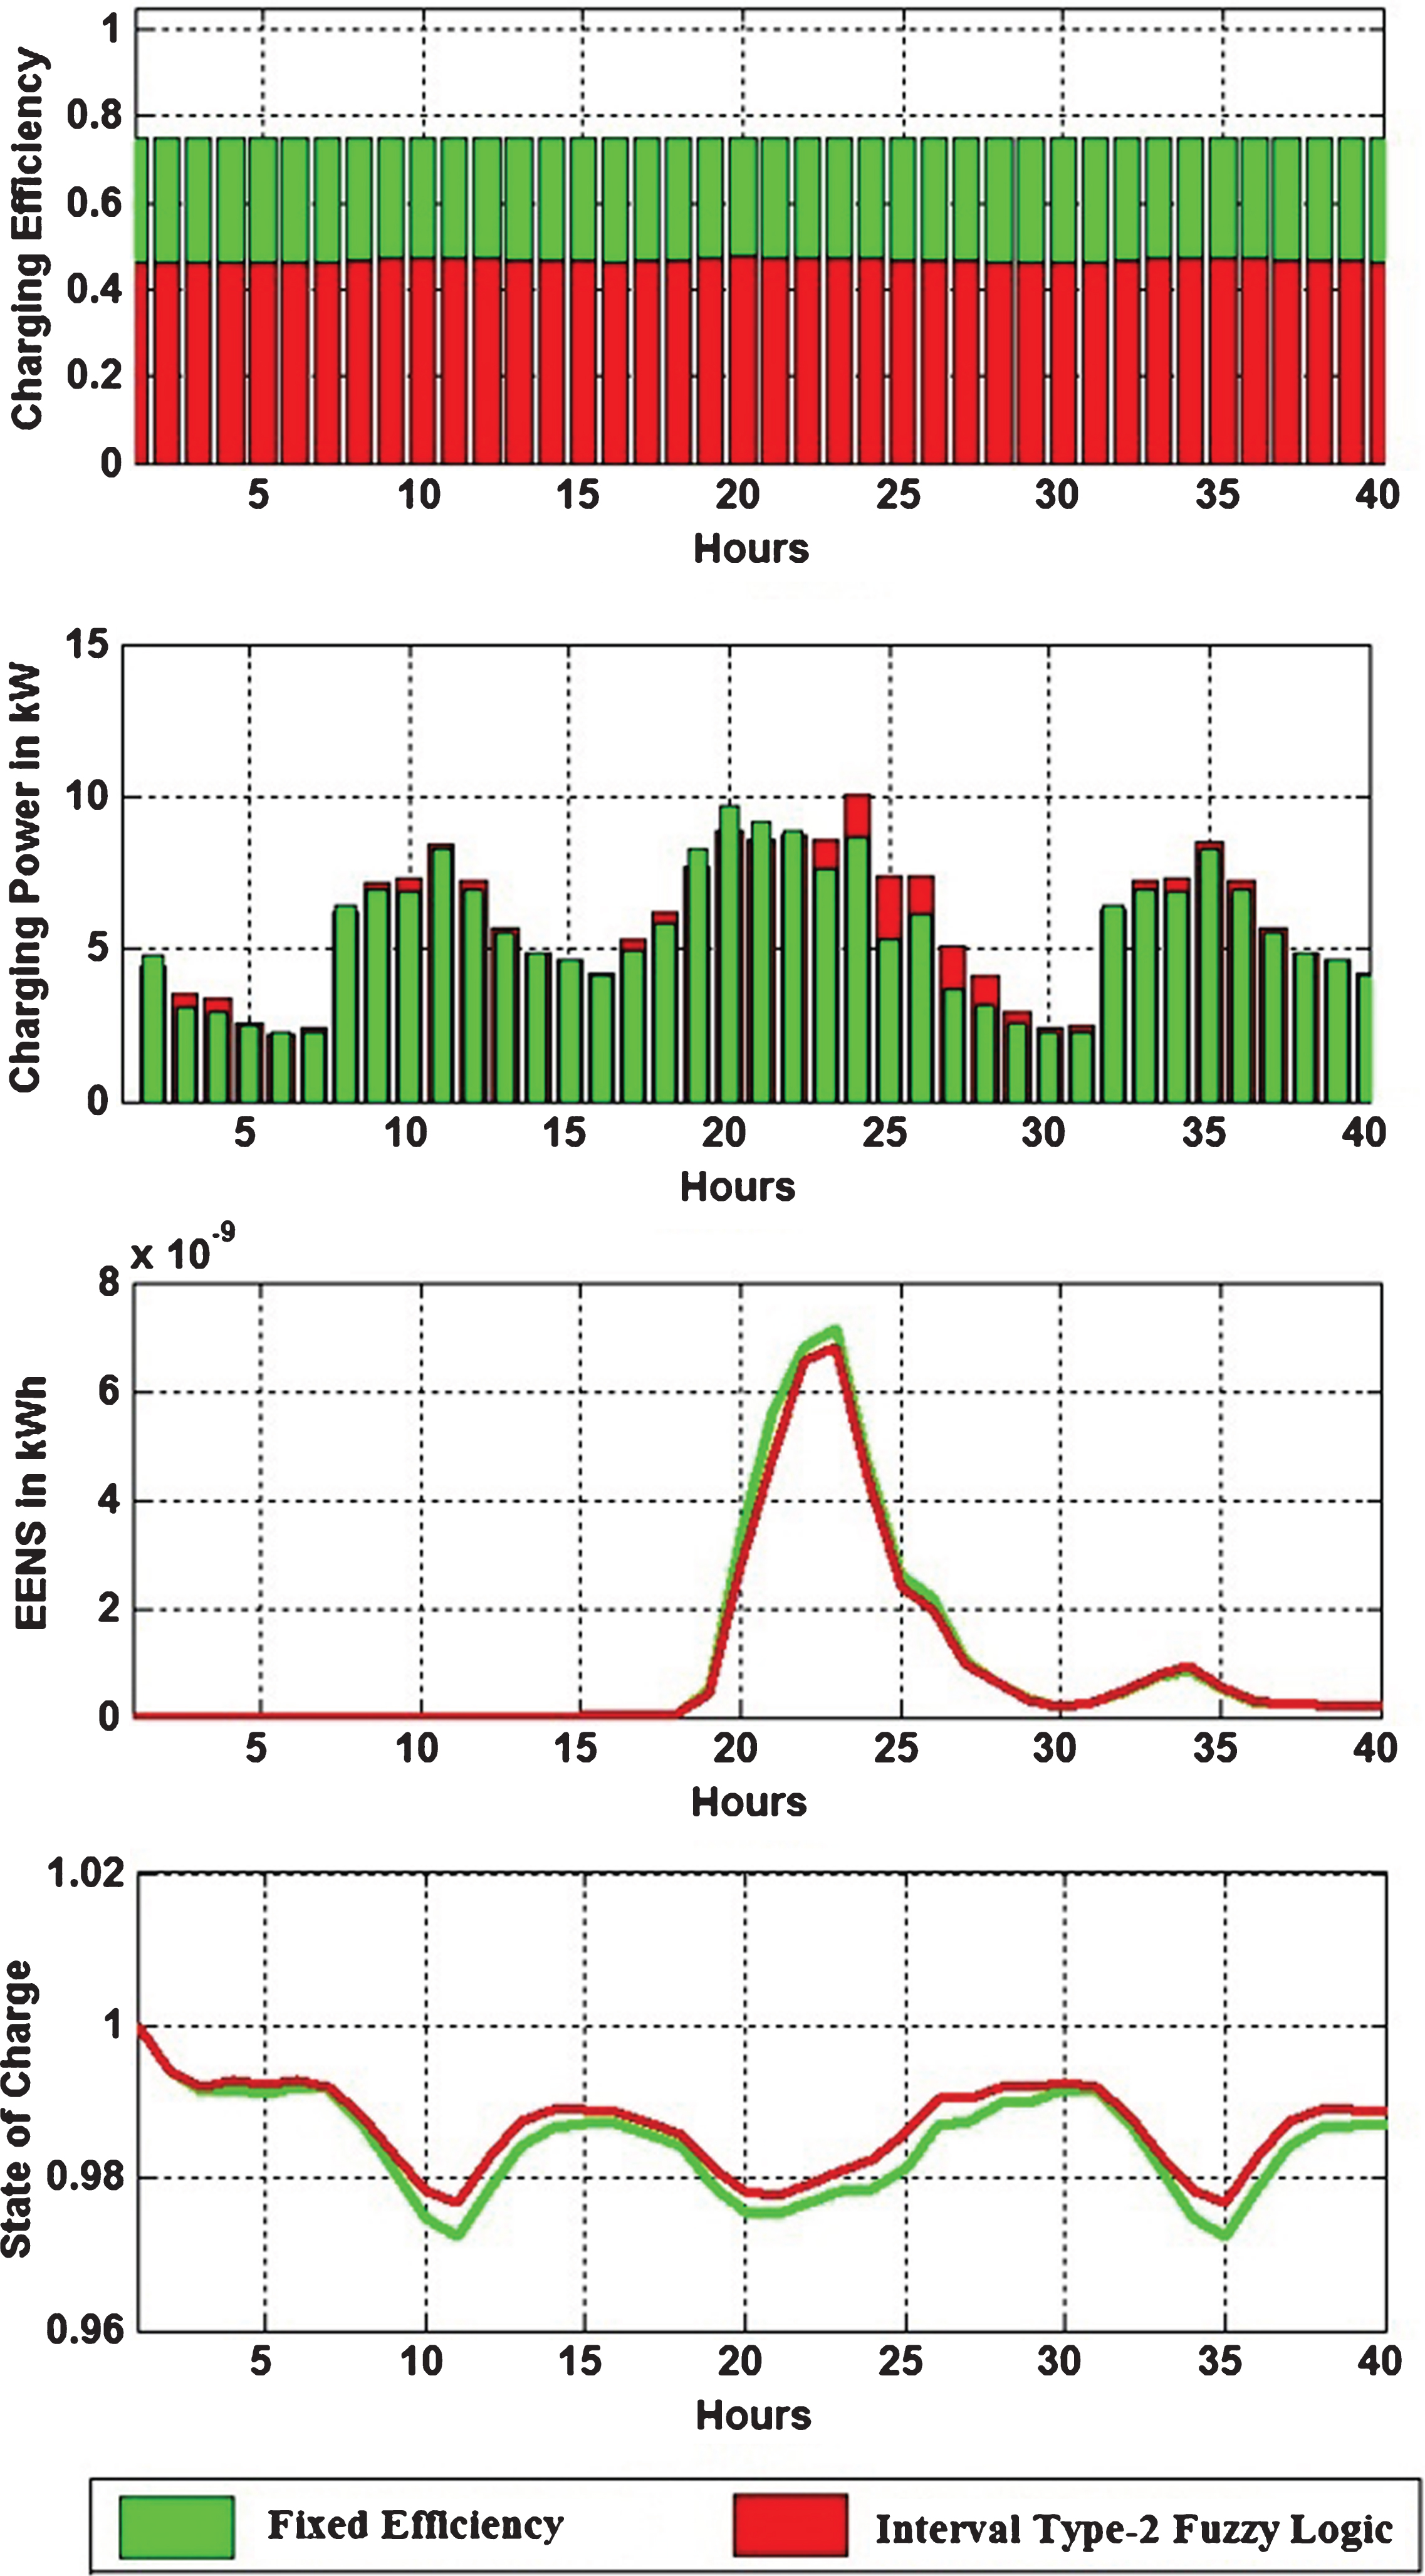
Effect of CE on parameters through IT-2 fuzzy logic for case 1 pertaining to Solar, WT unit and storage.
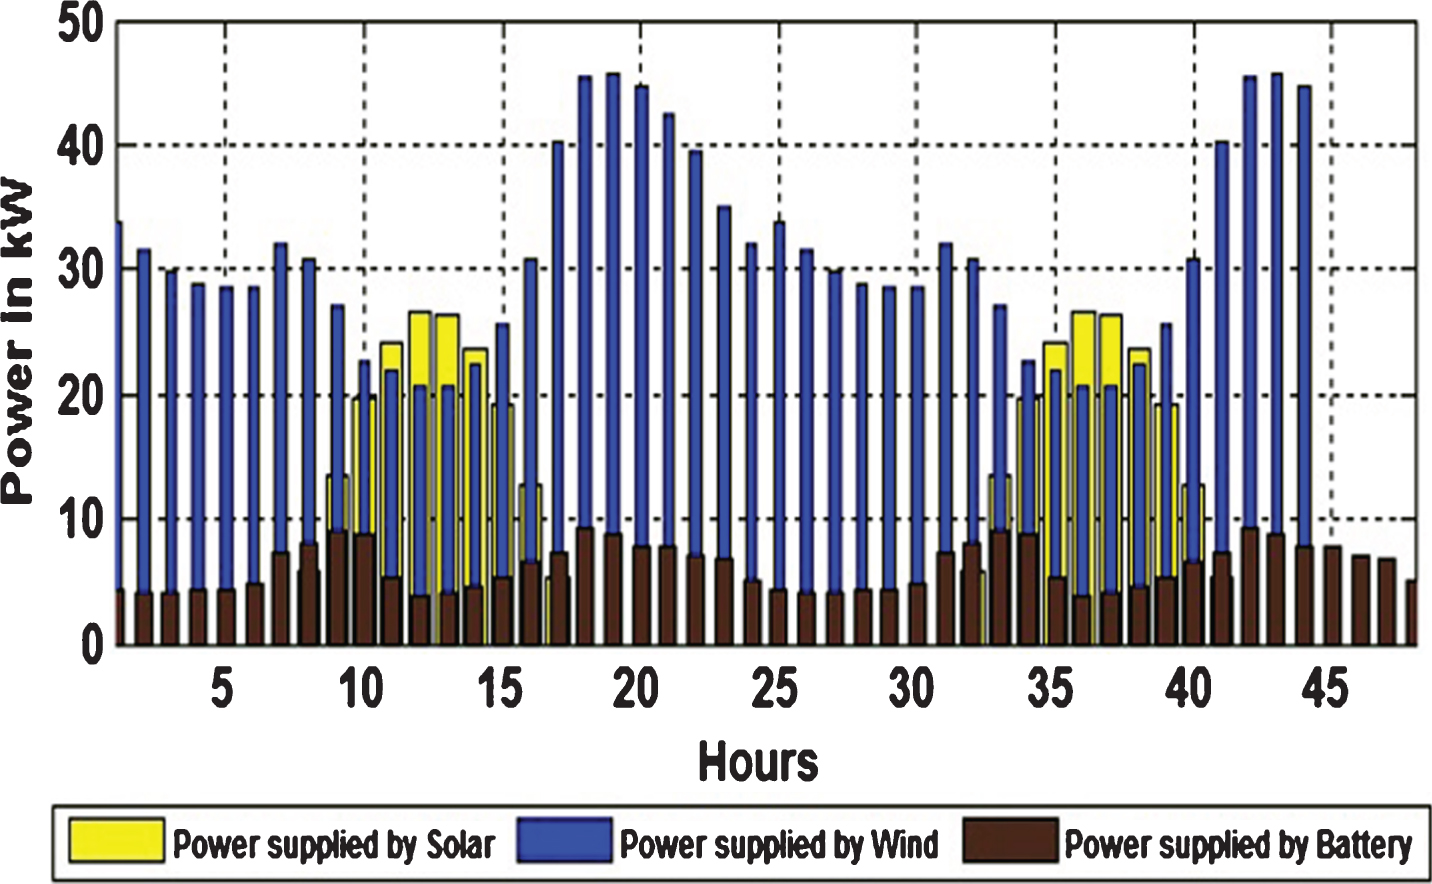
Distribution of power supplied by case 1 pertaining to Solar, WT and Storage.
Electrical energy storage using batteries can bridge the gap between intermitted renewable resources and load by supplying power during unavailability as well as storing the excess power during a period of excessive wind speed and solar irradiance. Power supplied to or from the battery is a function of SOC. Based on literature review it is found that for autonomous power system planning studies, CE of battery is assumed to be constant but it is investigated that with the higher value of SOC, CE is no longer constant. In this work CE of battery related to SOC is determined by using IT-2 fuzzy logic model and the reliability analysis is carried out for proposed groups (solar storage, wind storage, solar-wind storage system). The reliability indices obtained are compared with the constant CE of the battery. It is observed that assumption of the constant value of battery CE can lead to an inappropriate result. The efficiency determination from the battery SOC using IT2 fuzzy logic model is giving much better results than assuming the CE at constant value. The proposed model can be further used for grid connected system up to MW level.