
Abstract
There are various kinds of common natural disasters, including flood, drought, typhoon, geological disaster, forest fire and major biological disaster. Natural disaster is an abnormal event in the evolution of geographical environment, but it has become one of the most important natural factors hindering the development of human society. With the economic development and population expansion of human beings, water resource shortage is becoming more and more serious, so drought has always been a major natural disaster faced by mankind. This paper studies the GIS-based risk assessment and regionalization of Taihang Mountain drought and flood disasters. In the process of regional environmental quality assessment, GIS technology is used to conduct an objective and comprehensive evaluation of the environmental quality of the whole region. This paper then constructs the combination of GIS technology and QUEST algorithm. Based on the decision tree model of Taihang Mountain drought disaster risk assessment, the risk of drought disaster in Taihang Mountain is evaluated. The results show that the distribution of drought disaster in Taihang Mountains is similar to that of drought disaster risk. The risk of drought disaster mainly distributes in the middle and west of Taihang Mountains. The risk in the east of Taihang Mountains is the lowest. The risk in the west of Taihang Mountains increases gradually. Generally speaking, the drought resistance of southern Taihang Mountains is higher than that of northern Taihang Mountains.
Introduction
Global climate change has been remarkable for nearly a century, with droughts and floods coexisting, and meteorological disasters are frequent. Among them, drought disasters are a kind of disasters in meteorological disasters with wide range of influence, long duration and serious losses. According to statistics, the damage caused by the drought in China accounts for 59.3% of the losses caused by all meteorological disasters, and the average annual drought area is over 200,000 km2. Drought not only affects the nutrient intake and growth of plants, but also affects the atmospheric environment and ecological environment, resulting in reduced crop yields and increased pests and diseases. Affected by drought, large-scale pests occurred in Inner Mongolia pastures and dry areas in Tibet. Drought also affects commercial fishing and the social, economic and political life of people.
The drought that has been going on for many years from 2009 to 2014 has made it difficult to grow of Millet and corn in Taihang Mountain, affecting the growth of fruit trees, and the safety of people drinking water, which has brought great inconvenience to people’s lives. The loss of drought in Taihang Mountain is affecting the economic market in various places, which has a significant impact on the Grain crops and economic crops in China, and the frequency of drought is high. After entering the 21st century, precipitation in the Taihang Mountains is reduced, and high-temperature and drought events have increased, from one to three years, once in one to two years. The drought has affected local agricultural production, restricted regional economic development, and the drought situation has become increasingly severe. How to accurately monitor drought and formulate effective drought relief measures; how to predict drought and its disaster risk development and change, to reduce disaster losses, reduce or even avoid casualties, has become an urgent problem in the current drought relief and disaster relief. GIS technology (Geographic Information Systems) is a cross-product of multidisciplinary research. It uses geo-model analysis to provide a variety of spatial and dynamic geographic information in real time. It is a kind of geography research and Computer technology system for geographic decision making services. Its basic function is to convert tabular data (whether it comes from a database, spreadsheet file or directly into the program) into a geographic graphic display, then browse, manipulate and analyze the displayed results. It can range from intercontinental maps to very detailed block maps, with real-world objects including demographics, sales, transportation routes and more. Therefore, this paper studies the risk assessment and zoning of the Taihang Mountain drought and water disaster by using GIS technology and risk assessment QUEST algorithm.
This paper is divided into three parts, the first part, the specific analysis of GIS technology; the second part, through the analysis and statistics of the natural environment data of Taihang Mountain in recent years, discusses the current situation of drought and water shortage in Taihang Mountain; In the third part, combined with the characteristics of GIS technology, the QUEST algorithm is used to construct the decision tree risk. The evaluation model is used to evaluate the drought and water shortage risk in Taihang Mountain.
Related work
There are many factors involved in the risk assessment of natural hazards, and each factor has a certain degree of fuzziness, which makes it difficult to classify and express with accurate quantitative relationship. However, things are generally related. They are clustered because of their commonness and differ from each other because of their individuality. “Fuzzy relation” expresses the connection between things in a profound sense, and classifies the research objects by establishing fuzzy similarity relation, which is called fuzzy clustering analysis. This method has been widely used in the prediction and evaluation of geological hazards, and has achieved certain social and economic benefits, such as Wang L P et al. in the long reservoir. Fuzzy cluster analysis (Wang L P et al. 2017) [1] is used in the prediction of seasonal runoff. On the research of cloud fuzzy clustering algorithm, Jiaonan H E et al. pointed out that fuzzy clustering analysis method is a soft partition method. By constructing the similarity relationship between two bodies, different clustering results can be divided according to different similarities. It has the characteristics of “either one or the other”, and can form a dynamic clustering effect (Jiaonan H E et al. 2016) [2]. Xin G et al. combines the demand preference of practical application in grid environment, and proposes an application preference-based fuzzy clustering selection algorithm for grid resources (Xin G et al. 2016) [3]. Zhang Z et al. proposed a heuristic task graph scheduling algorithm based on fuzzy clustering. Five resource characteristics are used to characterize the processing units of the target system. On this basis, the grid resources in heterogeneous environments are clustered by fuzzy clustering (Zhang Z et al. 2016) [4]. For large-scale, distributed, autonomous, heterogeneous and dynamic grid computing environments, Yuxia X U et al. proposed a heuristic grid fuzzy clustering resource allocation algorithm that can describe the preferences of user applications. It realizes reasonable pre-classified resources, chooses according to user preferences, and maximizes user’s target utility (Yuxia X U. 2017) [5]. According to the heterogeneous and diverse characteristics of service resources in grid environment, Liao C G et al. proposed a multi-dimensional grid resource-oriented fuzzy clustering task scheduling algorithm based on small world theory, which improved the matching efficiency and scheduling performance of resources and tasks (Liao C G et al. 2017) [6]. In order to improve resource utilization and fast response to real-time tasks in complex hardware and software systems, Yang Z et al. proposed a resource clustering scheduling algorithm based on fuzzy equivalence matrix, which divided resources into three types of tasks: read/write memory task, CPU computing task and I/O task (Yang Z et al. 2017) [7]. Zhang Q et al. proposed a new grid resource allocation algorithm based on hybrid clustering of resources and tasks, which skillfully coordinates the appropriate resources to fully meet the needs of tasks, and effectively foresees the resource requirements of current and future tasks, and avoids the abuse or unreasonable allocation of resources (Zhang Q D et al. 2016) [8]. Qian L et al. introduced clustering theory into cloud resource partitioning and task scheduling in cloud computing environment, which provided a useful reference for solving large-scale resource classification and task scheduling problems in cloud environment (Qian L et al. 2016) [9]. Chen F. et al. proposed a cluster resource fuzzy clustering partition model (Chen F et al. 2016) [10], which is suitable for cloud computing. Ming T et al. proposed a two-level task scheduling algorithm FCTLBS based on fuzzy C-means clustering method in cloud computing environment (Ming T et al. 2018) [11]. By clustering the resources of cloud providers and sorting them according to their performance, she D and others can be divided into three types: computing, bandwidth and storage. Then resource allocation can be carried out at the user and task levels, which guarantees higher user autonomous resource selection rights and user satisfaction, and better reflects the task requirements (She D et al. 2016) [12]. Jia H C and others use fuzzy C-means algorithm to study task migration in cloud computing task scheduling, and propose a load balancing strategy for different types of requests (Jia H C et al. 2016) [13]. Considering the heterogeneity and fuzziness of resource characteristics in cloud computing environment, Liu L N et al. proposed a workflow task scheduling algorithm based on transitive closure method for resource fuzzy clustering. By dividing resources in advance, priority was given to dividing tasks into subgroups with better comprehensive performance, which improved the scheduling performance (Liu L N et al. 2016) [14]. Hsieh H I and others combined the three algorithms of fuzzy clustering, improved genetic algorithm and improved Min-Min, and applied them from three perspectives of system platform resource division, resource combination, resource allocation and scheduling respectively. An effective resource scheduling algorithm was proposed (Hsieh H I et al. 2016) [15].
In summary, because of the fuzziness of disaster hazard risk assessment, this paper carries out natural hazard risk assessment based on cloud fuzzy clustering algorithm. Taihang Mountain is the center of severe drought disaster in China. It is urgent to monitor the drought situation of Taihang Mountain according to its comprehensive drought index system, and then carry out risk assessment and trend analysis. Therefore, this paper proposes a QUEST algorithm for risk assessment of GIS technology based on cloud fuzzy clustering. In the process of using GIS technology to assess the risk degree of related natural disasters, the risk assessment and regionalization of drought and water shortage disasters in Taihang Mountains are studied in order to promote the development of the risk assessment system of geological disasters.
Risk assessment method of geological disasters based on cloud fuzzy clustering
QUEST algorithm based on gis technology for risk assessment
With the advent of the information age and the development of the information industry, computer technology has been widely used in various scientific research fields, and gradually from a single application model to comprehensive application, remote sensing (RS) and geographic information system (GIS) meet the requirements of the times. RS and GIS are continuously integrated and mature based on the development of computer technology, artificial satellites, mapping technology, mapping technology and earth observation technology, and are widely used in land use, environmental monitoring, urban planning, resource management, transportation and other fields. In this field, remote sensing and geographic information systems are often referred to as “2S” technologies, ie RS refers to remote sensing technology and GIS refers to geographic information systems. In the process of evaluating the current environmental quality of the region, the GIS technology is used to objectively and comprehensively evaluate the environmental quality of the entire region, reflecting the pollution degree and spatial distribution of the region. The QUEST algorithm was proposed by Loh in 1997. This is a traditional decision tree algorithm, a new algorithm based on rules. The algorithm separates the choice of variables from the choice of split points. It is more suitable for continuous and discrete variables. In most cases, the values of terrestrial features are continuous variables. Therefore, it is suitable to introduce the algorithm into the extraction of land features. In the classification of land features, based on the literature of predecessors, based on the characteristics of the arid regions in the Taihang Mountains, the basic principles of the algorithm are constructed.
Above we have classified and marked the land type and soil type to facilitate the classification of land later. The original data of this paper is collected based on the above table. The sampling process is carried out according to the random stratified sampling method of spatial coordinates. Under the reference of 1 : 50000 map in the arid area of Taihang Mountain, the SPOT-5 image is sampled, and a total of 3000 is selected. Samples of pixels, the specific classification is shown below. Then the spectral features, texture features and geologic features of the samples were extracted, and the QUEST decision tree was constructed by SPSS12.0, and machine learning was carried out. In this paper, we choose the predictor and analyze the correlation between the forecast and the target variable. If the variable is discrete, we need to test the strength of the correlation between the two, and then find the P value of the classification probability. If the variable is continuous, then Calculate the classification probability P value directly. Then, the threshold of the variable is set, the coordinates of the discrimination are calculated, and the classification is simplified. The simplified classification is further determined by the position of the segmentation point, and the rules of the classification are constructed.
Traditional remote sensing images, due to the limited spatial resolution, have poor performance for texture features. Therefore, the classification of features based on remote sensing images is based on spectral features. The existence of homologous and foreign matter is the same. Classification accuracy is limited and it is difficult to meet practical application requirements. In this study, 8 features such as mean, variance, uniformity, contrast, dissimilarity, information entropy, second-order matrix and correlation were selected to calculate the texture features of remote sensing images. The calculation and description of each texture feature used is as follows: The mean value can be calculated by the following formula:
N is the gray level of the remote sensing image. The mean feature can reflect the gray level uniformity in the texture window. The more regular the image texture is, the larger the mean value is. The variance can be found by the following formula:
The texture feature variance is a measure of the heterogeneous region of the image, similar to the concept of variance in the grayscale statistical feature, and describes the degree of deviation from the overall mean of the sample. The smaller the image variance, the darker the variance feature image; the larger the variance, the brighter it is. The bright lines on this feature are mostly the edges of the image in the remote sensing image. Synergy can be found by the following formula:
Synergy can be used to reflect local homogeneity of images. The larger the gray level difference of the image, the smaller the synergy value is, and the darker area is represented on the feature image; the smaller the image difference is, the larger the synergy value is, the larger the synergy value is, and the brighter area is represented on the characteristic band.
Contrast can reflect the sharpness of the image and the depth of the texture. It is the moment of inertia near the main diagonal of the gray level co-occurrence matrix. It can measure how the value of the matrix is distributed and the local changes in the image. The deeper the texture groove is, the more the contrast value is, the clearer the effect is; the shallower the texture groove is, the smaller the contrast value is, the more blurred the effect is.
Dissimilarity reflects the magnitude of the difference in gray values between adjacent pixels. The smaller the difference of gray value of remote sensing image, the smaller the value of dissimilarity; the larger the difference of gray value, the larger the value of dissimilarity.
Information entropy can represent the randomness of remote sensing image texture. It is mainly used to describe the disorder of remote sensing image in texture analysis. When the image contains more types of features or the image texture is more messy, the grayscale distribution in the image is very random, and the value of information entropy is larger.
According to the characteristics of the risk of geological hazard emergencies, this paper establishes a fuzzy clustering evaluation algorithm model for the data stream of the severity of geological hazard emergencies. Firstly, it is assumed that there are n samples for risk severity assessment of geological disaster emergencies, each of which contains M eigenvalues of indicators:
Each sample x
ij
contains M eigenvalues, set 3 = M. According to the theory of fuzzy set optimization, it is necessary to normalize the values of each sample index in sample matrix X = (x
ij
). The normalized eigenvalue matrix of the index is as follows:
Among them, r
ij
is the normalized number of index eigenvalues, 0 ⩽ r
ij
⩽ 1. Let u
hj
denote the relative membership degree of sample J under category h, H = 1, 2, L, c; J = 1, 2, L, n. The n samples are clustered into C categories according to m indices, and the fuzzy clustering matrix U = (u
hj
) is obtained, where u
hj
satisfies the following conditions:
Assuming that the normalized eigenvalues of M indices of category h are the clustering centers of category h, then the clustering centers of C categories can be expressed by the m × c-order fuzzy clustering center matrix S = (s
ih
). s
ih
is the normalized number of clustering centers of category h indices i, 0 ⩽ s
ih
⩽ 1, I = 1, 2, L, m; H = 1, 2, L, C. In this paper, the difference between sample J and category h is calculated by generalized Euclidean distance
Let F (u
hj
, s
ih
, w
i
) be the function of u
hj
and s
ih
, w
i
. If we want to achieve better clustering effect, sample J should be closer to category h, and the value of F (u
hj
, s
ih
, w
i
) function should be smaller. The objective function J is:
That is, to minimize the sum of weighted generalized Euclidean weighted distances for all categories in the sample set of risk severity assessment of geological hazards. Under the condition that the constraints (9) and (10) are satisfied, the data point weight vector DW, cluster weight vector CW, index weight vector W, fuzzy membership matrix U and fuzzy clustering center matrix S are obtained by using Lagrange function algorithm.
In formula λ is the attenuation factor and t0 is the time when the data point arrives. The weight of the most recently arrived data points is 1. By adding a weight that decays with time to each data, the impact of historical data is reduced. The larger the value, the faster the old data decays, and the smaller the impact on the formation of the final cluster.
Experimental design
The use of remote sensing data in the monitoring of drought is conducive to the real-time monitoring of drought, while the ground measured data has the characteristics of high precision. Combining these two kinds of data for drought monitoring can make good use of the advantages of these two kinds of data to achieve high precision and real-time drought monitoring. It is verified by experiments that TVDI can be well applied to Taihang Mountain drought monitoring, and its monitoring results are consistent with the actual drought distribution of Taihang Mountain. NDDI can respond quickly to changes in surface moisture and can be used to invert drought. After combining these two remote sensing drought monitoring methods, the measured temperature and precipitation data are further supplemented by the accuracy of drought monitoring. The drought monitoring method for long-term precipitation is selected, the effective precipitation drought index (WAP), and Widely used in China, the long-term temperature data and precipitation data are combined to calculate the relative humidity, and these indicators are used to construct a comprehensive drought monitoring model for Taihang Mountain. According to the statistical values of different geographical spectral characteristics, through the human-computer interaction method of trial and error, the visual judgment method is used to select the best empirical value as the threshold of each node of the decision tree. For distinguishing between vegetation and non-vegetation types, the normalized vegetation index NDVI of each pixel in the winter and summer images of the study area is obtained by using the band calculation. By contrast, the qualification conditions can be set, that is, TM3 < 50, TM4 < in the winter image. 61. At the same time, TM3 < 57, TM4 < 66 is required in summer images. Next, we use the QUEST algorithm to train the training sample data (multi-spectral data and selected texture combination data of the best texture scale) to generate a decision tree, as shown in Fig. 1.
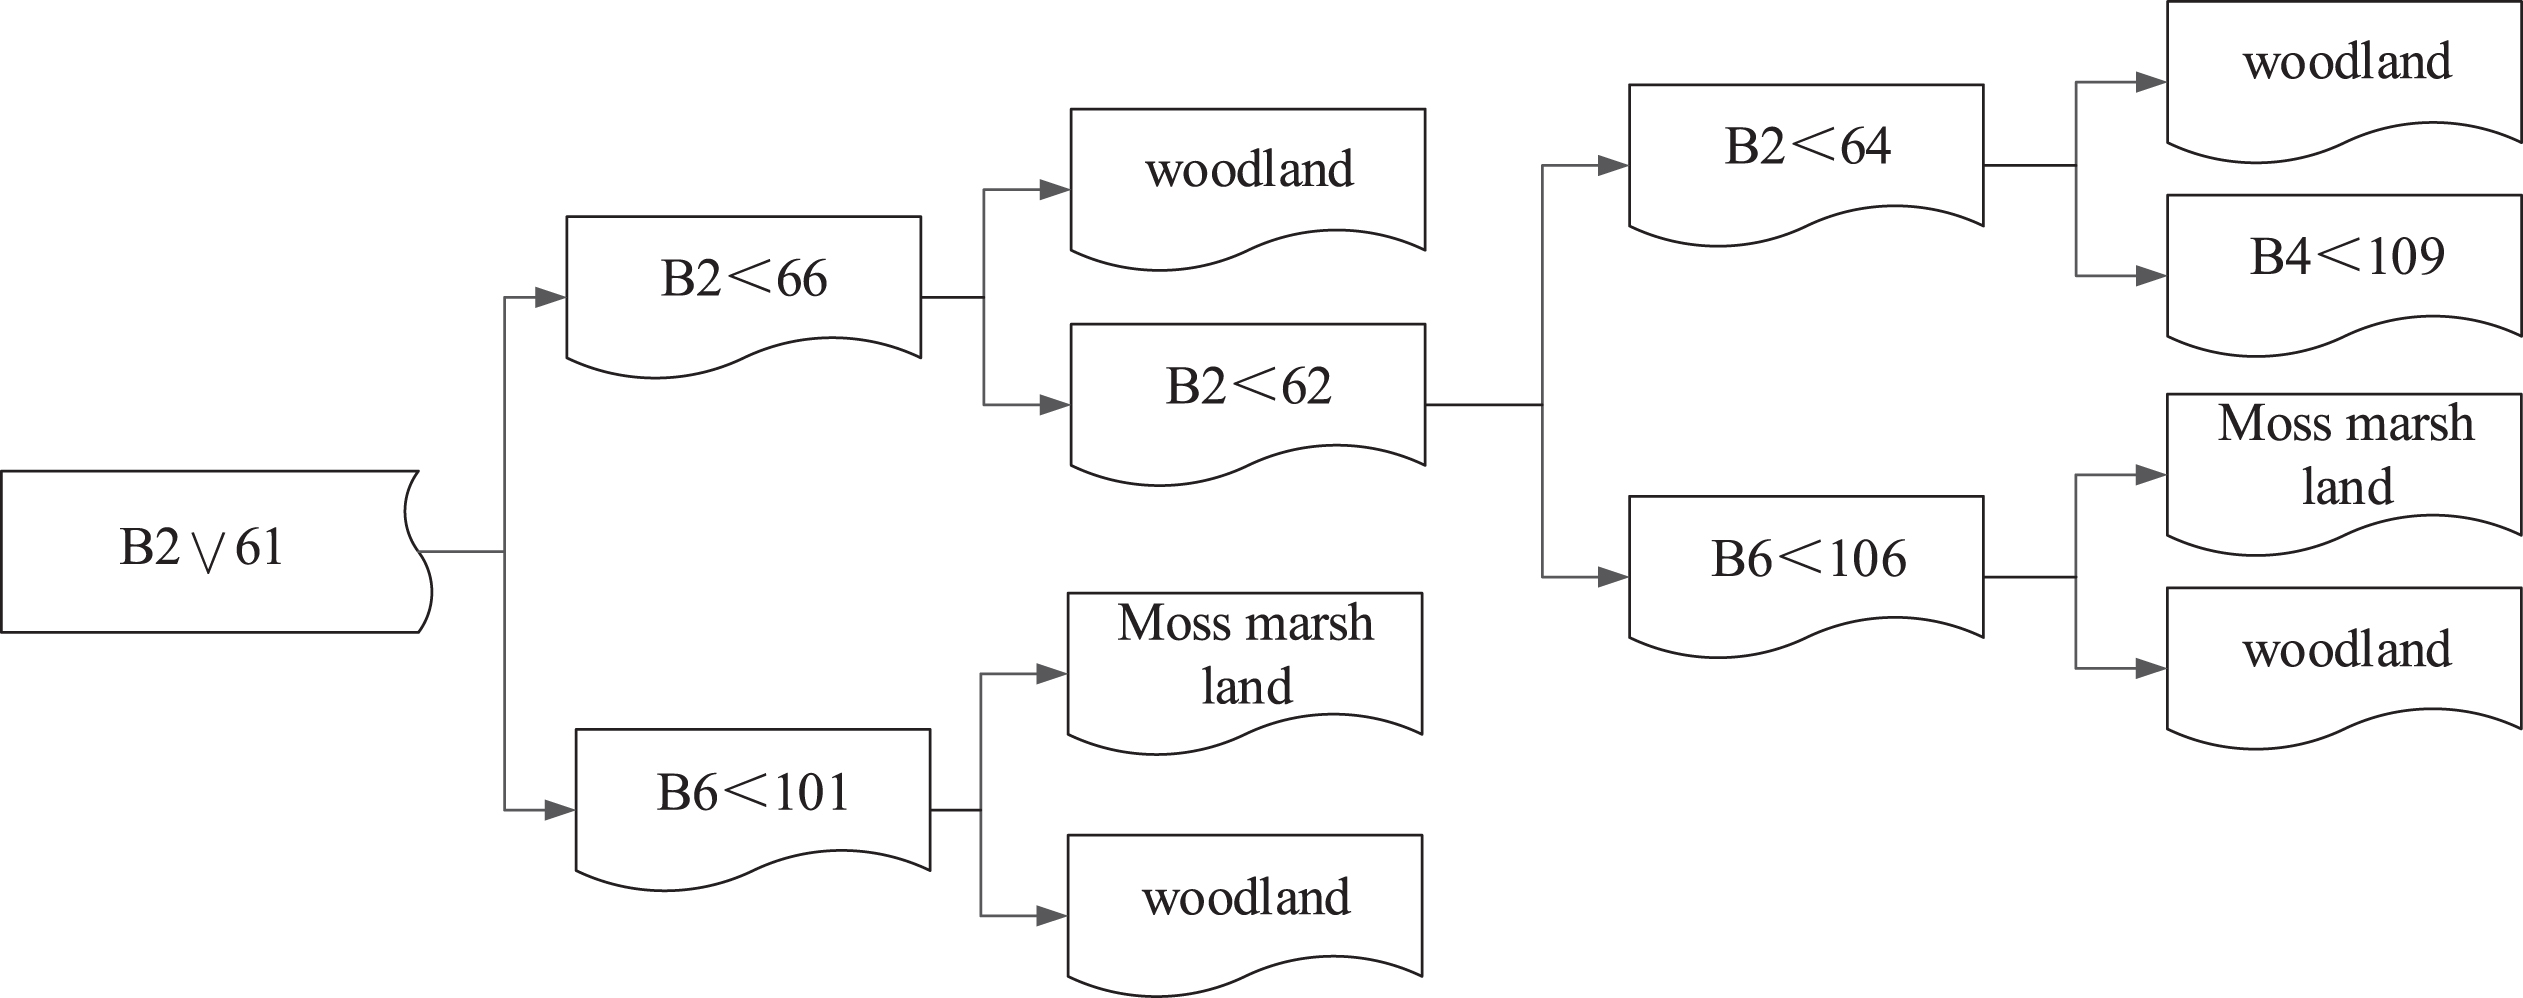
Land Coverage Classification Based Texture by QUEST Decision Tree.
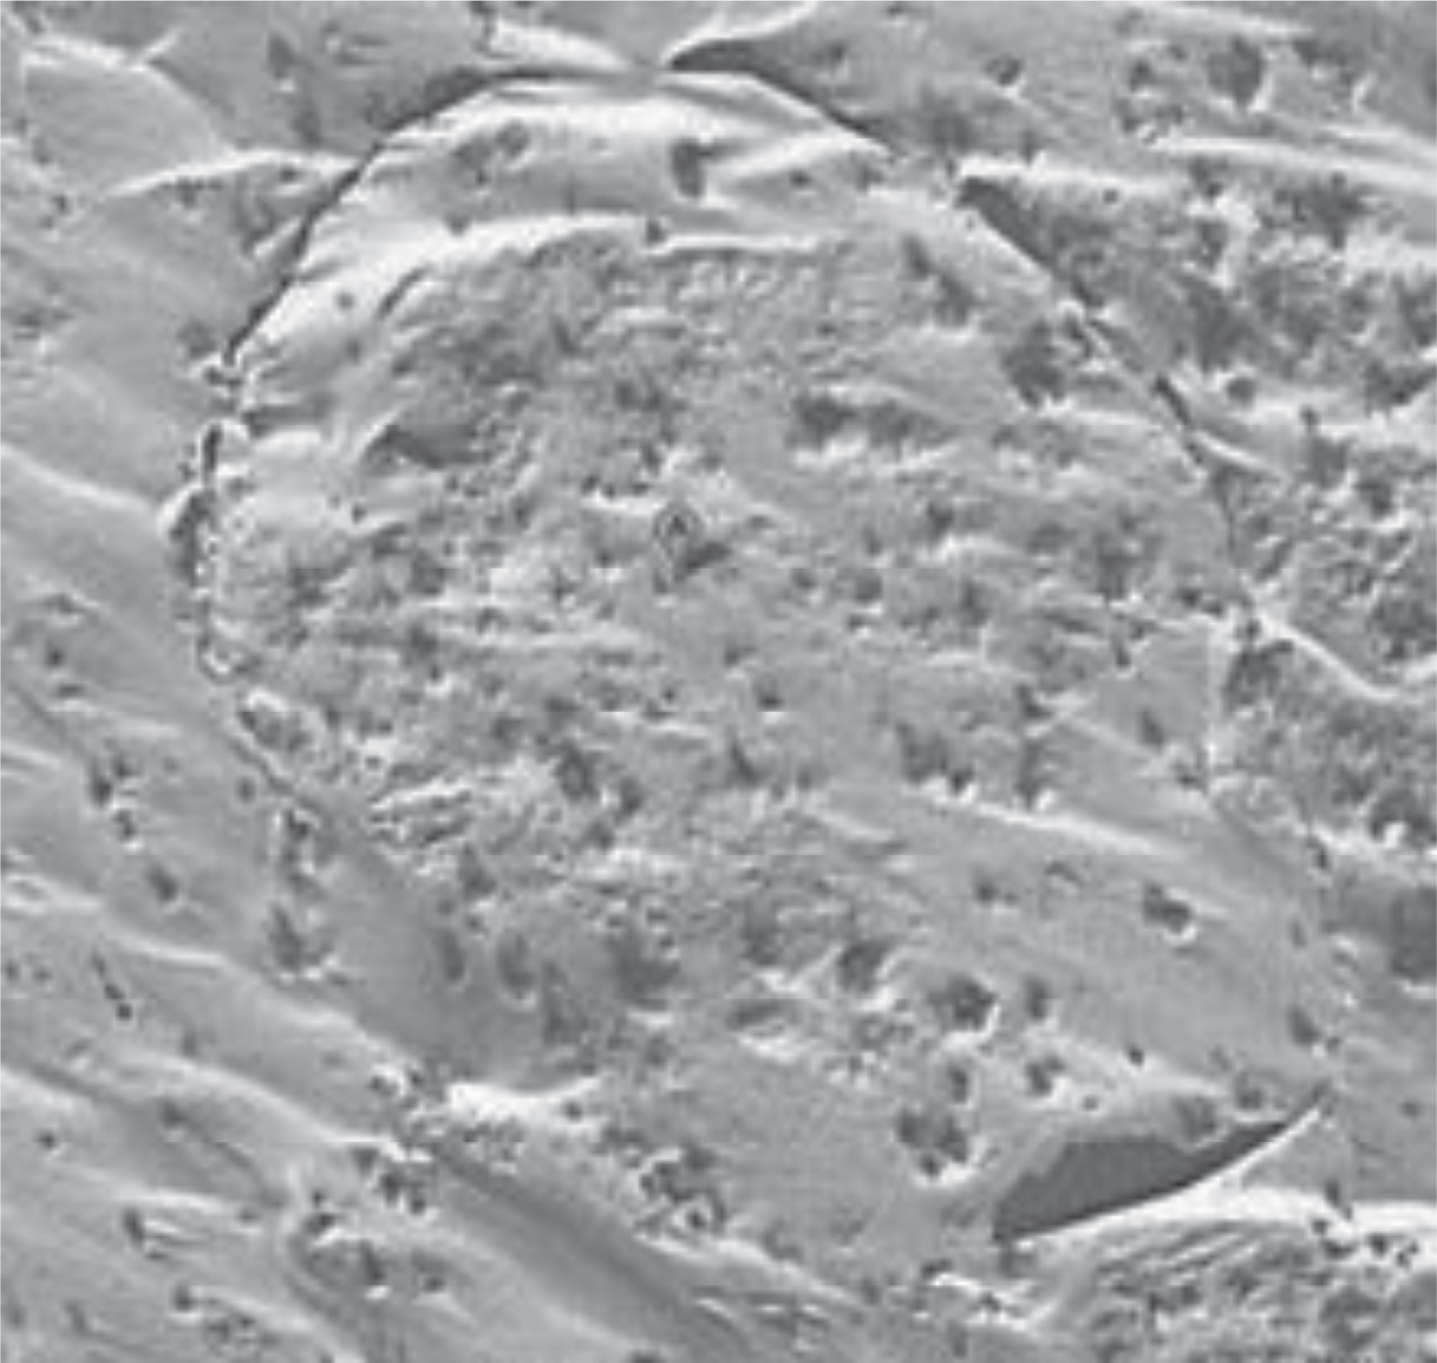
The above decision tree model is run to obtain preliminary classification results of SPOT-5 images; then, post-classification processing is performed by using re-encoding, clustering and removal analysis. Get a classification map of the dry area of the study area (Fig. 2). In this paper, we use random sampling method, reference resolution fusion image data and combined with fusion image field investigation, select 30 sample points for each land type, a total of 150 samples are selected, and the accuracy evaluation is shown in the figure. In order to effectively test the above geospatial map acquisition algorithm, we compare it with the algorithm in the literature. In addition, as described in the above section, when the line segment is grown until the closed polygon is formed, the number k of line segment growth has a great influence on the extraction result and efficiency of the algorithm. The k value is too large, and the line segment growth forms a lot of unnecessary graphics, which leads to the algorithm running time is too long; while the k value is too small, the line segment may not grow to form a room candidate set, resulting in a decrease in the number of algorithm extraction results.
Classification using Multiscale Texture.
We perform an analysis on the spatial unit where the algorithm extraction failed. It is known whether the algorithm extracts mainly originate from complex polygons, like relatively long entities such as corridors. Combined with the discussion in the previous section, the spatial unit of a complex polygon area is in the application, and it is generally necessary to divide it into a number of smaller convex polygons, that is, even if the complex unit space in which this part of the extraction fails is correctly recognized, the latter is still correct. Its implementation is divided. Individuals who fail to extract this part can take a correction system and divide the system implementation subdivision.
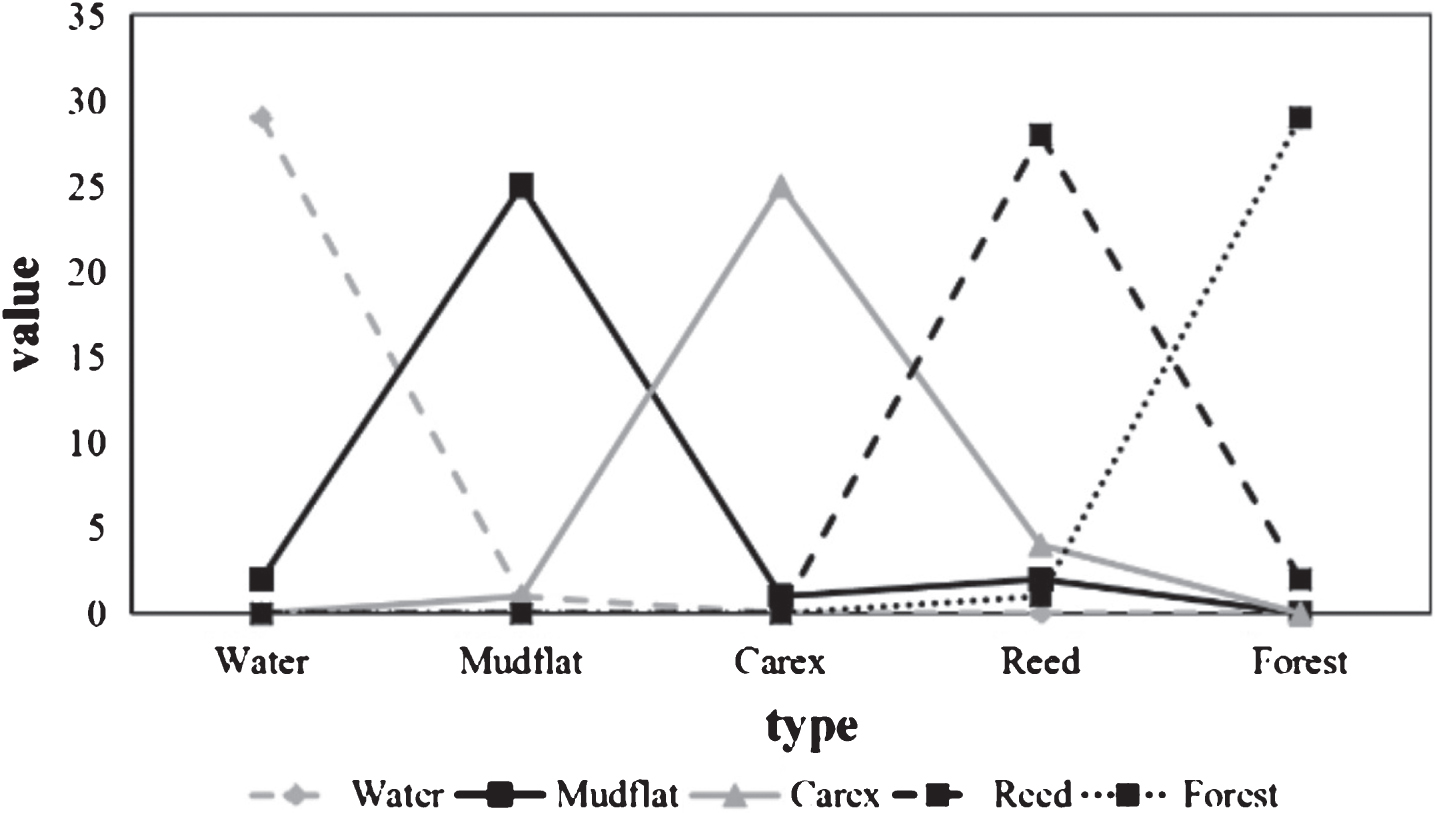
It can be seen from Figs. 2 and 3 that the various types of ground objects are basically plaque-like and less broken. Among them, the classification effect of water body, woodland and brown earth is the best, and the accuracy of users is more than 90%. Producers of mudflats and mossy beaches have the lowest precision, and the former is easily confused with water bodies and pest soil, which are easily confused with brown earth. Among them, the classification of water and forest land is the best, and the accuracy of users is more than 90%. The producers of the mossy beach land and the meadow soil land have the lowest precision. Because of the insufficient progress in the process of combining the single-scale texture information for the mossy beach land and the meadow land, the texture of the two is relatively small.
Compare the extraction number and accuracy of CSGP algorithms.
Figure 4 is the spectral information of the image. It can be seen that the classification information based on multi-spectrum, because it ignores the texture information of the feature, the overall classification accuracy is much worse than the first two, the forest classification is the best, and the user accuracy is also only 89.29% hit 90%. The producer accuracy of the reed land is only 72.97%. Comparing the results of the three classifications, it can be found that the classification accuracy of the arid area combined with multi-scale texture information is up to 78.57%, and the kappa coefficient is 0.7558, which is 1.9% higher than the single-scale texture information classification and 6.59% higher than the spectral classification result (Figs. 5 and 6).
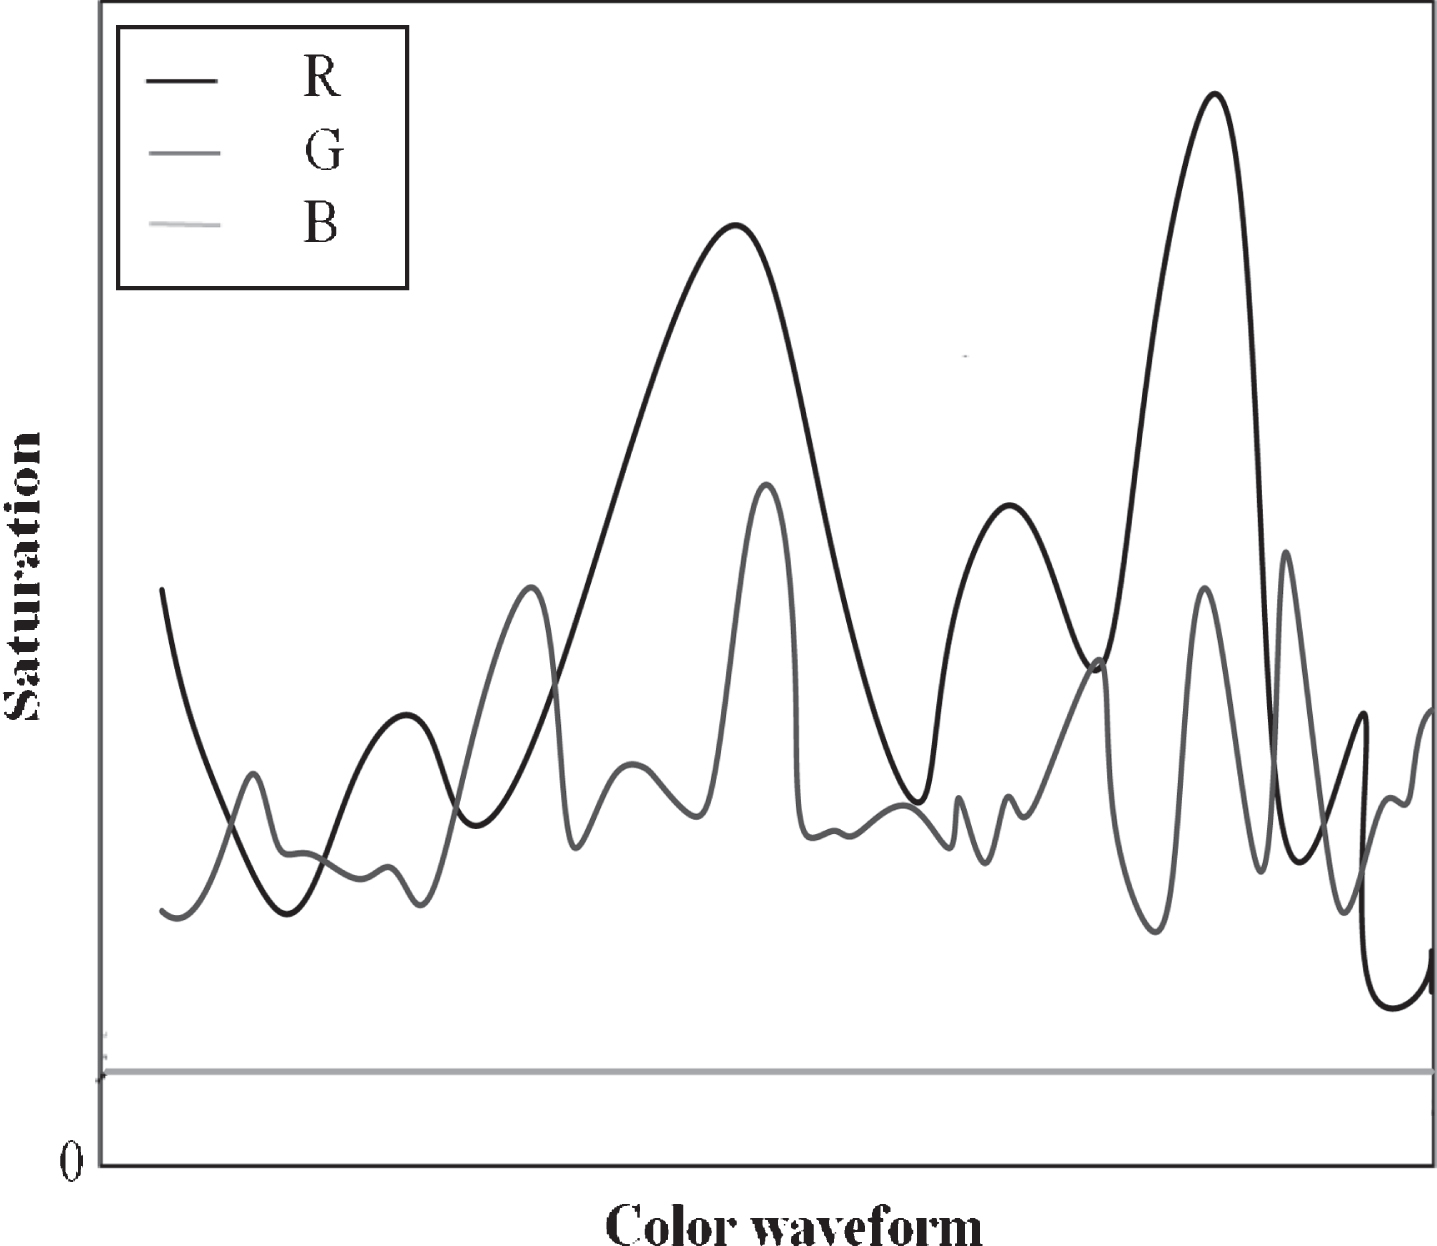
Image spectrum.
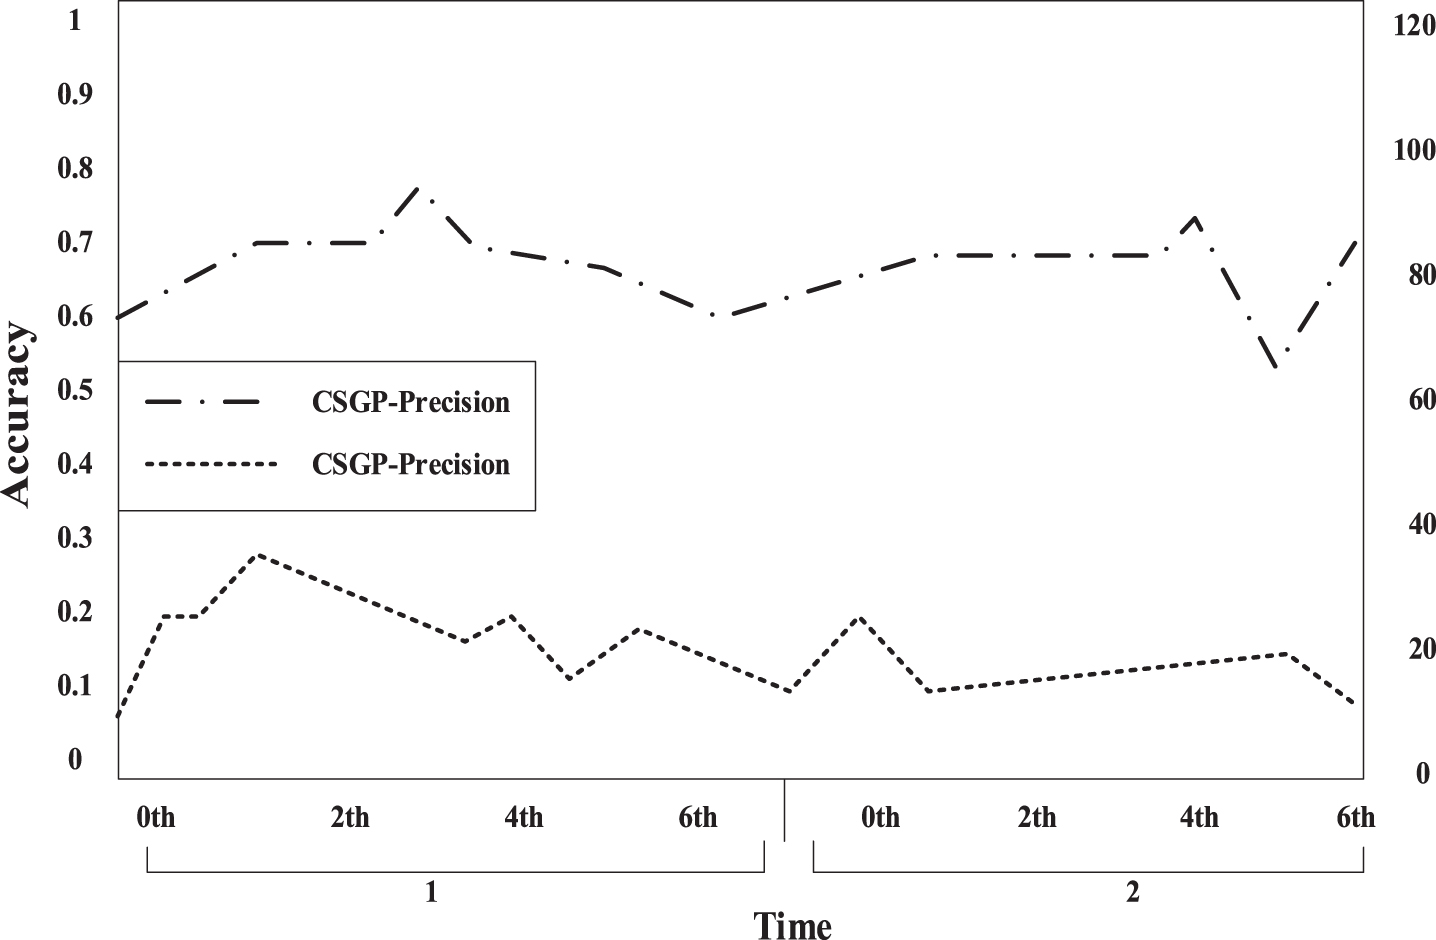
Compare the extraction number and accuracy of GLGP algorithms.
Confusion Matrix of Classification Based on DTC Combined with Multispectral.
Landforms and soil types
The number of samples and the number of pixels in the training area
According to the above comparative analysis, the decision tree classification method based on the comprehensive features such as spectrum and texture used in this study has a greater improvement than the pure spectral data in terms of single ground class precision, overall precision or kappa coefficient. Higher precision can meet the requirements for obtaining data accuracy in actual work.
With the changes in global climate and environment, the frequency of drought is increasing, and disaster losses are becoming more and more serious. Taihang Mountain is located in the mid-latitude mountains. Due to its unique geographical environment and climatic characteristics, it is prone to drought disasters. This paper takes the Taihang Mountain drought as the research object. First, according to the correlation between temperature vegetation index (TVDI), effective precipitation drought index (WAP), normalized drought index (NDDI), relative humidity index (M) and integrated Taihangshan loss rate, decision tree model, Taihang Mountain drought The disaster risk assessment of water scarcity and water scarcity is based on GIS technology. The model is used to monitor the temporal and spatial evolution of Taihang Mountain drought. The QuaEST algorithm is used to calculate the weights of each index to calculate the indicators and evaluate the risk of drought disasters in the Taihang Mountains. The results show that the risk distribution of drought disasters in Taihang Mountain is similar to the risk distribution of drought disasters. The risk of drought disasters is mainly distributed in the central and western parts of Taihang Mountain. The risk in the southeast part of Taihang Mountain is the lowest, and the risk in the western parts of Taihang Mountain is gradually increasing. The western region is a vulnerable area that fosters a disaster environment and gradually expands to the central and eastern regions; the northern and central regions are high-exposure areas with a downward trend. In general, the drought resistance of Taihang Mountain is higher in the south than in the north. In the process of drought prevention and drought resistance, different measures should be taken according to the different drought resistance and drought resistance in different regions. At the same time, due to the limitation of the theoretical level, there are still some shortcomings in theory and technology, which need further improvement. The accuracy of the algorithm should be further analyzed in the future.
Footnotes
Acknowledgments
Financial support for this work was provided by Scientific and Technological Research Projects of Universities in Hebei Province (ZD2016210), Handan Science and Technology Planning Project (1621203035-1), University-level Project of Handan University (2018225).