
Abstract
Price volatility is a matter of importance for making decisions in the finance world. The growing studies regarding volatility have focused on minimizing the risks through modeling, estimating and forecasting. This paper presents a bibliometric overview of the most important authors, institutions and countries that work on the topic. Additionally, a historical analysis of how the agents have interrelated is presented. For the purposes of the analysis and the design of tables and graphics, tools from the Web of Science Core Collection and the VOSviewer software were used. The results show the importance of volatility in the study of business economics and decision making.
Introduction
In the last decades, a growing literature has emerged regarding modeling and forecasting dynamics in the volatility of financial markets. The global financial crises have generated a significant instability in the prices of financial assets [1, 2]. Measuring volatility forecasting and making decisions to hedge are important tasks for the policymakers, researchers and financial practitioners [3–5].
Volatility can be caused by many interconnected variables. Political-economic problems such as a financial crisis, major changes in the markets, generation of speculative bubbles, or switches in the monetary and debt management policies can cause instability [6, 7]. Additionally, domestic volatility can be caused by volatilities in different markets around the world [5, 8].
However, since volatility is not directly observable, it is usually estimated through parametric models [9, 10]. Practitioners and researchers need to build a model with the capability to reproduce stylized facts based on observed time series that exhibit desirable statistical properties. In this sense, literature offers a set of models that adapt to one or more stylized facts. The existing parametric models for estimating the volatility include the popular ARCH–GARCH family [11, 12], the stochastic volatility models [13, 14] to a lesser extent, fuzzy models [15, 16], and artificial neural network models [17, 18].
Many reviews have been presented trying to compare different ways of volatility modeling. Poon and Granger [19] compare the volatility forecasting of existing models. Asai et al. [20] review specification, estimation, and evaluation of multivariate stochastic volatility models. Ait-Sahalia et al. [21] study the implied volatility in the model for forecasting. McAleer and Medeiros [22] review the volatility measure in high-frequency data. However, there is not a consensus on the best measures and volatility forecasting, due to the different instruments, horizons and scenarios.
This article proposes a bibliometric review of price volatility models in business economics and decision making. The main advantage of the paper is to offer a deep analysis of volatility studies and their interrelation. As part of this research, all the documents regarding volatility published between 1975 and 2018 were analyzed using the Web of Science Core Collection.
The results reveal a considerable increase of volatility studies in the last decades, resulting in more than twenty thousand papers in the area of business economics and decision making. The analysis reveals four facts: 1) The most important paper is the “Autoregressive conditional heteroscedasticity with estimates of the variance of United Kingdom inflation” proposed by Engle. 2) The most representative authors are McAleer M, Gupta R. and Bollerslev T. 3) The main institutions are the New York University, Columbia University and Duke University; and 4) The countries with the most publications regarding volatility are the USA, United Kingdom and China. Additionally, the most influential financial institutions on the topic are analyzed.
However, some fundamental investigations could be omitted if they are not found in the database or if another nomenclature has been considered to describe the phenomenon.
This work is organized as follows: 2) A description of the bibliometric methods used in the analysis; 3) An analysis of the publications structure, showing tables with the rankings of the best papers, authors, countries and institutions that study volatility; 4) A graphical analysis of the bibliographic data, and 5) A summary and conclusions.
Bibliometric methods
Bibliometric methods offer a convenient and non-reactive tool for studying collaboration in research. Pritchard [23] defines bibliometric analysis as the application of mathematical and communication methods to books and another media communication. A bibliometric study can produce many indicators such as productivity of authors, countries and universities. Additionally, this work includes information about co-authorship with journals, countries and universities. In the literature, many bibliometric studies have been analyzed in the areas of finance [24, 25], management [26, 27] and economics [28, 29].
To measure productivity, bibliometrics usually use the number of publications and their influence measured by the number of citations [30]. A very popular indicator to measure productivity is the h -index which combines publications and citations in the same measurement [31]. Another alternative is to consider the ratio citation/papers or the impact factor by obtaining the mean of citation per paper. For the purpose of this work, we analyze both, the h -index and the impact factor.
The analysis considers other bibliometric indicators such as citation structure, which includes the number of papers that have surpassed a citation threshold, cites per paper, cites per year, citing articles, and their evolution through time. For the country analysis, a ratio of paper/million inhabitants is used. To analyze universities’ productivity, the Academic Ranking of World Universities (ARWU) and the Quacquarelli and Symonds (QS) University Ranking are being considered.
To schematize the bibliometric analysis, we used the VOSviewer software [32]. The VOSviewer presents the information graphically, in terms of bibliographic coupling, citation, co-citation, co-authorship and co-occurrence of author keywords.
The study used the Web of Science Collection database that is currently owned by Clarivate Analytics with the indexes SCI-EXPANDED, SSCI, A&HCI and ESCI. The search topic keywords were “conditional heteroskedasticit* OR return volatility* OR conditional heteroscedasticit* OR stochastic volatility* OR volatility*”, which for purposes of this work will be considered as “volatility”. The search took place in May 2019. Note that the analysis only considered articles, reviews, letters and notes.
Results
Publication and citation structure
The number of publications regarding volatility from 1975 to 2018 were 22,004. Figure 1 shows the annual number of documents that have been published and it is observable that the number has considerably grown, especially in the last two decades.
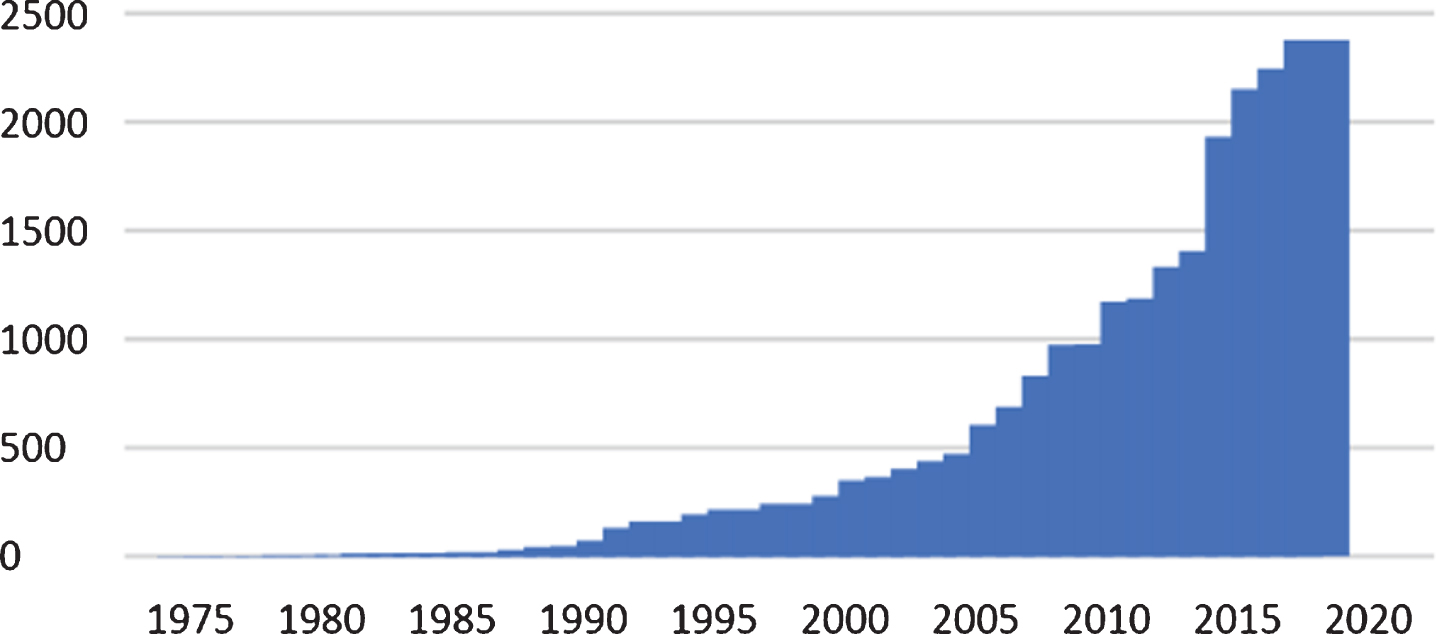
Volatility papers published annually.
In the first 17 years, publications were less than 100 per year. Then, an increase was observed in the decade of the nineties. The growth was accentuated in the first decade of the millennium. Since 2011 publications exceeded 1,000 per year. In 2016 they went up to 2,000. Nowadays, the growth is considerably significant.
Table 1 presents the forty most cited papers from 1975 to 2018. Note that the first places on the table correspond to works that study volatility modeling. The most cited paper was written by Robert Engle, winner of the Nobel Prize in economics in 2003 for his methods of analyzing economic time series with time-varying volatility, ARCH. The second most cited paper belongs to Tim Bollerslev who generalized the ARCH methods of Engle and proposed the GARCH model. In the third position, we find the work of Nelson that provides a new approach based on ARCH-GARCH models. On the other hand, the authors with the most cited papers are Bollerslev with 5 papers, Campbell with 4, Engle with 3 and Andersen with 3.
The 40 most cited papers regarding volatility between 1975–2018
Abbreviations: R = Rank; TC = Total citations; C/Y = Citations per year.
In order to analyze the most cited documents and their relation with the topic of volatility we used the VOSviewer software and obtained the co-citations presented in Table 2. The most cited document was written by Bollerslev in [12], followed by the contribution of Engle. Note that Bollerslev and Engle lead this list with five publications in the table.
The most cited publications regarding volatility
Abbreviations: A = Article B = Book; TLS = Total Link Strength.
With the objective to analyze the citations structure, this work established thresholds and presented the information from 1991 to 2018 as seen on Table 3. It is observable that the majority of the most cited papers were published between 1990 and 2009. Only 1.5% of the publications have more than two hundred citations and 34% more than ten citations. While 80% of the papers about volatility have been cited at least once.
Papers citation structure per year (1991–2018)
Abbreviations: TP and TC = Total papers and citations; ≥200, ≥100, ≥50, ≥20, ≥10, ≥5, ≥1 = number of papers with equal or more than 200, 100, 50, 20, 10, 5 and 1 citations.
In this section, authors, institutions and universities that have publications regarding volatility are analyzed. Table 4 shows the most productive authors. Michael McAleer from University of Western Australia is the most productive author with seventy-eight publications and he has been cited in two thousand one hundred thirty-five papers. In second place is Rangan Gupta with equal publications but fewer citations.
The most productive authors regarding volatility
The most productive authors regarding volatility
Abbreviations available in Tables 1 and 3 except: C/P=Cites per paper; H = h-index.
The list shows some authors with high h-index as Bollerslev, Engle, Andersen, Bekaert and Bali. It is important to note that almost half of the authors listed on the table are from the USA.
Table 5 analyzes the performance of the most productive authors through time; the information is presented in four periods of eleven years each. The productivity during the first period was low with an average of three publications. Engle and Schiller were the most cited authors during this period. Between 1986–1996 the two most productive authors were Engle and Nelson. In the third period, Bollerslev ascended to the first position with twenty-three publications. In the last eleven years, Gupta has been the most productive author with seventy-seven papers on volatility.
The most productive authors and their performance by period
Abbreviations are available in the previous tables.
In order to list the most productive and influential universities, we considered the last institution where the most productive authors have published their works.
In Table 6, USA universities appear with more frequency in the first three periods. However, from 2008 to 2018 European Universities became more relevant.
The most productive universities by period
Since volatility is an important financial topic, this study also analyzes the most productive institutions that are not universities.
Table 7 shows the National Bureau of Economic Research leading the list with 574 publications. Note that the institutions publishing about volatility are the policy makers of influential countries.
The most productive institutions
Table 8 shows the 40 countries with most publications regarding the topic of volatility. The USA is the most productive country followed by the United Kingdom and China. If we consider the number of papers and cites per million inhabitants, the most productive countries are Australia, Switzerland, Singapore, Denmark, New Zealand, Cyprus and Luxembourg with more than 50 publications per millioninhabitants. Switzerland, Singapore and Denmark lead in the number of citations with more than 1000 cites per million inhabitants.
The most productive and influential countries regarding volatility
Abbreviations are available in previous tables, except
This section presents the graphical maps that resulted from the bibliometric networks analysis using the software VOSviewer [32]. The maps include indexes such as co-citation, bibliographic coupling, citation analysis and co-authorship in order to analyze the influence and relationship among journals, publications of authors, institutions, countries and keywords.
In Fig. 2, the study analyzes the co-citation of journals regarding volatility. It presents the general analysis of the period 1975–2018 with a minimum threshold of five hundred cites and the one hundred most representative connections. Note that clusters are identified with different colors. One cluster regards the journals of mathematics, foreground publications in Econometrica, Journal of Econometrics and Physic A. Another group of influential co-citations regards Economic Theory. The most cited journals in this field are the American Economic Review, the Journal of International Money and Finance, and the Journal of Monetary Economics. The leading journals in co-citation in the financial cluster are the Journal on Finance and The Review of Financial Studies. A fourth cluster includes the journals regarding management and business topics. While examining co-citation between clusters, it is observable that economic and econometric journals have a great tendency to cite financial journals.
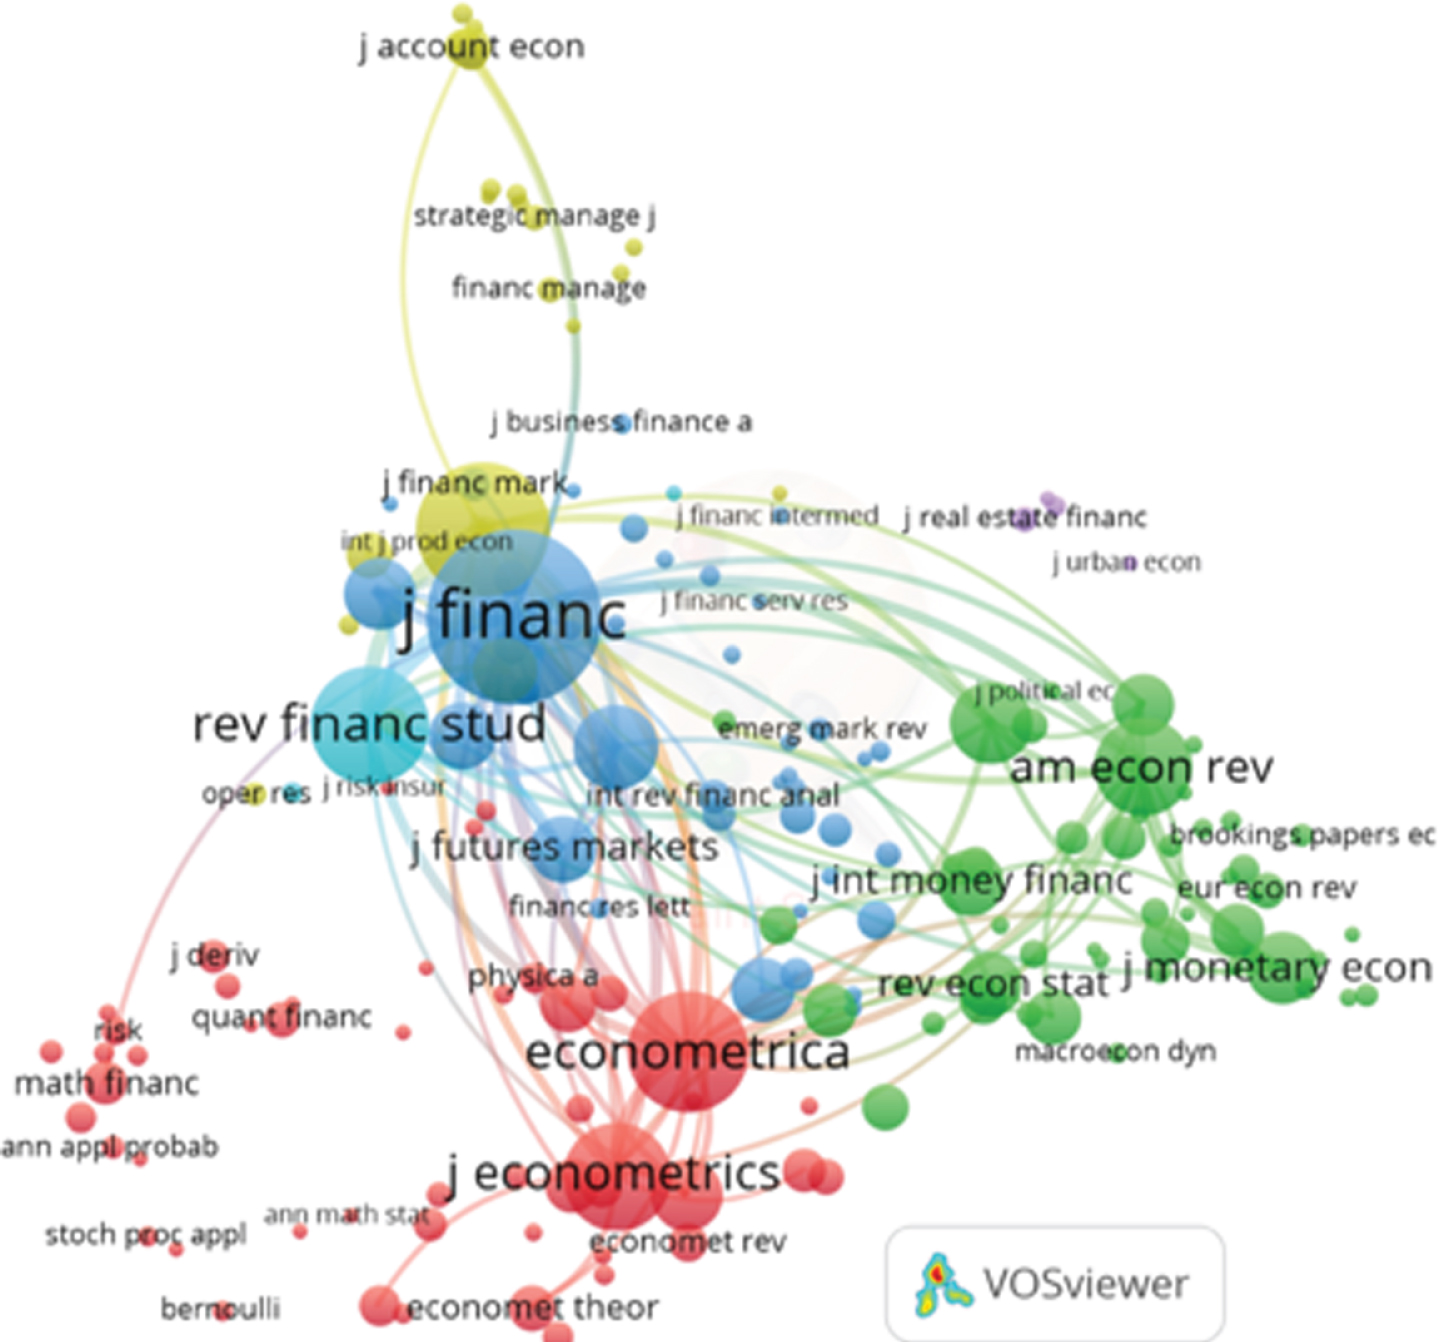
Co-citation of journals regarding volatility.
Another interesting analysis is the bibliographic coupling among authors who publish about volatility. The resulting graph shown in Fig. 3 used data with a minimum threshold of twelve papers and sixty cites. The featured authors in the graph are Michael Mcaleer, Tim Bollerslev and Rangan Gupta, also mentioned as the most productive authors in Table 4. Authors collaborate among themselves by countries or geographical areas. Note that in very few cases collaboration happens outside or beyond their research groups or areas.
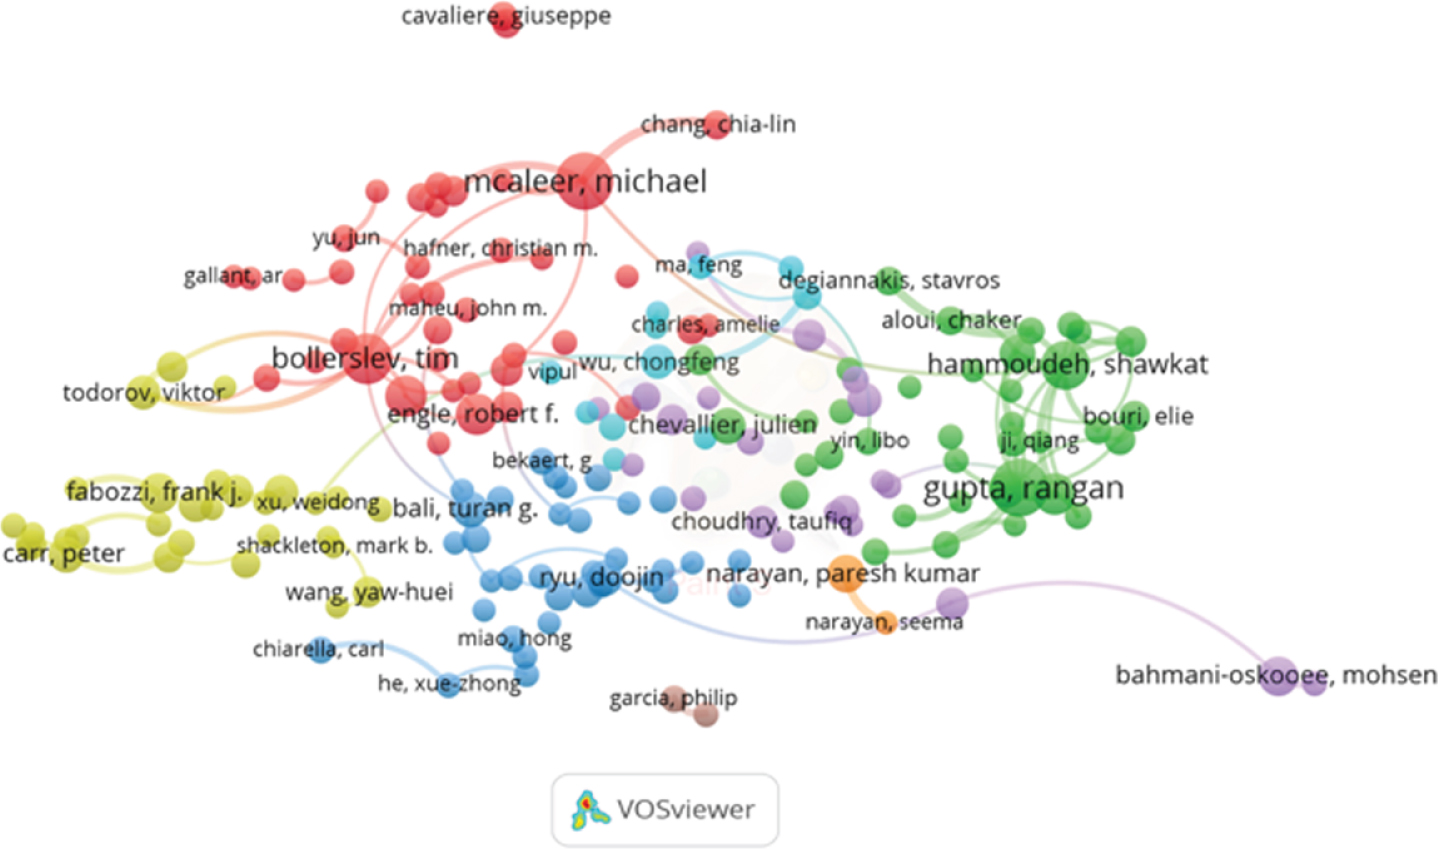
Bibliographic coupling among authors publishing about volatility.
Figure 4 shows an analysis of the citations by institutions, with a minimum threshold of fifty papers, five hundred cites and one hundred connections. The results are mostly grouped by geographical areas. The two largest groups are universities from the United States and they have great interaction among them as observed. European universities are part of the other three small groups, which have little interrelation with each other. Most of the universities in the United States are connected to the rest of the representative universities.
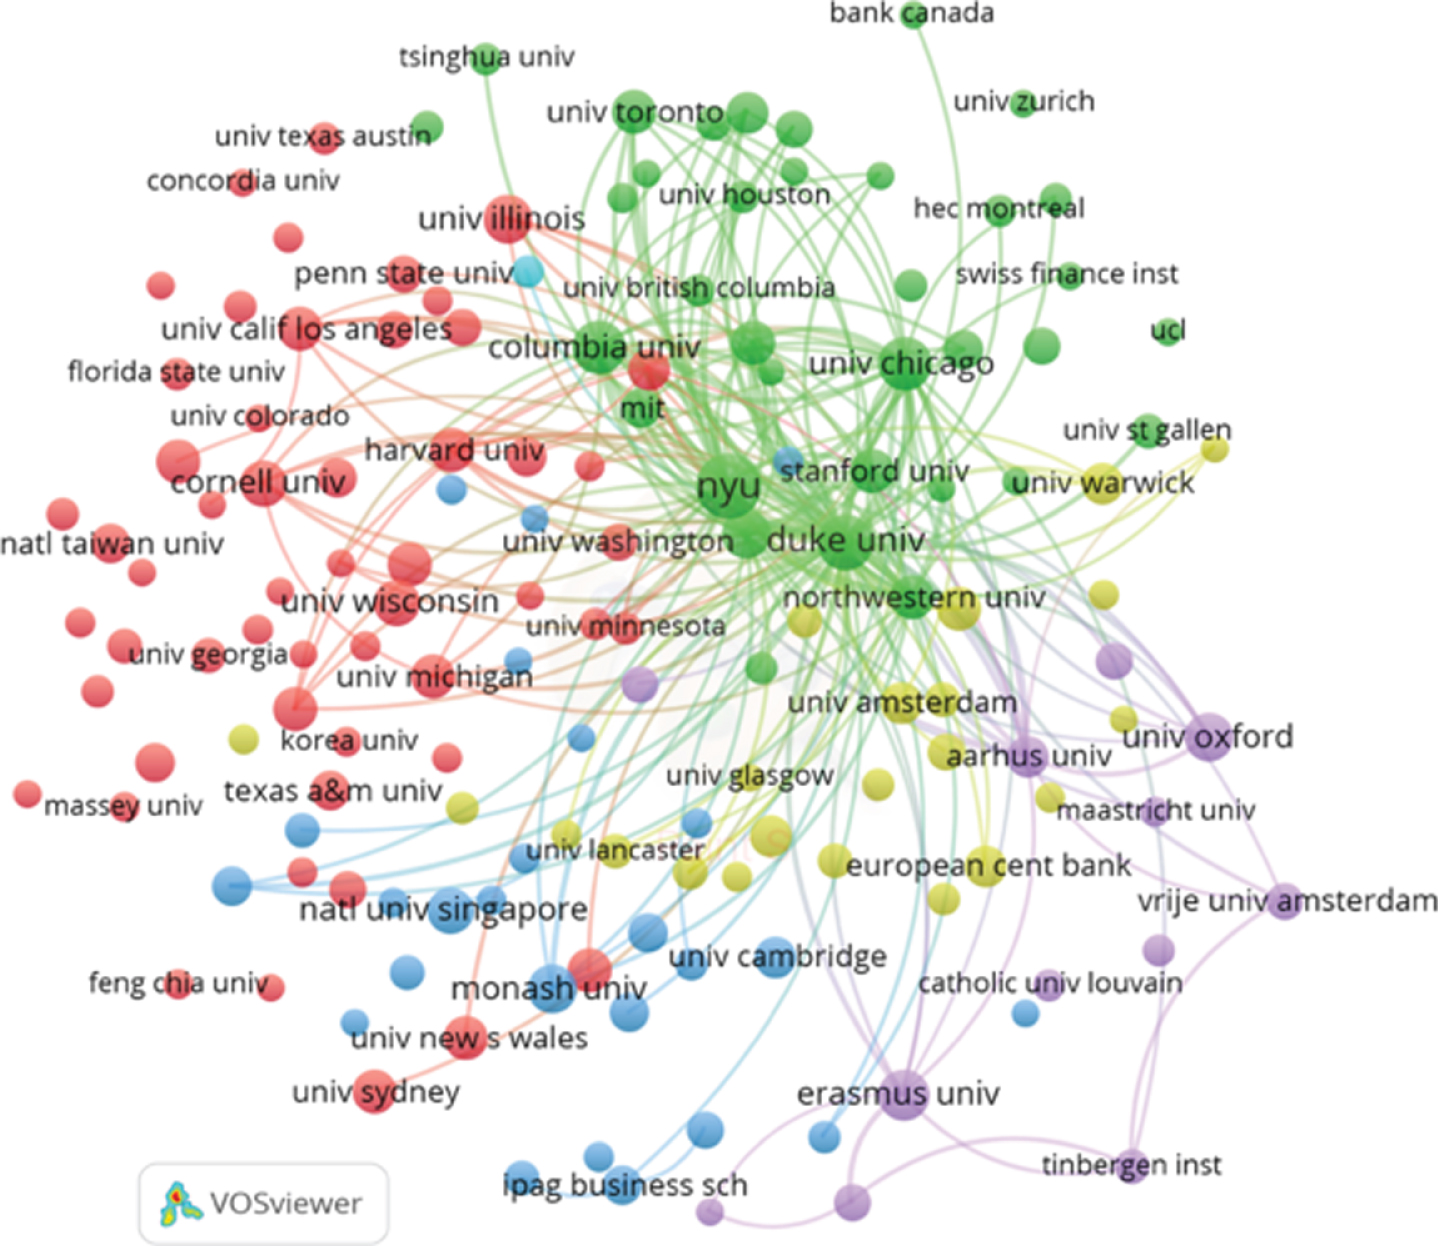
Citation analysis by institutions.
Figure 5 shows the bibliographic coupling of countries with a threshold of twenty documents and one hundred connections. It is observable that the United States has a close relationship with Scotland, Japan and Finland. Collaborative works regarding volatility can be found among the most representative countries: USA, China, England, Australia, Canada, Germany and France.
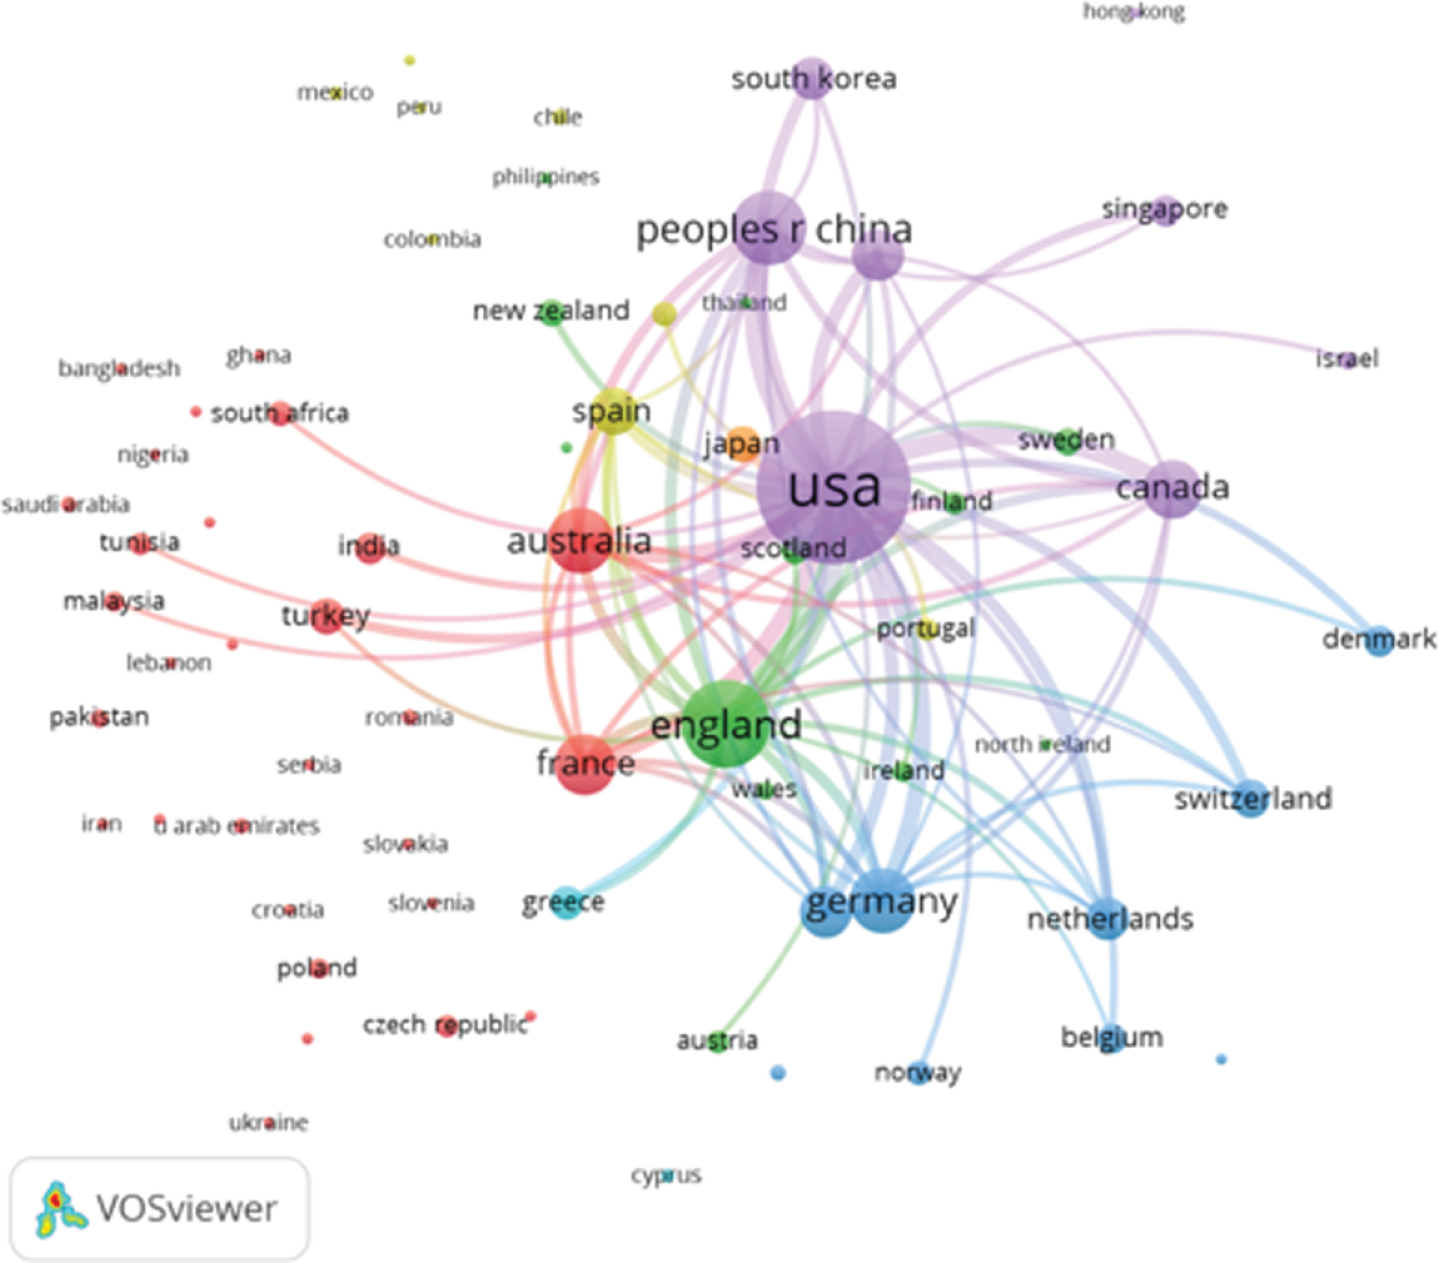
Bibliographic coupling by countries.
In order to analyze the words used by the authors, Fig. 6 shows the leading keywords in volatility papers. The Co-occurrence of author keywords analysis took into account a minimum threshold of fifty papers and one hundred connections. The most influential words are volatility, stochastic volatility, GARCH, realized volatility, forecasting and monetary policy. The words linkable to this study are estimation, forecast and modeling volatility. Words tend to be grouped into different clusters depending on other subtopics such as business and economics, financial markets, modeling and measures. The interrelationship between the representative words mainly occurs between the areas of modeling and volatility measurement.
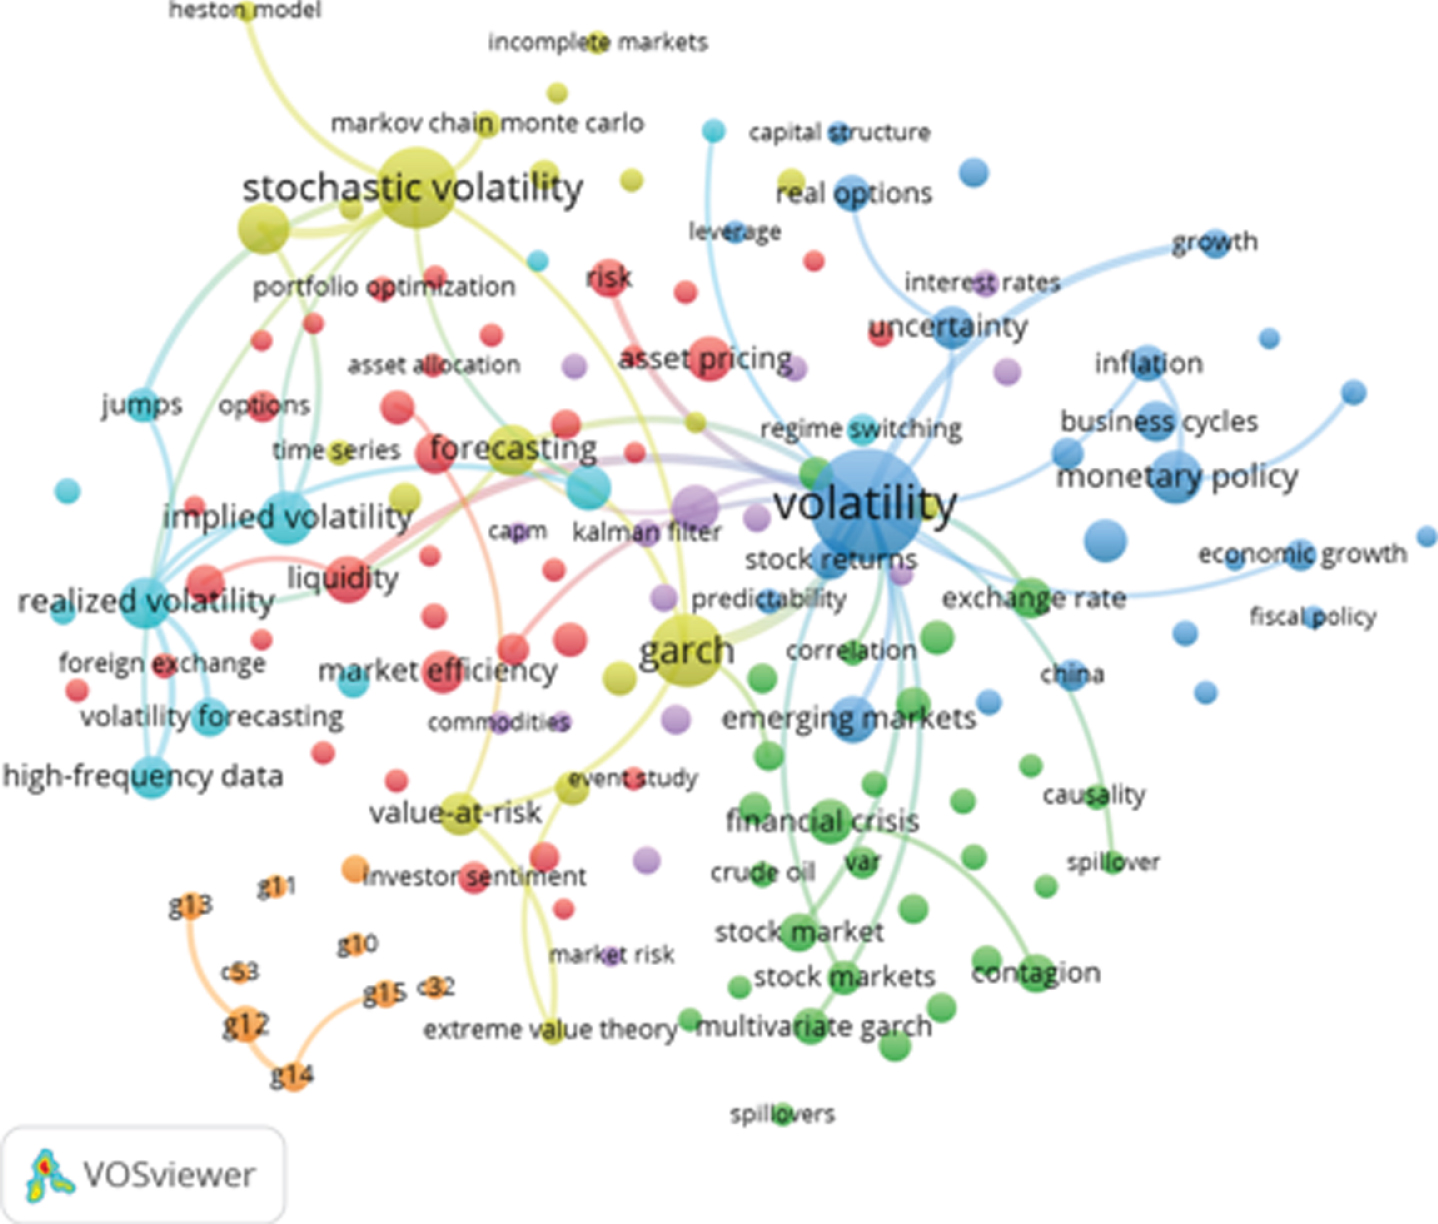
Co-occurrence of author keywords in published documents regarding volatility.
Finally, in order to analyze the most common words through time, Table 9 shows the forty most used words along the general period and during three different periods: 1986–1996, 1997–2007 and 2008–2018. Volatility has been the most used keyword in all periods; GARCH was the second most used in the first period, while stochastic volatility is ranked in second place for the global period.
Most common author keywords occurrences regarding volatility
Abbreviations: OC = Author keyword occurrences; CO = Author keyword co-occurrences links.
Volatility is an important topic for financial management and decision making. Since volatility has an impact on prices, it becomes an influential indicator for investors, researchers and policymakers. Open markets and free trade have created continuous instability in the prices of financial assets. Exchange rates, indices and derivatives prices have been the most affected. In this sense, the literature has developed many proposals to counteract such problems.
Modeling, estimating and forecasting are the most important issues regarding volatility. This paper proposes a bibliometric analysis of volatility, modeling and forecasting through time. The work comprises forty-four years between 1975–2018.
The paper also proposes an analysis of authors, institutions and countries who work in volatility, using comparative tables and graphical visualizations. Note that the information was retrieved from the database of the Web of Science Core Collection, and the maps were built with VOSviewer software. The analysis includes bibliographic coupling, co-authorship and co-citations, wherewith clusters and leading trends can be analyzed.
The most cited paper was written by Engle with 7,332 cites; his paper proposes an innovation in modeling and forecasting volatility. The USA is the most productive country through time with an annual number of publications well above the rest of the countries. Therefore, it is not strange that American universities lead the list of the most productive institutions regarding volatility. Other countries with high productivity are the United Kingdom and Germany while China has considerably increased its productivity in recent years.
This paper highlights the importance of studying volatility and how authors and institutions tend to work in groups by countries and geographical areas. It also shows how volatility has been studied from mathematical, financial and economic approaches over time.