
Abstract
As an inevitable trend in the development of English teaching, English distance education needs to use artificial intelligence to control the classroom, so as to improve the degree of control of teacher over the classroom. Based on the machine learning algorithm, according to the needs of English distance education classroom management, this paper builds an English distance education classroom management system based on improved machine learning artificial intelligence algorithms. Moreover, this research constructs the system function module through requirement analysis, and combines the positioning algorithm to locate students in real time. In addition, this study analyzes the students’ status through intelligent database processing to grasp the students’ learning status in a timely and effective manner. In order to verify the performance of this system, this study verifies the performance of the model by means of comparative experiments. The research results show that the system constructed in this paper has a certain effect.
Keywords
Introduction
With the continuous development of science and technology, classroom education has gradually developed from the original traditional classroom teaching model to the artificial intelligence online teaching model. For example, the new coronavirus epidemic prevents students from receiving English education in the classroom, so students need to use distance online teaching methods. However, teachers in distance teaching methods cannot control students in real time, and students have a high degree of freedom, which results in students being unable to concentrate on listening and teachers not being able to grasp the learning status of students in a timely manner. In addition, it also brings some difficulties to the evaluation of teachers’ teaching effect [1].
The promotion of the intelligent writing system in the field of education and the use of primary and secondary schools have inspired us in teacher supervision and evaluation. After the traditional blackboard is replaced by an intelligent writing system, the system saves the content of the teacher’s classroom lectures, such as blackboard writing, slides used for teacher lectures and other teaching materials. In the era of education informatization, the electronic teaching resources that can be used in the intelligent writing system are also increasing, and the content saved by the system is also increasing, which can achieve innovation in teaching evaluation. In addition, we can rely on the evaluation method of the intelligent writing system to compare the blackboard written by the teacher in the classroom with the classroom lesson plan uploaded by the teacher and the word version of the electronic textbook, and then evaluate the teacher according to the content repetition rate. During the system evaluation, three kinds of users were designed, namely system administrators, grade directors and teacher users. The main task of the system administrator is to manage other users, and the task of the teacher user is to upload the word lesson plans and word electronic textbooks written before the class, and the grade director is the main body of the teaching evaluation. When evaluating a teacher, the grade director first downloads the blackboard picture left by the teacher from the teaching resource management system, and then converts the text in the blackboard picture into a word document. In the word lesson plan uploaded with the teacher, Word version of electronic textbooks for comparison. Afterwards, the grade director judges whether the teacher gives a comprehensive lecture and imparts true knowledge to the students according to the content repetition rate. This evaluation method does not need to use a lot of manpower, nor does it need to occupy students’ extracurricular time, and the evaluation result directly reflects the teacher’s teaching level. From the evaluation results, teachers can know the deficiencies of their lectures, and can make corrections and make up in time, which is conducive to improving teachers’ level of teaching. This evaluation method is an innovation of the original network evaluation method [2].
The student attendance work in the classroom management system is still dominated by teacher attendance at home and abroad. Students must arrive in the classroom early. This method can only be used for rough class attendance, and students are prone to cheating and waste classroom time. Moreover, there is still no way to supervise the student’s class status, the teaching data cannot be informative, and there are large loopholes. Due to the particularity of university teaching, teachers and students lack classroom communication, which affects students’ enthusiasm for learning. Some students may begin to degenerate because they do not get the teachers’ timely attention, which greatly affects the quality of school teaching. More importantly, manual management cannot informative and digitize teaching data, students question the fairness of course performance scores, and there is no data basis for schools to make management decisions [3].
Based on the above analysis, it can be seen that online teaching will become the main method of English teaching in the future, so it is necessary to develop a monitoring system for student online learning based on artificial intelligence algorithms. The system can master students’ learning status through remote management and control, and it is convenient for teachers to adjust teaching methods in a timely manner and give hints to students who are not serious.
Related works
The system can calculate the evaluation result according to the evaluation record of the questionnaire and the designed algorithm [5]. This evaluation method based on the WEB network platform can change the content of the questionnaire survey according to the actual situation, and the results of the evaluation can be published in a timely manner, which is conducive to the school’s teaching management and improves the school’s teaching management level [6]. However, this evaluation method still requires a lot of manpower. For example, when teaching evaluation is needed, students need to log in to the evaluation system in the form notified by the class teacher, and then conduct teaching evaluation. Sometimes, in order to be able to carry out normal evaluation, each grade and class have to be evaluated separately. If students log on to the system for evaluation, it may cause the system to crash. Second, there is a non-objective result in the evaluation method with students as the main body. For example, some students may feel impatient after seeing the page-by-page evaluation form, which leads to the situation where students fill in casually. In addition, some students will have an emotional tendency, which results in some teachers being selected as good or some teachers being selected as bad. The biggest problem with this evaluation method is the existence of non-objectivity. The second is that it requires a lot of manpower when evaluating, and it also takes up students’ extracurricular time [7].
Teaching evaluation is a comprehensive evaluation of teachers through relevant materials such as classroom management [8], teaching materials [9], lectures [10], teacher ethics [11], professional achievements [12] and other relevant materials. The teaching ability of teachers is an important indicator of teaching quality. The level of teaching quality is directly related to the reputation of the school and the cultivation of students. Therefore, the purpose of carrying out teaching evaluation is to summarize classroom teaching experience, and to propose targeted problems and solve problems according to the insufficiency of teachers, so as to improve the teaching level and ensure the cultivation of student quality [13].
The computer network has the characteristics of interactivity, sharing, openness, flexibility, and convenient data collection. Compared with the traditional teaching evaluation method, teaching evaluation under the network environment has many advantages. Teaching evaluation under the network environment can make full use of the existing resources in the school database to make a comprehensive evaluation of teacher teaching. The evaluation subject can log in to any computer connected to the campus network to evaluate. Finally, the evaluation system conducts a comprehensive analysis based on the collected data. This evaluation method has the characteristics of openness, transparency, timeliness and detail, which ensures fairness and has gradually replaced the traditional manual evaluation method. Machine learning algorithm is utilised for feasibility study for human health on particulate matter [14]. Human recognition activity in various environment is modelled using k-NN algorithm [15]. Biometric authentication for finger print identification using machine learning algorithm [16]. Particle swarm optimization was involved on the study of images segmentation [17]. Taxonomy and process model was utilised for computing big data using IoT based network [18].
Artificial intelligence positioning technology
This article combines artificial intelligence and GPS to carry out intelligent positioning of the student’s location. The GPS system mainly includes three components: space, ground monitoring and user equipment. Among them, the space part refers to the GPS navigation constellation. The ground monitoring part refers to the ground monitoring facilities. The user equipment part refers to the GPS wireless signal receiver on the user side. Figure 1 shows the components of GPS.
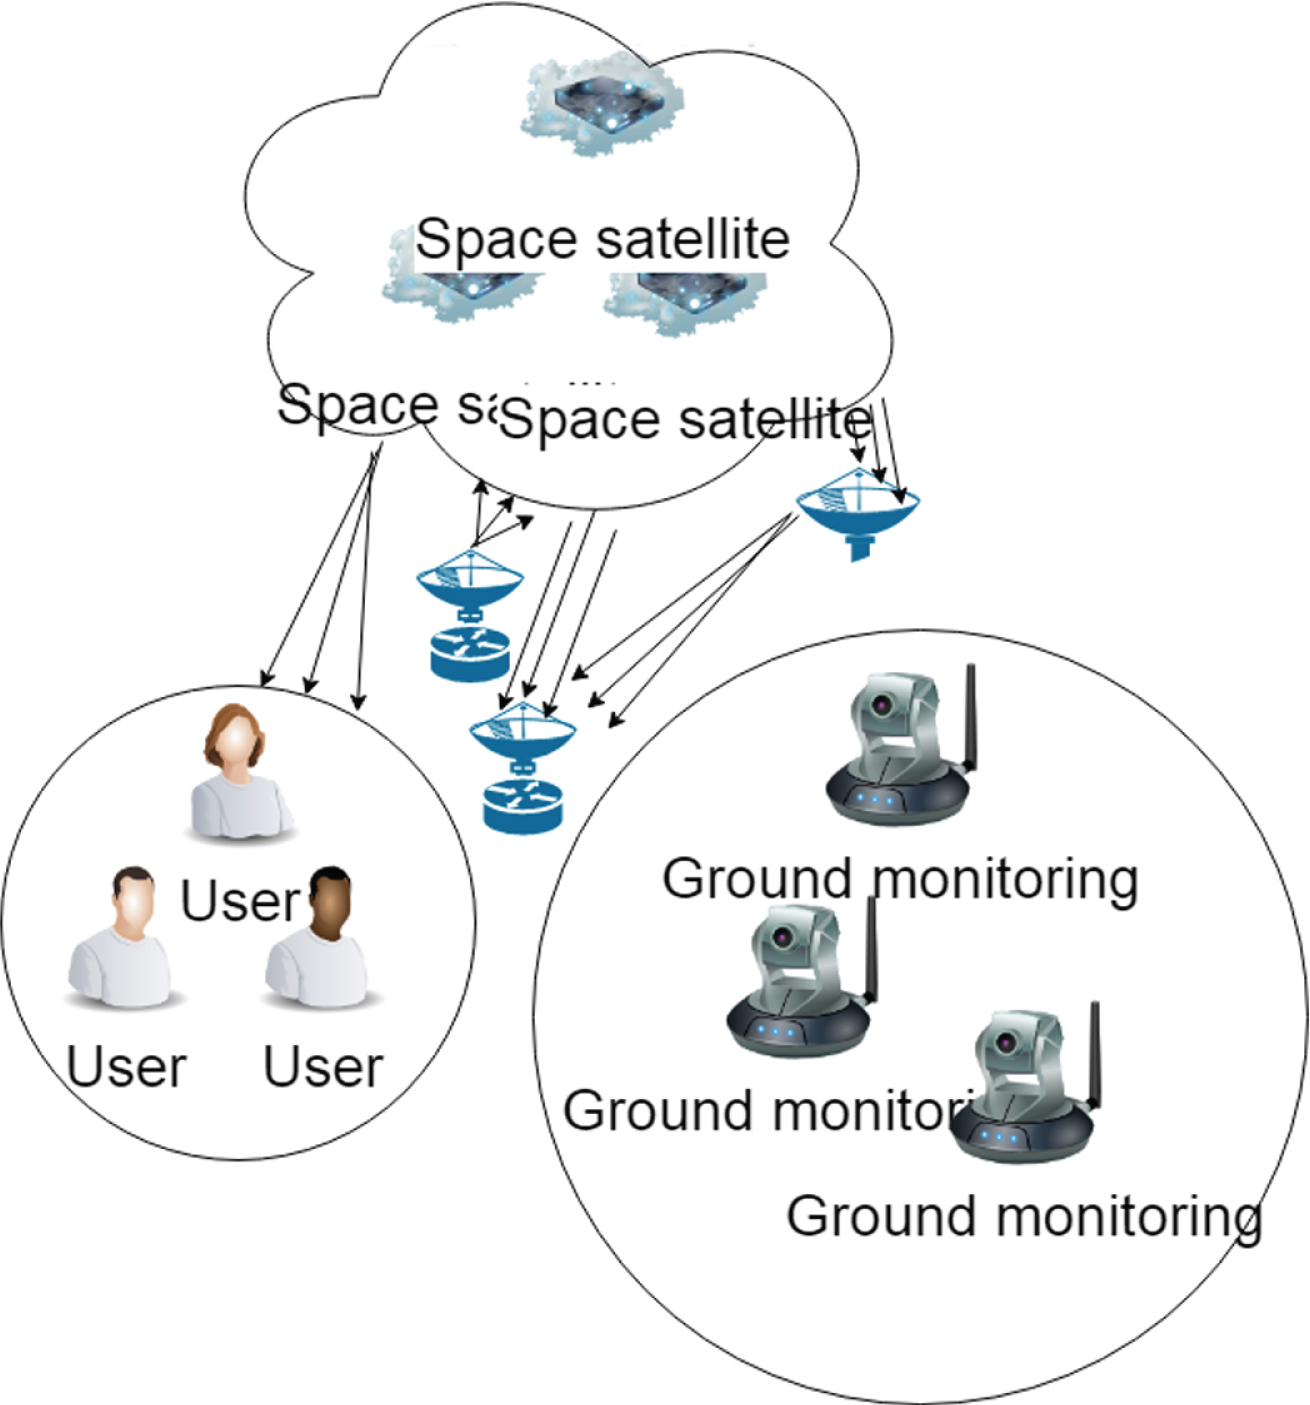
GPS components.
GPS positioning needs to determine the three-dimensional position of the observation station. The mobile device receives the signals of three satellites and calculates the distance. The common positioning methods used today are single-point positioning and differential positioning. Single-point positioning uses a single positioning receiver to implement positioning. This method is more widely used in life, and the location recognition of vehicles, ships and mobile phones is within the scope of this location recognition. Figure 2 is a representation of satellite single-point positioning [14].
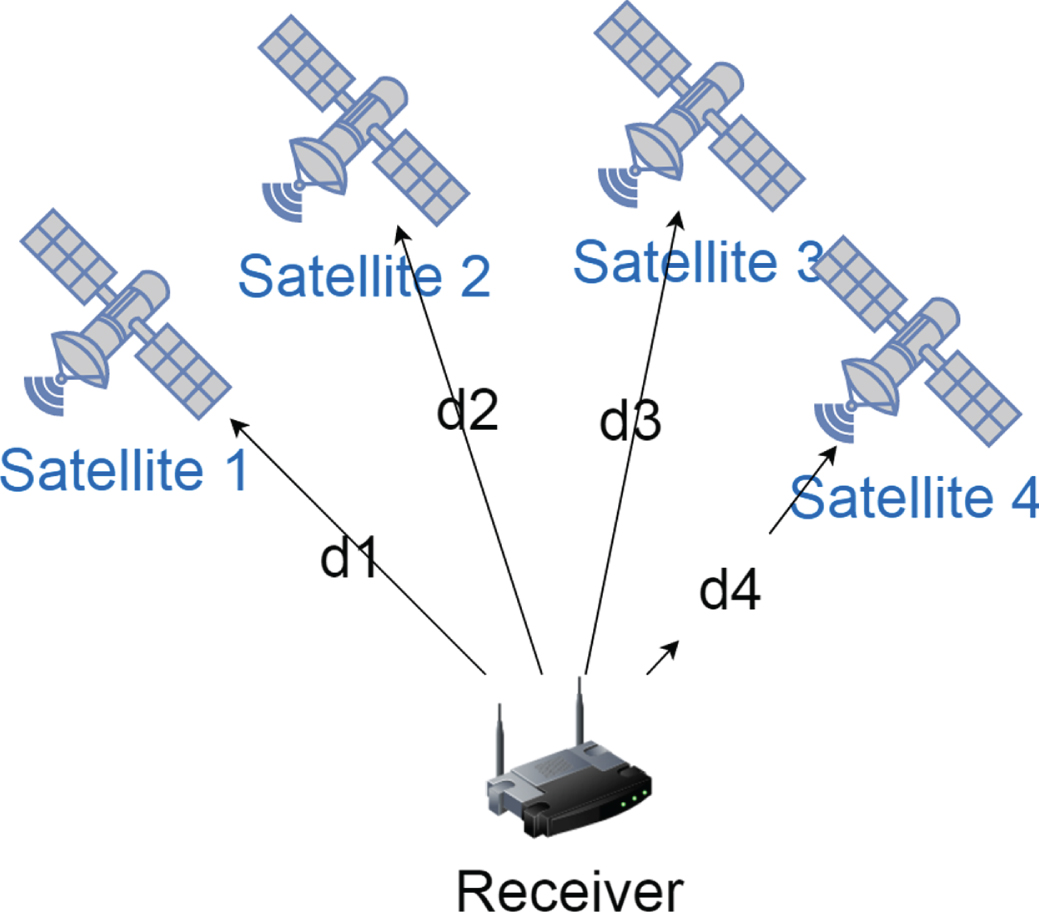
Single point positioning.
We set the coordinates of the GPS receiver to (x, y, z) at a certain time. During the positioning process, according to the satellite ephemeris data, the three-dimensional coordinate value (x
i
, y
i
, z
i
) of the satellite i is obtained, and according to the time information embedded in the satellite ranging code, the receiver can estimate the satellite signal transmission time. After that, according to the time when the signal is received, the propagation time of the satellite can be obtained. Since the propagation speed of satellite data is the speed of light C, the distance between the user and the satellite can be calculated. Then, there are [14]:
In the formula, t u is the time when the satellite signal arrives at the user’s receiver, t s is the satellite signal transmission time, and ρ′ is the distance between the satellite j and the receiver. Because there are three positions in the above formula, only three equations are needed to find the value of (x, y, z).
However, in reality, there is a clock error between the satellite and the user. If we assume that the satellite j clock error is Δb
i
and the user clock error is Δb
u
, then the actual satellite clock time is
In addition to the above errors, the ionosphere and other errors in data transmission must also be considered, so the distance between the user and the satellite is:
Among them, ΔD
i
is the interval error caused by the satellite azimuth error, ΔT
i
, ΔI
i
, Δv
i
is the troposphere, ionosphere delay error and relativistic effect error, v
i
is the receiver noise error. Except for the distance error caused by the receiver clock error, other errors can be corrected by the parameter model. Therefore, the formula (1) is changed to:
Among them, b u = cb u . It can be seen that the only variables that really needs to be solved are x, y, z, b ut , so at least four satellites are needed.
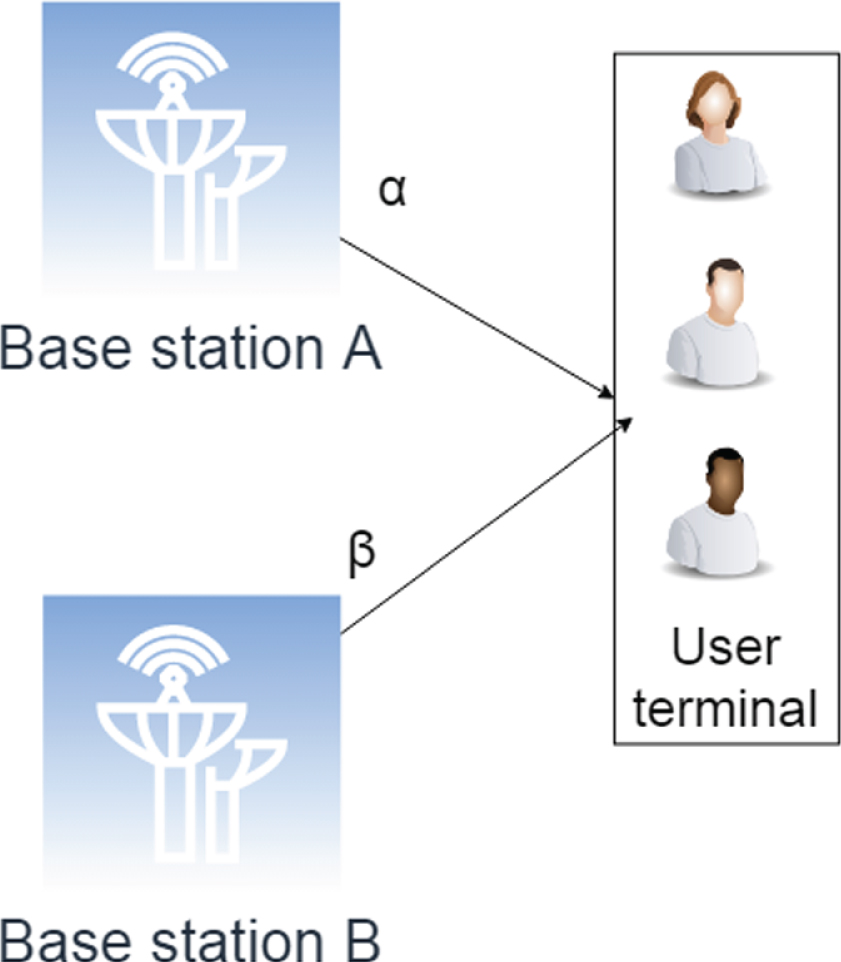
The angle of arrival positioning algorithm (AOA) based on the base station signal is a classic ranging and positioning algorithm [16]. In the AOA method, first, by using the base station array antenna, the incident angle of the radio wave signal transmitted by the terminal is obtained, thereby depriving the radial azimuth line from the base station antenna to the user terminal. After the base station acquires multiple such AOA measurement values, the location information of the user terminal to be measured can be finally estimated according to the AOA positioning algorithm used to determine the line intersection. The principle of azimuth positioning is the coordinate of the base station A at the reference point is set to (x1, y1), the coordinate of the base station B is set to (x2, y2), and the coordinates to be measured is set to (x, y). The angle g between the base station A and the user terminal is set to α, and the angle between the base station B and the user terminal is set to β. The specific content is shown in the following figure [17].
According to the position information of Fig. 3, the equation group shown in formula (6) is obtained. By solving formula (6), the position coordinate information of the user to be measured can be obtained [18].
Schematic diagram of AOA positioning.
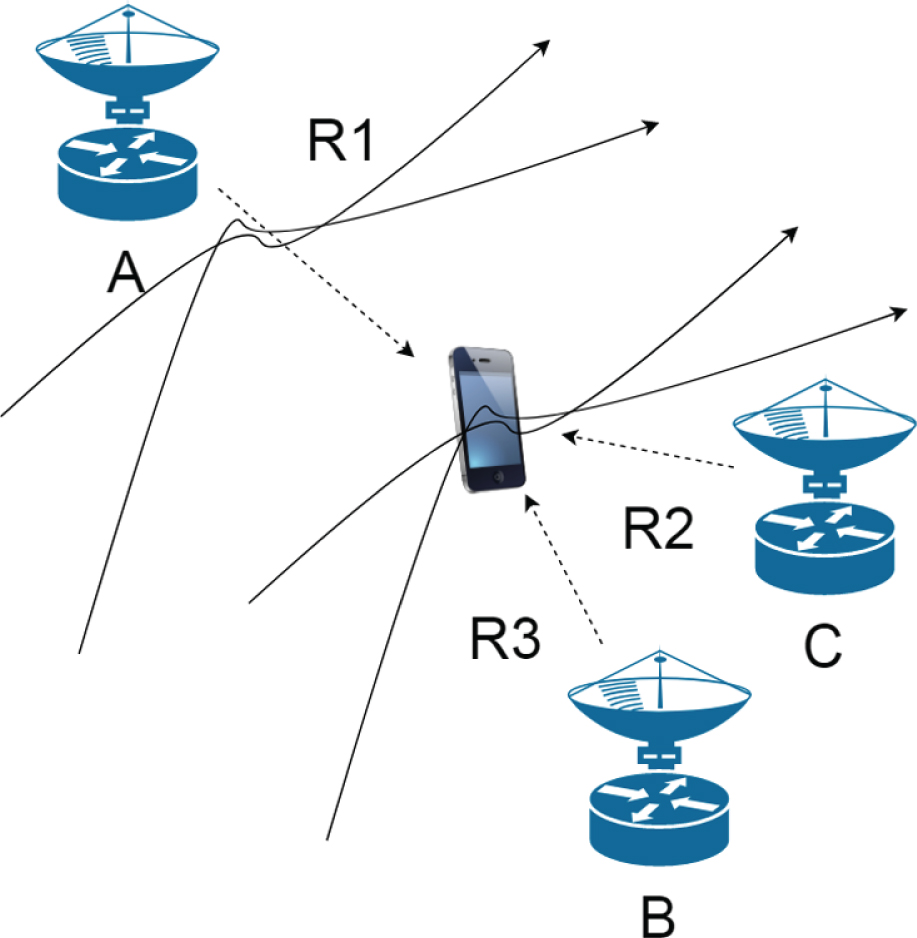
TDOA positioning technology determines the location of the mobile terminal by calculating the communication time difference between the two base stations receiving the arrival signal and considering the electromagnetic wave propagation speed, which reduces the necessity of time synchronization. We assume that the distances from users to base stations A and B are R1 and R2, respectively. According to the geometric principle, the position of the user must be on a hyperbola with A and B as the focal point and the distance difference R21 = R2 - R1 between the user and the two base stations as the focal length. Similarly, another hyperbola can be constructed based on the difference between the corresponding distances between the base stations A, B, and C and the user. One of the intersection points of the two hyperbolic curves is the user’s position, as shown in Fig. 4.
Schematic diagram of TDOA positioning.
The relationship between the user position (x, y) and the positioning base station position (x i , y i ) is as shown in formula (7) above. By knowing the product of the electromagnetic wave propagation speed v and the time difference n of the signals received by the two base stations, it can be determined that the user is on the hyperbola with the two base stations as the focus and the distance difference as v · Δt. By measuring the time difference of arrival of signals between at least three base stations, a hyperbolic equation about the location of the user is formed, and the approximate location of the mobile terminal user is obtained by solving the equation [19].
Principle of WiFi positioning technology: The positioning method of this technology is similar to base station positioning, and it is a way of positioning by using the wireless access point signals already covered in the network as reference parameters. WiFi positioning technology does not require additional hardware deployment expenses and can completely depend on the existing network architecture. The applicable scenarios are not limited to indoor or outdoor. Moreover, it can use the characteristic parameters of the wireless signal (such as signal strength distribution, propagation time, etc.) to quickly locate the client, which is a promising positioning technology.
At present, there are two main positioning technologies based on WiFi: location fingerprint matching method and triangle algorithm.
(1) Location fingerprint matching
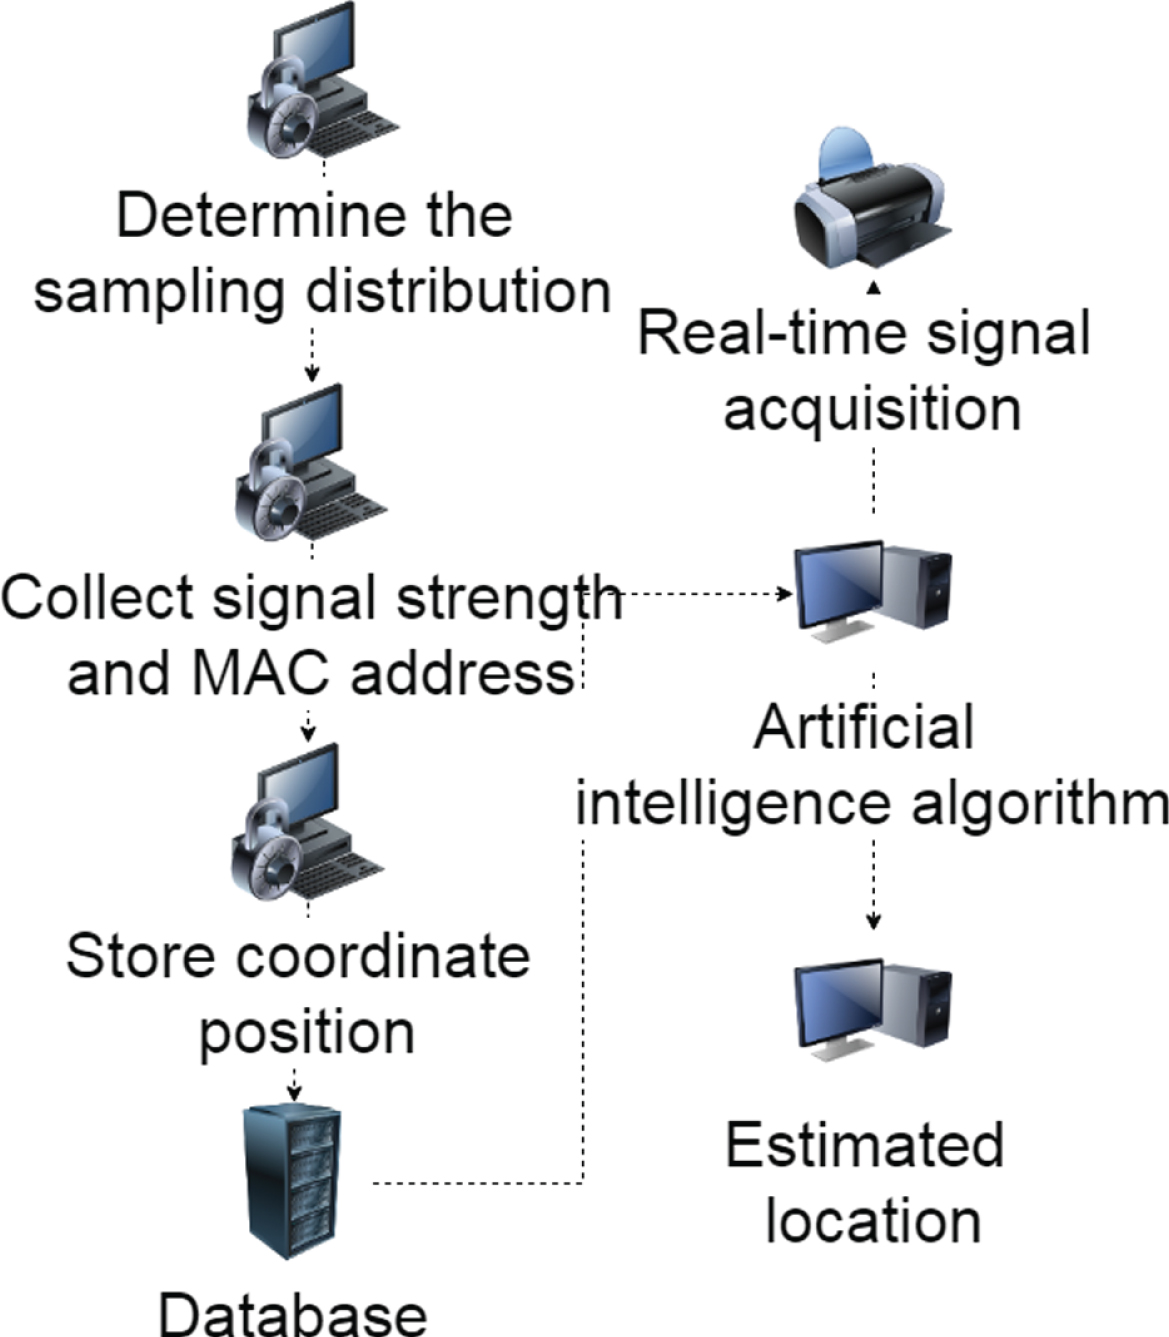
The location fingerprint matching method establishes the corresponding location fingerprint database based on the received signal strength vectors from different directions, and then matches the real-time signal strength with the signal vector stored in the database signal space according to the corresponding matching algorithm to achieve positioning as shown in Fig. 5. The method is mainly divided into two stages, the training stage and the positioning stage. The key purpose of the training stage is to create a location fingerprint database. At this stage, the operator needs to select a reasonable sampling distribution map according to the positioning environment, scan all sampling points in the area to be located, and record the corresponding information of the signal in the fingerprint database. In the positioning stage, the point to be tested sends positioning request information to the positioning server. After that, the positioning server uses a specific matching algorithm to search the database for data matching the measurement point as an estimated value of the position of the point to be measured [20].
(2) Triangle algorithm
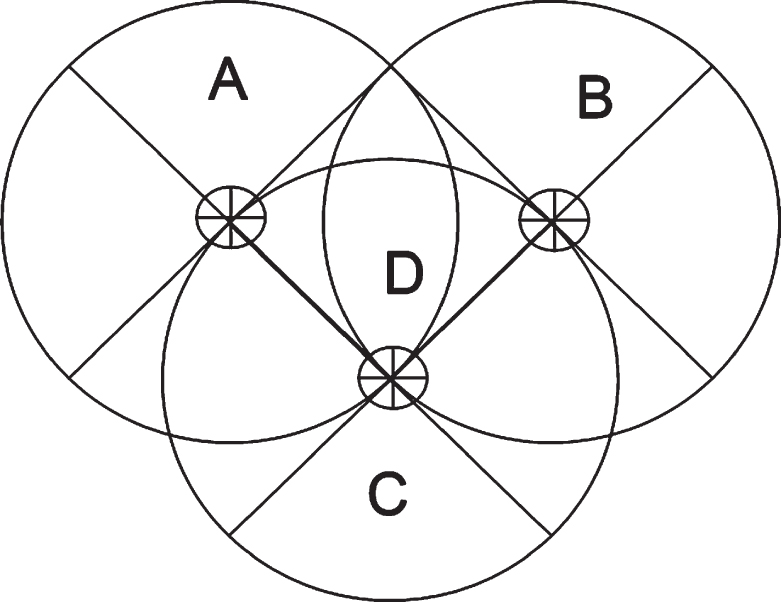
The main purpose of the triangle algorithm is to receive AP signal strength values from at least three differentiated known locations through the point to be measured, and then use some transmission consumption models to calculate the distance between the point to be measured and the corresponding AP as in Fig. 6. Finally, the algorithm uses the three known APs as the center of the circle, and uses the distance from the AP point to the point to be measured as the radius. The intersection of the three circles is the point to be measured [21].
Based on the need for client support, IP positioning algorithms are divided into two categories: client-independent algorithms and client-dependent algorithms.
(1) Client-independent algorithm
The client-independent algorithms are divided into three types according to the positioning principle: the positioning algorithm based on speculation, the positioning algorithm based on delay and the comprehensive positioning algorithm. The principle of the speculative positioning algorithm is to speculate the actual location information of the IP device according to the allocation of the IP address segment or search the database. The principle of the positioning algorithm based on delay is to estimate the position of the host through the delay between the host and the point to be measured, and it is usually combined with the network topology to locate to improve the positioning accuracy. In order to locate the host more accurately, the integrated positioning algorithm combines the essence of the above two algorithms. Its positioning principle is to use various information to locate the target host, and it divides all the information into two types of constraints and improves the positioning accuracy by narrowing the predicted position range and combining with the corresponding algorithm.
(2) client-dependent algorithms
The client-dependent algorithm collects the position information of the host device and reports it to the positioning system by installing a specific hardware positioning device on the host device. Usually these systems use GPS, WiFi, base stations, Zigbee and other wireless positioning systems as information sources.
The detection of the outliers of latitude and longitude data requires an overview of the characteristics of all data. Those that deviate significantly from the core position range can be considered as outliers. And it is not possible to determine whether the distribution of the data belongs to the standard normal distribution. The statistical analysis method to be adopted needs to have the characteristics that the performance is not easily affected, so as to minimize the impact of outliers on the statistical analysis results. Therefore, it is required that the outliers have robustness in the process of initial and successive discrimination.
At present, many domestic and foreign scholars have been constantly studying how to eliminate the influence of outliers. The vast majority of scholars still do research on eliminating outliers and robust statistics. In latitude and longitude data, the amount of data is not very large, and the number and location of outliers are unpredictable. In order to robust statistics and avoid “missing effects”, the robust quartile detection method is currently a better choice.
The main steps for using robust quartile detection to detect abnormal outliers are as follows:
(1) This set of data is sorted, and the ordered data sequence is set to X1, X2, X3, ⋯ , X n , and then the data is divided into four equal parts. The three values Q1, Q2, Q3 at the split point are quartiles.
(2) The position of the median M is determined, and the calculation formula is:
(3) As shown in Fig. 7, the lower quartile Q1 has 1/4 data smaller than it, and the position is in the value bits of (n + 1)/4. The data of Q3 in the upper quartile 3/4 is smaller than it, and the position is in the value bits of 3 (n + 1)/4. The interquartile range IQR = Q3 - Q1 is calculated. When the calculation result of Q3, Q1 is not an integer, its value is calculated using interpolation. We set the position calculation result of Q1 to m, the integer part is a, and the fraction part is b. The interpolation method can be simply understood as that the numbers that are close are multiplied by a large probability value, and the numbers that are far away are multiplied by a small probability value. That is: If a ⩾ 0.5, then Q1 = x a (b) + xa+I (1 - b). However, if a ⩽ 0.5, Q1 = x a (1 - b) + xa+I (b).
Location fingerprint matching method.
Triangle algorithm.
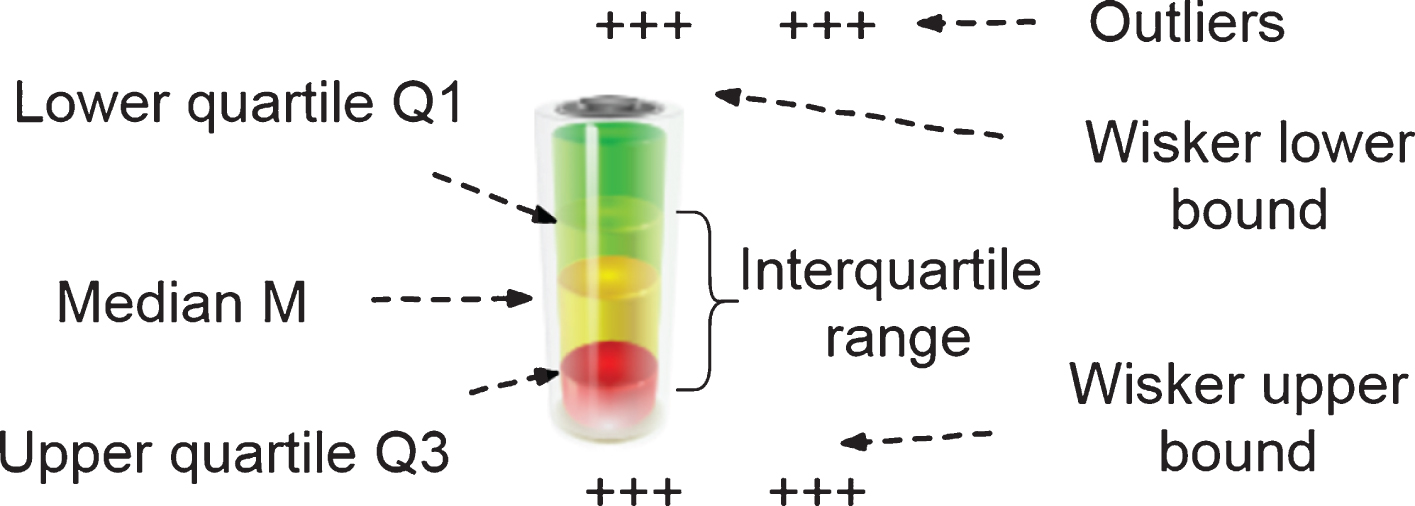
Schematic diagram of the quartile method.
The standardized interquartile range (NormIQR) is defined as the IQR multiplied by a coefficient of 0.7413 (the coefficient of 0.7413 is obtained from the standard normal distribution).The mean value of the standard normal distribution is 0, and the standard deviation is 1. At this time, the range of the four-fraction interval is [- 0.6745 + 0.6745], and the width is 1.3490.Therefore, the interquartile range multiplied by 1/1.3490 (0.7413) is equivalent to the standard deviation of the normal distribution, that is, NormIQR is equivalent to the standard deviation of the normal distribution. Processed with robust technology as a statistic indicating the degree of data dispersion.
(4) According to the median in the series and the standard interquartile range, the data anomaly limit is determined. When the absolute value of Z is less than or equal to 2, it is a normal value; when the absolute value of z is between 2 and 3, it is an outlier suspicious value, indicating that the data has revealed problems; when the absolute value of Z is greater than or equal to 3, it is an extreme outlier, indicating that the data is highly abnormal. When a certain value x
i
(i = 1, 2, ⋯ , n) in the sequence satisfies formula (9), it is regarded as normal, otherwise it is an abnormal outlier.
For online English teaching, this paper builds an artificial intelligence classroom management model based on improved machine learning. The model results are shown in Fig. 8.
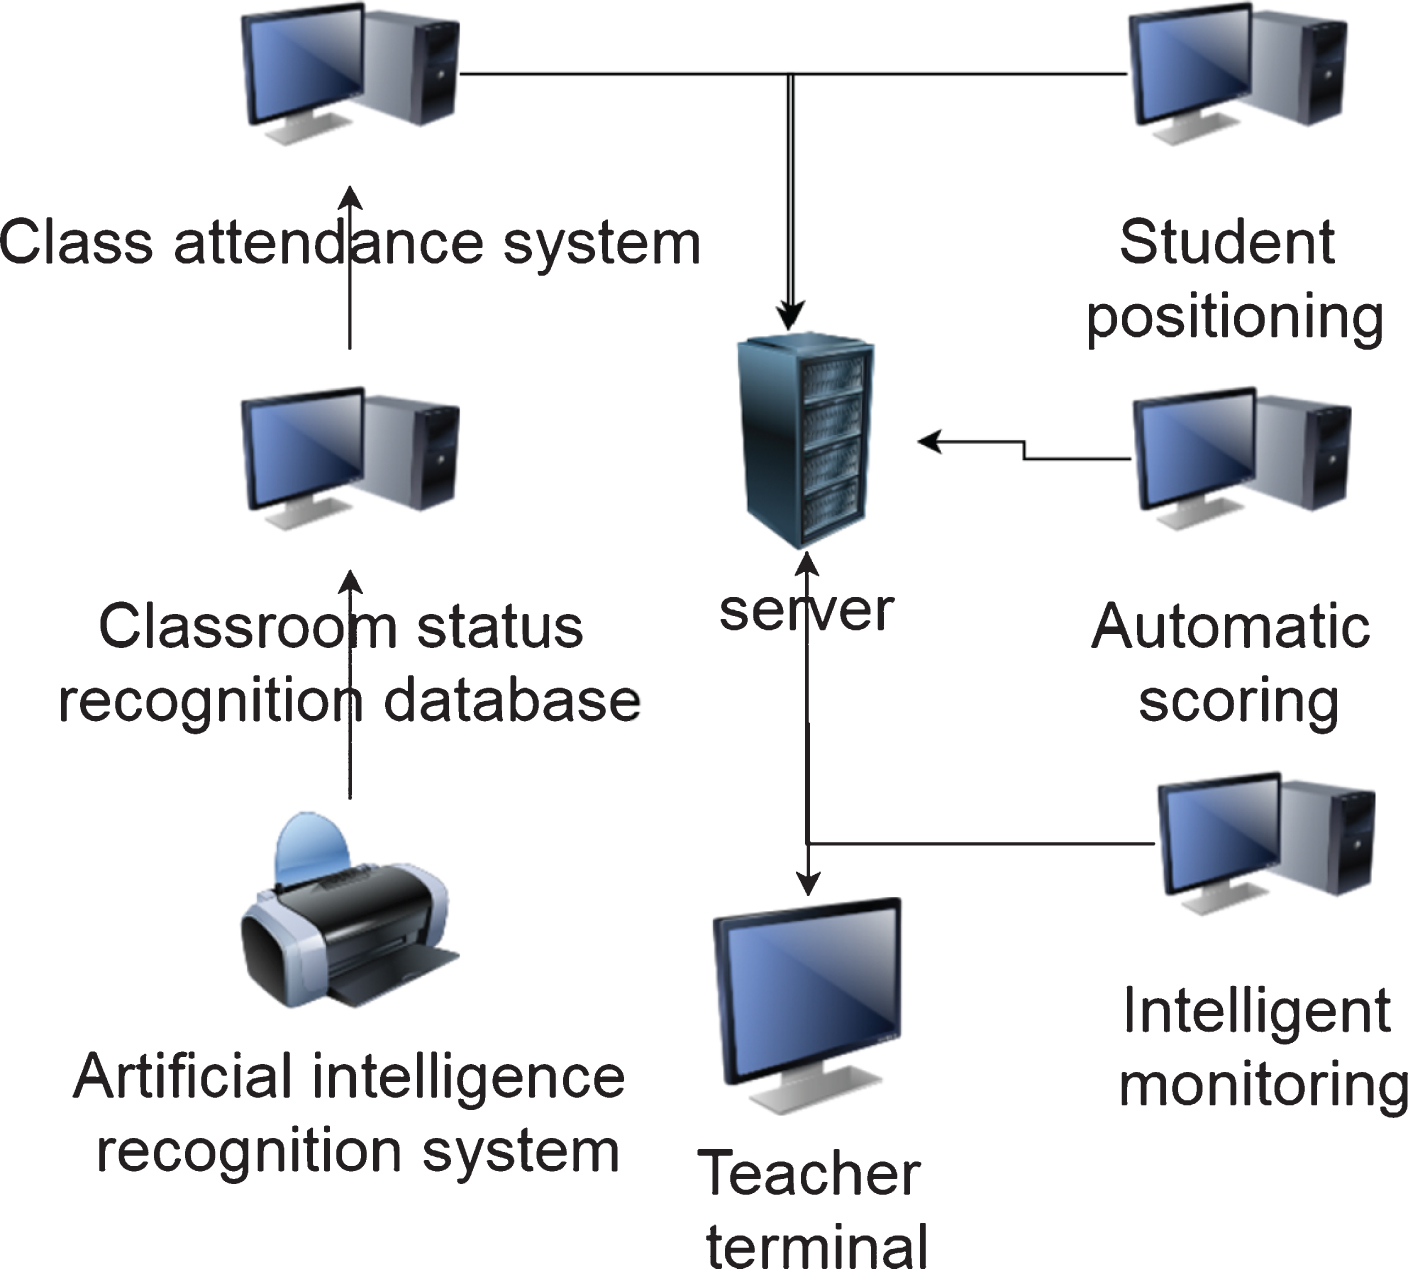
English distance education classroom management model based on improved machine learning artificial intelligence algorithm.
The model structure is relatively simple, and the difficulty of the model lies in the data processing part. The average value is an indicator that reflects the trend of data aggregation and is used to represent the average level of a set of data. The median is the bisector of the frequency occupied by the sample data, is not affected by individual outliers, and is used to represent the general level of a set of data. The robust quartile detection method uses the median instead of the mean to avoid the influence of outliers in the data set on the mean. However, for data groups with abnormal outliers, if all the abnormal values exist on one side of the data, it will affect the effect of the median to reflect the general data level to a certain extent. The interquartile range IQR = Q3 - Q1 is multiplied by a factor of 0.7413 to replace the standard deviation. However, in the case where an abnormal value exists on one side, the interquartile range value is also affected to a certain extent, and it cannot reflect the stability of the overall data well. If outliers exist in a standard normal distribution data column, using the mean value is better than using the median.
Therefore, for the second type of outlier lateral distribution, the newly proposed extreme value mutual difference filtering idea is used. First, this study filters the extreme values in the data column, and then combines the robust quartile detection method to detect abnormal outliers in the data. The main steps are:
(1) We set the median of the sorted sequence as M and the data sorting sequence as X1, X2, ⋯ , X, ⋯ , Xn-1, X n . Moreover, we assume that outliers are only distributed on one side of the data column m, that is, c1 = M - X1, c n = X n - M.
(2) The sizes of c1 and c n are compared. If c1 is large, it means that the outliers are all distributed to the left of the median, and all the values are less than the median. However, if c n is large, it means that the outliers are all distributed to the right of the median, and all the values are greater than the median. We assume that c1 is relatively large and exclude X1 first. After c2 = M - X2 is calculated, the size of c2 and c n are compared.
(3) If c2 is relatively large, X2 is continuously excluded, and c3 = M - X3 is calculated. Until the value of c k is less than or equal to c n , the comparison is stopped. The median M′ and NormIQR′ of the current new series are obtained, and then M′ and NormIQR′ are brought into the original data series for estimation using a robust quartile detection method. The above assumption refers to the case where all the outliers are distributed on the low-end side, and the case where all the outliers are distributed on the high-end side is also obtained in the same way.
According to the calculation formula of the robust quartile z score value, when M is replaced by M′ and NormIQR is replaced by NormIQR′, the change amount w of the z value corresponding to each data is shown in formula (10):
To judge the effect on the data after changing the parameters, according to formula (10), the limit when X
i
tends to M′, Xmin, Xmax is calculated, as shown in formula (11), formula (12), and formula (13).
According to the mathematical meaning of the z ratio, the smaller the absolute value, the closer the value is to the median, and the less likely it is to become an outlier. Therefore, when X
i
tends to M′, the absolute value of the z ratio takes the minimum value. Formula (15) can be obtained by adding the original z ratio to formula (11).It can be seen from formula (14) and formula (15) that the closer the value is to M′, the smaller the absolute value of the z ratio. When the value is exactly M′, the minimum z ratio is 0.
The greater the absolute value of the z-ratio, the farther the value is from the median, the greater the likelihood of becoming an outlier. Therefore, increasing the ratio makes it easier to detect outliers. Since NormIQR′ is the interquartile range after excluding extreme values and the data distribution is more stable, NormIQR′ < NormIQR.
When X i tends to Xmin, the original z score is negative. When M′ is greater than M (that is, the outliers are distributed on the side of the smaller value), the numerator of the minuend number in formula (12) is greater than the numerator of the subtrahend number, and the denominator of the minuend number is less than the denominator of the subtrahend number. At this time, the increment value is positive, so the increment value becomes larger. Moreover, the detection of outliers is easier. When M′ is less than M (that is, the outliers are all distributed on the side of the larger value), the numerator of the minuend number in formula (12) is smaller than the numerator of the subtrahend number, and the denominator of the minuend number is smaller than the denominator of the subtrahend number. At this time, the increment value is not easy to judge the size, and no matter whether it increases or decreases, there will be no great fluctuation. Moreover, it just coincides that the variation range on the side where there is no outlier is small, and the occurrence of “phagocytosis” is avoided.
When X i tends to Xmax, the original z score is positive. When M′ is greater than M (that is, all outliers are distributed on the side of the smaller value), the numerator of the minuend number in formula (13) is smaller than the numerator of the subtrahend number, and the denominator of the minuend number is smaller than the denominator of the subtrahend number. At this time, the increment value is not easy to judge the size, and no matter whether it increases or decreases, there will be no great fluctuation. Moreover, it just coincides that the variation range on the side where there is no outlier is small, and the occurrence of “phagocytosis” is avoided. When M′ is less than M (that is, the outliers are all distributed on the side of the larger value), the numerator of the minuend number in formula (13) is greater than the numerator of the subtrahend number, and the denominator of the minuend number is less than the denominator of the subtrahend number. At this time, the increment value is positive, so the increment value becomes larger. Moreover, the detection of outliers is easier.
If we assume that there are two points A (x1, x2, ⋯ , x
n
) , B (y1, y2, ⋯ , y
n
), then the Euclidean distance between A and B is:
In the formula, the covariance matrix S is defined as:
If the covariance matrix is an identity matrix, the Mahalanobis distance is reduced to Euclidean distance. If the covariance matrix is a diagonal matrix, the Mahalanobis distance becomes a normalized Euclidean distance. The mean μ = (μ1, μ2, ⋯ , μ
p
)
T
is defined as:
According to each given sample X
i
,
The system model has been constructed above, and then the performance analysis of the system model was performed. Combined with actual needs, the two groups of online teaching were tested and analyzed. Among them, Group A and Group B are both 50 people and all adopt online teaching mode. Group A is the test group and Group B is the control group. A statistical analysis of the English scores of Group A and Group B before the experiment was conducted. The results are shown in Table 1 and Fig. 9.
Comparison table of English scores between the test group and the control group before the test
Comparison table of English scores between the test group and the control group before the test
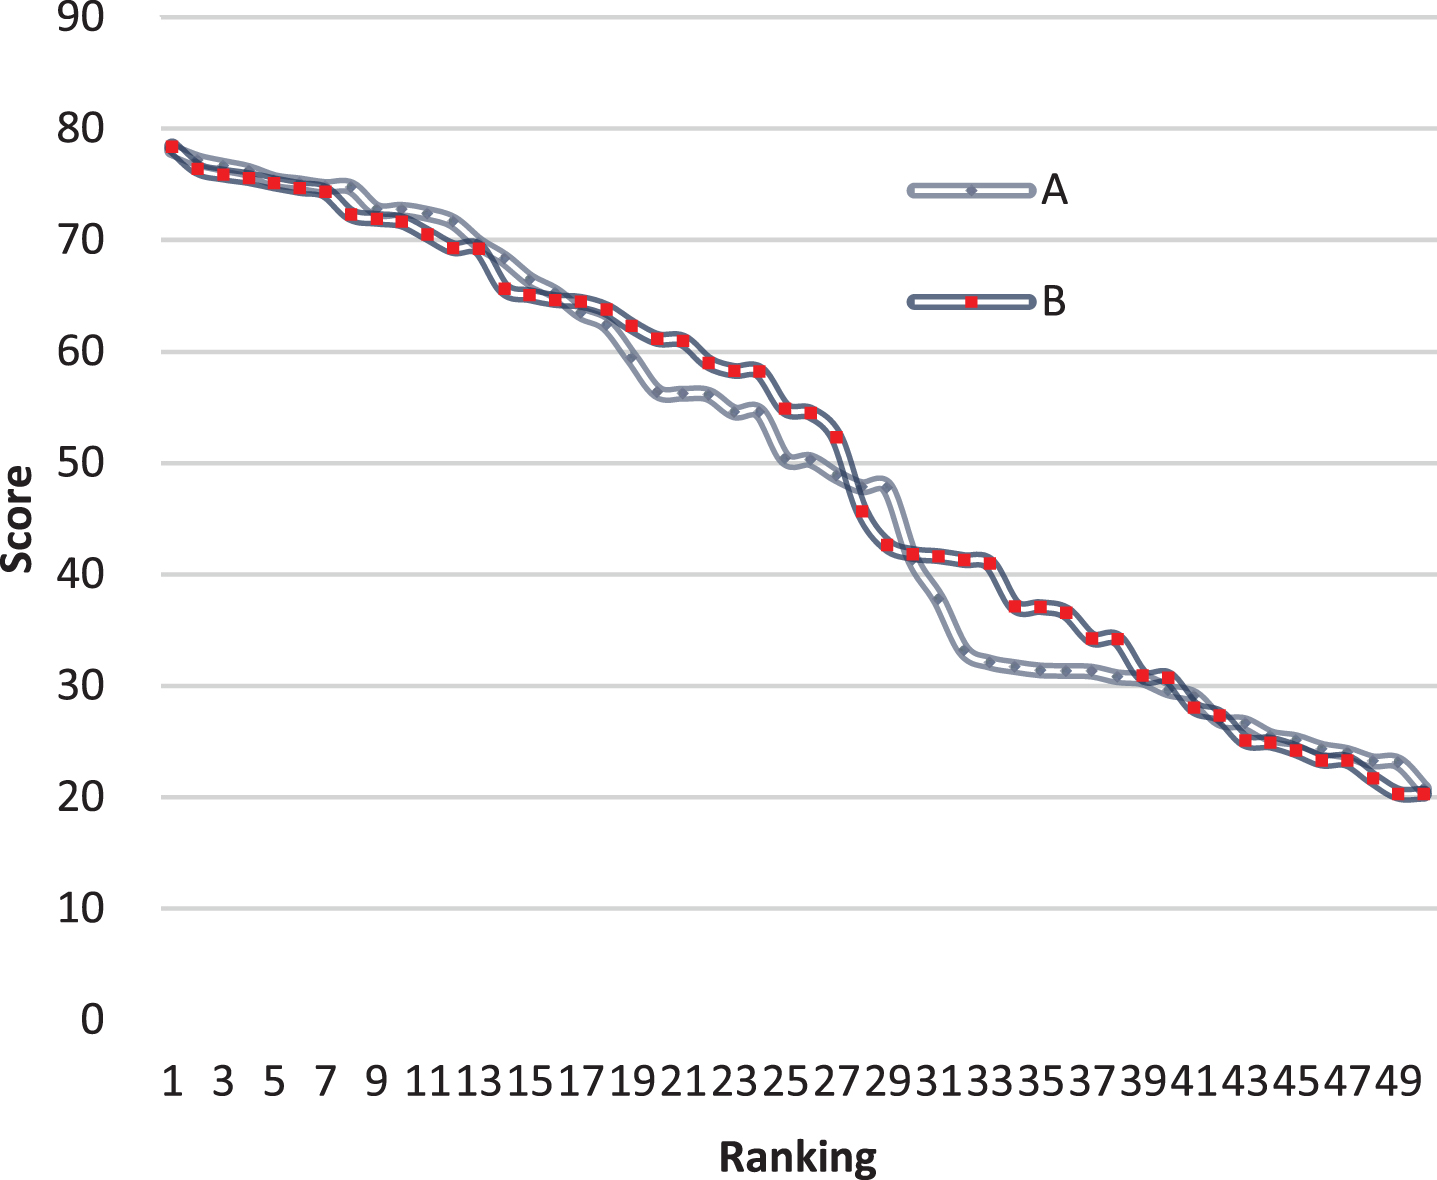
Comparison diagram of English scores between the test group and the control group before the test.
It can be seen from Fig. 9 that the English scores of the test group and the control group are basically the same before the test, which can be considered to be basically the same. On this basis, a semester of English learning is started. The test group used the artificial intelligence system constructed in this article to manage the online teaching, while the control group used the traditional online teaching mode to teach. Various problems in the teaching process were counted, and the results of the two groups of students were finally compared through the final exam to verify the effect of the teaching model proposed in this paper in teaching. The results are shown in Table 2 and Fig. 10.
Comparison table of English scores between the test group and the control group after the test
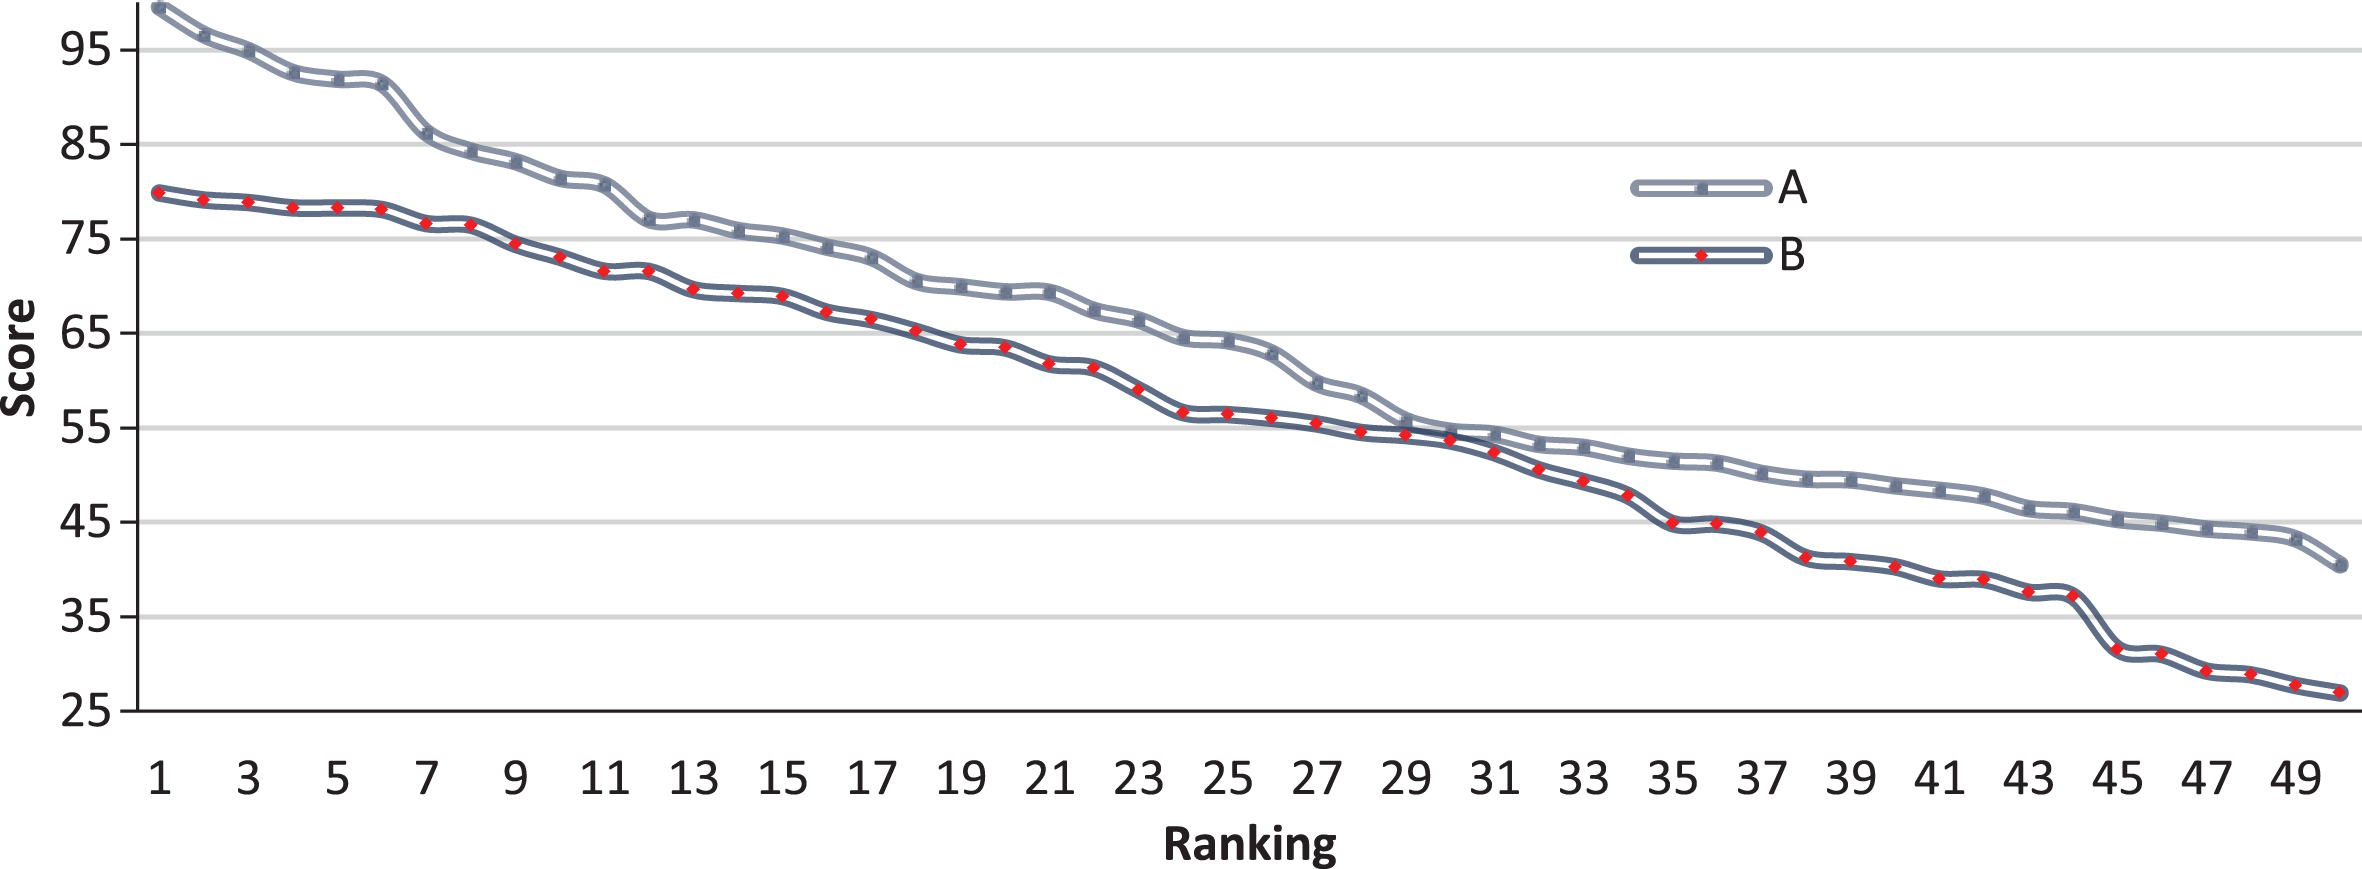
Comparison diagram of English scores between the test group and the control group after the test.
As shown in Fig. 10, the results of the test group and the control group shows a significant difference after one semester. The test group’s results are significantly higher than the control group, and the difference in teaching methods is only the system used.It can be seen that the artificial intelligence English distance education classroom management system constructed in this paper has obvious effects.
In the distance teaching process, teachers cannot control students in real time, and students have a high degree of freedom, which results in students being unable to concentrate on the lectures, and teachers are unable to grasp the students’ learning status in time. Based on this, this paper combines artificial intelligence machine learning algorithms to improve the algorithms and builds an intelligent online English education classroom management system. Moreover, this article combines artificial intelligence and GPS to perform intelligent positioning of the student’s location, design the overall framework of the intelligent classroom management system, and analyze the specific needs of the physical layer, gateway layer, and server layer according to functions. In addition, this study designs and implements modular functions according to the needs of various levels and designs an artificial intelligence teaching system that is in line with actual classroom management. Finally, this study analyzes the performance of the system model, and combines the actual needs to conduct an experimental analysis of the two groups of online teaching and uses the English test scores as a quantitative comparison method. It can be seen from the research that the scores of the test group and the control group are significantly different after one semester, and the scores of the test group are significantly higher than the control group. It can be seen that the artificial intelligence English distance education classroom management system constructed in this paper has obvious effects.