
Abstract
Intelligent video analysis has broad application prospects. How to automatically analyze and identify human behavior in video has attracted extensive attention from researchers at home and abroad. Moreover, researching effective video behavior recognition algorithms and designing efficient behavior recognition systems has important theoretical and practical value. This paper studies the nonlinear classification technique and applies the video behavior recognition algorithm to basketball recognition. Moreover, this paper studies the classical convolutional neural network model and several improvements. In addition, this paper explains the advantages of convolutional neural networks in feature extraction compared with traditional neural networks and analyzes the performance of the algorithm by designing actual experiments. The research results show that the algorithm can quickly identify multiple players on the field, and the method can effectively deal with occlusion and other issues with high accuracy and real-time.
Introduction
The scientific and technological level of sports training in China has been relatively low for a long time. Most of them use subjective and experience-based teaching methods. The trainers use the naked eye and experience to guide the technical movements of the athletes, and the athletes can only master the technical essentials through repeated repetitive exercises, which have seriously affected the further improvement of the level of sports in China. How to easily and quickly understand the training level of athletes, accurately obtain the athletes’ various sports parameters, and provide assistance for the athletes’ 1:3 regular training has become a top priority for the majority of sports science and technology workers [1]. The modern Olympics are no longer purely to compete in which country’s athletes run faster, jump higher and lift more. Behind the contest between athletes and athletes is a comprehensive competition between the state and the country for the development of science and technology and the convergence of people. The refreshing of the records in the Olympic Games is not only the embodiment of human breakthrough in physiological limits, but also the concentrated display of technological innovation in sports [2].
In recent years, with the popularity of video capture devices and the increasing performance of computers, a large amount of video has been stored in digital form. Effective use of this resource will provide a wealth of valuable information for various industries and sectors. After long-term practice and research, sports experts at home and abroad agree that [3]: the introduction of digital video technology in sports training can greatly improve the training efficiency. The introduction of digital video technology in sports training is to capture the training and competition process through the camera, and to automatically analyzes the information that is highly concerned by sports professionals, such as athlete postures and movements, which are included in the captured video sequence, and displays them to the coaches and athletes in an intuitive form. In this way, it enables the athlete and the coach to save time and effort to obtain the technical parameters of the completed action. Moreover, it helps athletes master the technical essentials as soon as possible during the training process, and reduces unnecessary repetition, and achieves the purpose of intuitive teaching and quick feedback. In addition, it can greatly reduce the possibility of athletes being hurt. Compared with the traditional method of adding sensors to the athlete’s body, the digital video-based sports training technology is a contactless method, which is carried out under the condition of no interference to the athletes and can directly obtain the most realistic athlete action posture information. Therefore, this has positive significance and broad application prospects for improving the training efficiency and competitive level of athletes and realizing the scientific and technological development of sports [4].
How to use computer image processing, video analysis and other technical means to improve the scientific and technological content of sports training and improve the effect of sports training has become one of the research hotspots in the field of computer vision and image processing.
Related work
At present, many universities and research institutions at home and abroad have carried out research on introducing digital video technology into auxiliary sports training. The most famous foreign research institutes are the Media Analysis Laboratory of the Massachusetts Institute of Technology, the Digital Video/Multimedia Laboratory of Columbia University, the School of Engineering and Applied Science of the University of Rochester, the Department of Computer Science of the University of Texas at San Antonio, the Multimedia Analysis Laboratory of the University of Delft in the Netherlands, and the Microsoft Research Institute of Asia, the American Institute of NEC, the American Institute of Mitsubishi Electric, and the Institute of Information and Communication of Singapore. The domestic research institutions mainly include the Advanced Human-Machine Communication Laboratory of the Institute of Computing Technology of the Chinese Academy of Sciences, the State Key Laboratory of Pattern Recognition of the Institute of Automation of the Chinese Academy of Sciences, the Digital Media Institute of Peking University, and the Visual Intelligence Interface Research Office of Harbin Institute of Technology [5].
According to the complexity of the current research object, the existing research can be divided into two levels: the analysis of single individual movement and the analysis of multi-person group movement [6].
At present, the study of single individual sports is mainly reflected in the athlete’s motion recognition and analysis. Pennsylvania State University develops intelligent systems to help diving coaches and athletes enhance their understanding of the overall body posture during diving [7]. Duan. Wang M et al. [8] judge the interception or bottom line in a tennis match by analyzing the trajectory of a tennis player. Tsinghua University’s “Video-based Diving Motion Attitude Analysis System” uses target detection and tracking technology to extract moving targets from diving video and adopt video synthesis for moving targets [9]. Karmali F et al. [10] proposed a motion recognition method based on the Curvature Scale Space Template of the human contour and applied it to the motion recognition of players in tennis matches. Literature analyzes the movements of ice hockey and soccer players, and uses the Histogram of Oriented Gradient (HOG) to identify the movement direction of the players. Cutled [10] proposed a method to identify periodic motion. Plappert M et al. [11] proposed an Appearance.based method to identify and mark a series of actions such as OvershoulderSwing, Foreside Swing and Backside Swing in tennis matches. This method is further extended in the follow-up work and combined with the position information of the players and the ball to propose a motion recognition method based on reasoning. Renyun Z et al. [12] used TBM (Transferable Belief Model) to identify the back-to-back jump, pole vault, and triple jump in track and field events. In recent years, with the maturity of individual cell movement analysis research, research on multi-person group sports such as basketball and football has gradually been smothered. Moreover, the mining and extraction of skills and tactics in such sports has also become an important development direction. Ji [13] first introduced tactical analysis into sports video research and attempted to establish quantitative criteria for teamwork in football matches. In order to judge the control of the two teams on the field, the shortest moving time feature is introduced to measure the distance of a certain player on the field to a certain point on the court. After that, the points controlled by the two teams are counted as the actual control areas of the two teams, so that the control areas of the two teams at each moment are compared as the standard for measuring the team’s ability to cooperate. Yao Q et al. [14] studied the passing mode of soccer games in favor of scoring and used multi-scale analysis methods to hierarchically cluster the passing and mining the mode categories of passing. Wang [15] classifies the scoring situation by using the trajectory and falling point of the ball in the tennis match as a feature and merging the two features using a modified Bayesian network. The tactical analysis eventually classified the scores into 58 categories to facilitate different user queries. Zhou [16] proposed a method for analyzing the ball control situation of two teams in football video. Based on the position of the ball and the detection of the interval of the game, the method uses the local minimum point of the ball trajectory speed as the starting point of the ball control of a certain player, and uses the local extreme value of the ball position coordinate, the position of the player, and the acceleration starting point of the ball to infer the player’s touch point. Finally, the method uses a support vector machine to determine which player is currently controlling the ball. Roudposhti K K [17] analyzed the cooperation of the goals in the football video and the referee’s grasp of the scale of the foul. This method is also based on the tracking of the ball and the player to obtain visual features and uses the heuristic method to achieve automatic classification of tactics. Using advanced analysis tools, we can analyze indicators such as moving trajectories and angles, calculate speed or verify key technologies and locations. Powerful motion recording analysis software, equipped with computer and video equipment, can immediately discover technical problems without interrupting training. We can also directly burn large-capacity motion recordings and analysis results on CDs to exchange and save research results or publish them on the Internet to help build a video database for research. The literature [18] addresses the various problems in the field of vehicle communication with the suggestion of a mutual unified and dispersed spectrum sensing model. The application of the mutual cognitive paradigm minimizes conflict and multiple unknown problems. The literature [19] discusses the problem of vast volumes of big data and introduces the SmartBuddy idea of an adaptive and smart world incorporating human activity and human dynamics. The literature [20] talks about the development in parallel reconfigurable computing systems of a directed acyclic graph for video coding algorithms for motion estimation. Partitioning algorithm also plays a major role in speeding up the production of images. The article [21] deals with leveraging IoT and BigData Analytics in real-time applications using the Hadoop platform. The above-mentioned processes enable the deployment of an IoT-based Smart City. The article [22] centers on IoT and its major part in sophisticating the human practices and endeavors. This paper moreover managed with the collection of different information from different assets that are associated to the web [23, 24].
Motion foreground detection based on mixed Gaussian model
After obtaining a video sample, the first thing to do is to separate the moving target from the background (that is, foreground detection) in order to extract and classify the motion features. When an area is monitored with a fixed camera, the background remains almost unchanged and can be obtained in advance. In such an application scenario, the region of interest is the moving target (people, cars, etc.) in its foreground. In order to segment these foreground objects from the background, we usually need to model the background, and then compare the current frame image with the background model to detect the foreground object. The step of foreground extraction is almost the basis of intelligent monitoring applications. The main means of foreground detection include frame difference method, median filtering method, optical flow method, background statistical model method, codebook model and so on.
There are two main application environments for foreground (moving object) detection: fixed cameras and moving cameras. For the foreground detection problem that the camera is in motion, the optical flow method is a better solution. By calculating the optical flow field of the image sequence, the motion state of the camera is predicted. However, due to the complexity of the optical flow calculation, it is difficult to achieve real-time calculations. For most surveillance cameras, the camera is at rest and there is no need to waste a lot of time calculating the optical flow field. The Gaussian Mixture Model (GMM) used in this paper belongs to one of the background statistical model methods, which is suitable for separating the background and the foreground from the sequence of video frames in the case of a static camera. In the application scene where the camera is still, the background changes are mostly slight or gradual changes in the influence of light, wind, and the like. In general, the foreground is the target of exercise. Hybrid Gaussian models have been widely used in foreground detection of many complex scenes and are particularly suitable for changes in the background that appear as tiny periodicity, such as swaying leaves, rotating fans, slightly undulating seas, falling rain and snow, and changes in light reflections. At the same time, the hybrid Gaussian model can basically meet the real-time requirements of the algorithm in practical applications.
The GMM model has three parameters, one is the mixed weight value ω, the second is the mean vector μ, and the third is the covariance matrix ∑. The value of each pixel can be represented by a superposition of K (usually between 3-5) Gaussian distributions, so that the above parameters can be uniformly expressed as
In the formula, η is the probability density function of the Gaussian distribution,
The first step in the algorithm is to take the first n frames of images for training. In the initialization phase, the mean value of the first single Gaussian distribution of the first frame image is assigned to the value of each pixel in the first frame image, the weight is initialized to 1/K, and the variance is assigned
In the formula, δ is a multiple of the preset standard deviation, and t - 1 represents the previous frame. If the value of the pixel satisfies the equation (3), it indicates that the point is the background point determined by the i-th Gaussian model, and the model should be updated by the following formula:
In the formula, α is the learning rate of the model, and ρ is the learning rate of the parameter. When the number of training frames is reached, the Gaussian distribution in the model is arranged from large to small by
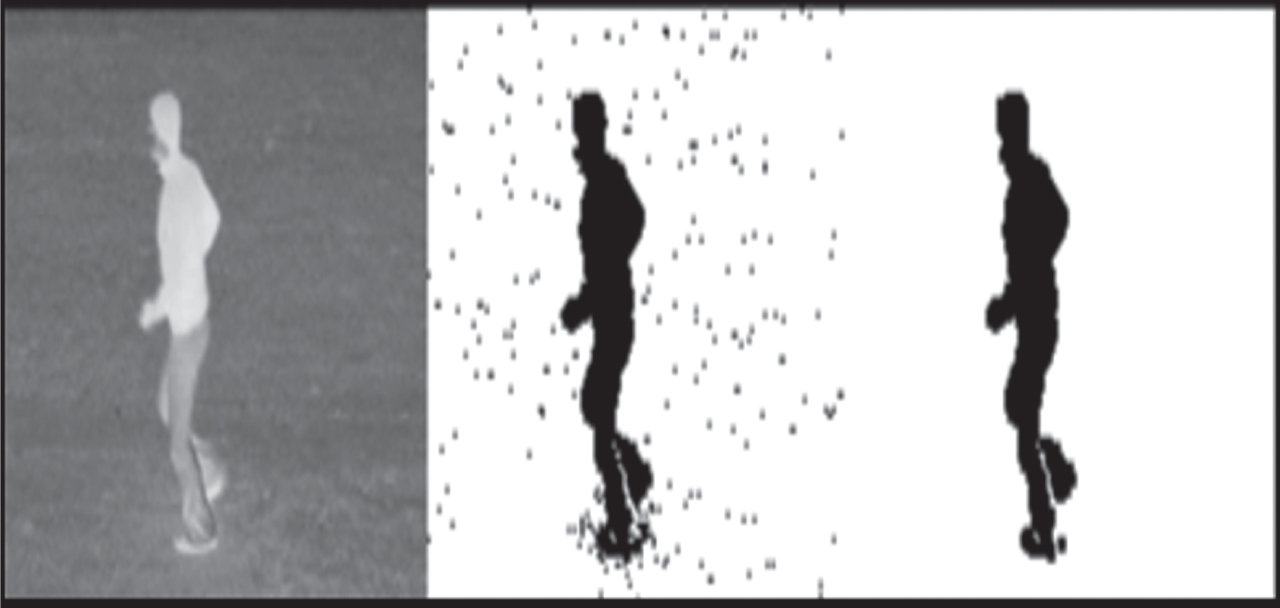
The moving target extracted by the Gaussian mixture model.
The method expresses information on a video action space with a contour and expresses information of a video action time sequence by the intensity of the pixel. The closer the time is, the closer the motion is to the current frame, and the higher the gray value of the pixel of the motion shape.
The specific method is as follows: if the pixel intensity at (x, y) in the t-frame I is I (x, y, t), the pixel intensity of the binarized image obtained by the frame difference method is
In the formula, Δ is the interframe distance. Update parameters ψ (x, y, t) are defined:
In the formula, ξ is the artificially given difference threshold. Thus, the pixel intensity of pixel (x, y) in the motion energy map E can be defined:
In the formula, τ is the duration. The motion history image H is further defined as Equation 11. The closer the moving target is to the current frame, the stronger the pixel:
In the formula, δ is the decay parameter of the pixel intensity. Figure 2 shows the process of extracting MHI from the original video.
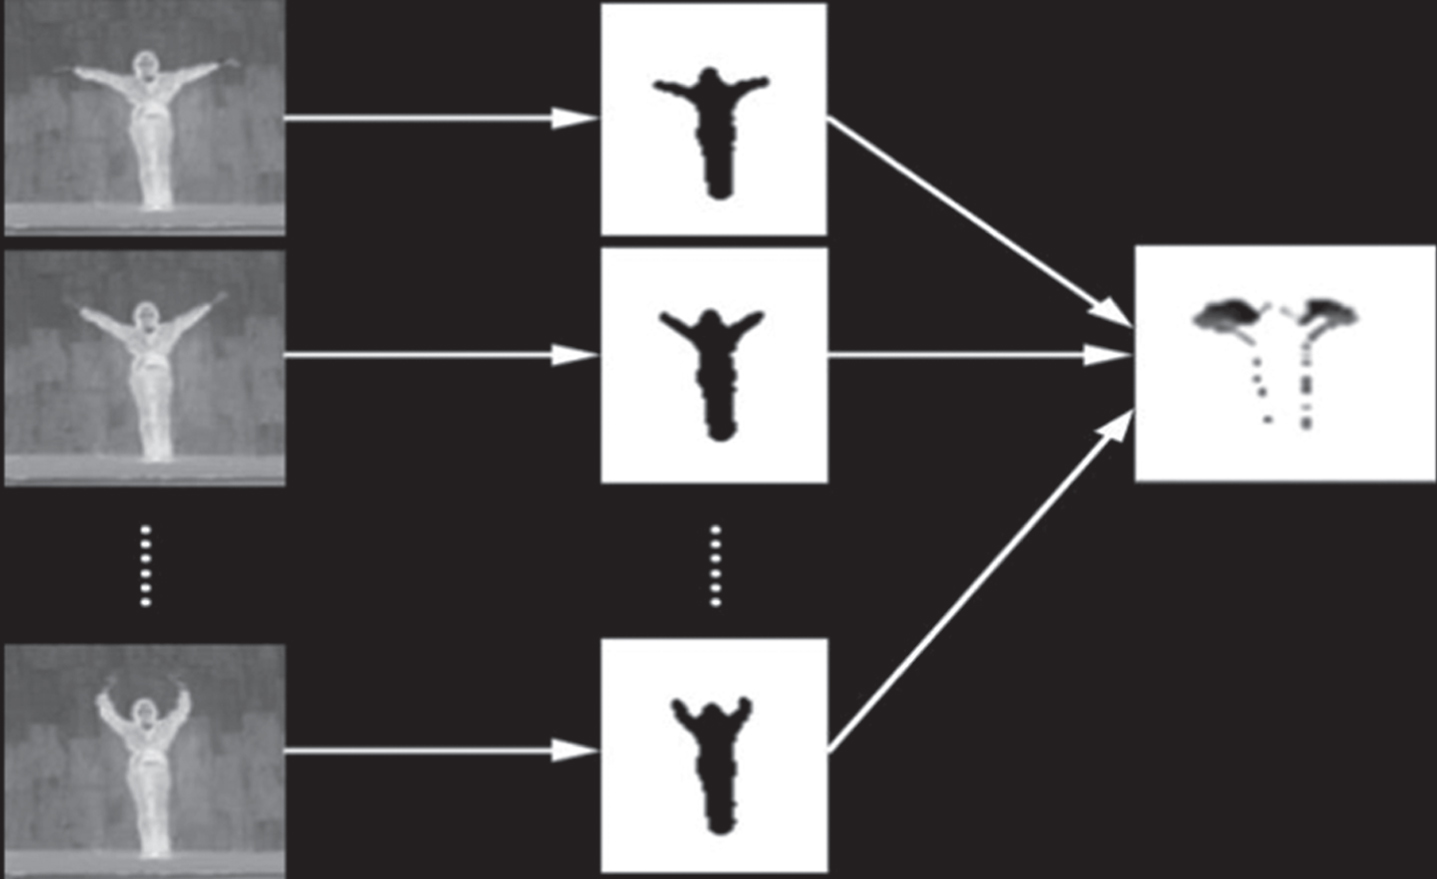
The process of extracting MHI from the original video.
When a pair of MHIs is generated from the video, the selection of the duration τ has a large effect on the generated MHI. As shown in Fig. 3, the video shows the action of raising the left hand and waving to the right side of the head, 26 frames in length. We take δ to be fixed at 1 and take τ = 10, 15, 20, 50, 100 and 250 respectively to generate 6 MHIs. If τ is small, such as 15, the generated MHI will lose motion information for frames 16 through 26. On the other hand, if the value of τ is longer than the duration of the action in the video sample, the change in the pixel intensity value in MHI will become less noticeable, similar to the effect of MEI, losing the meaning of extracting MHI. For example, in the lower right corner of Fig. 3, we take τ = 250, which is about 10 times the total length of the video. At this time, the non-zero pixel intensity values in the figure are very close, and it is difficult to judge whether the arm’s moving direction is to wave to the left or to put the hand down. Therefore, when generating MHI, we must consider the impact of this on the mapping.
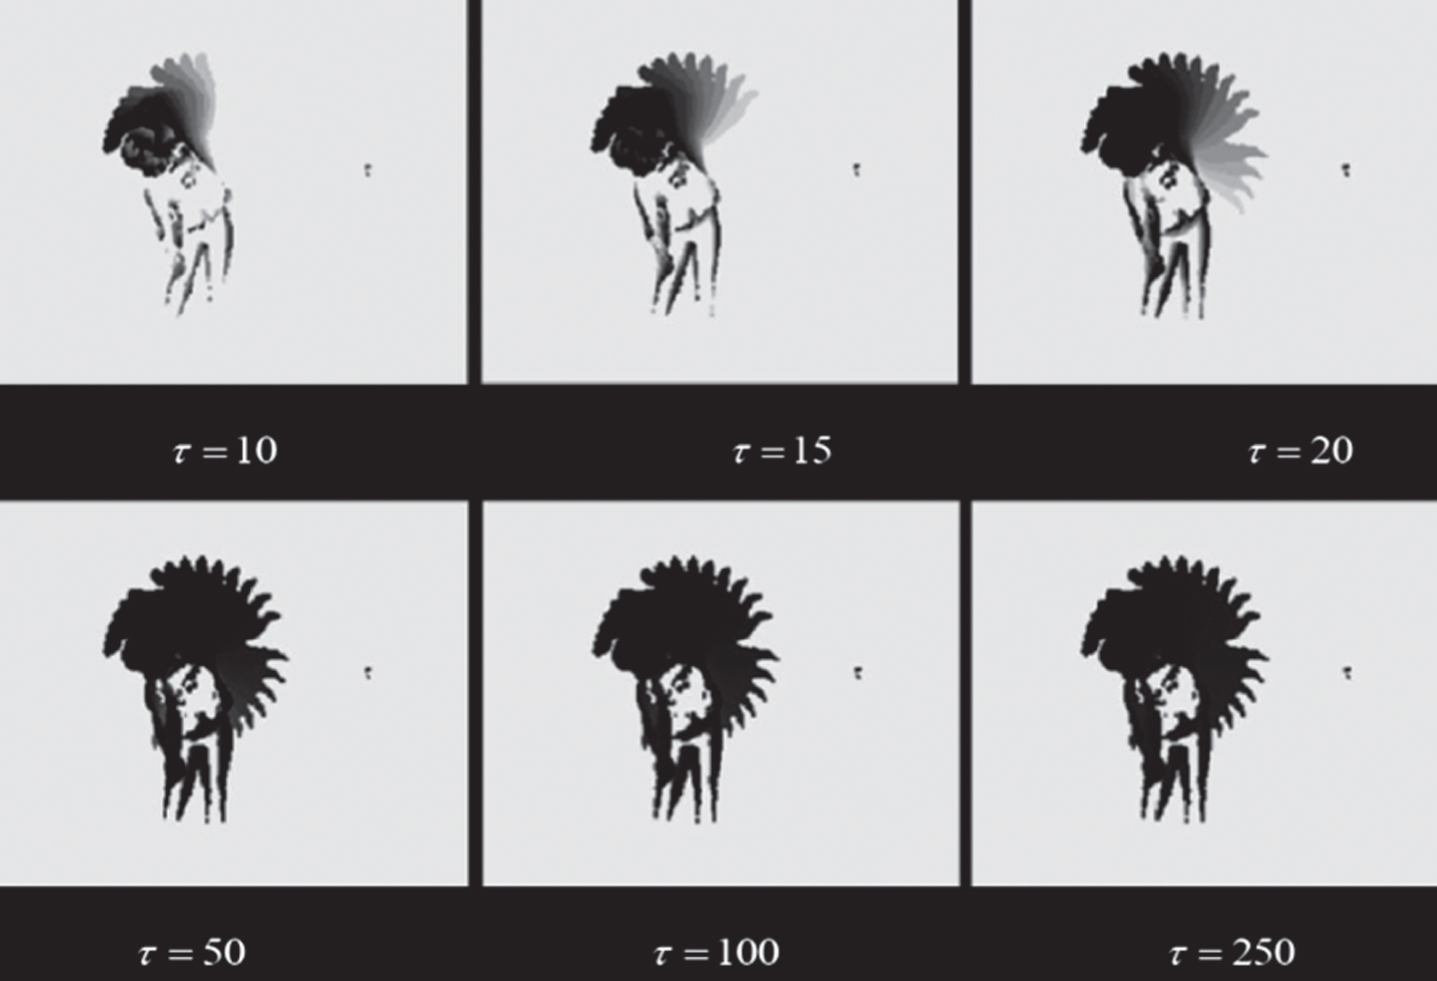
Effect of parameter τ on generating MHI.
The magnitude of the decay parameter δ also has a significant effect on the generation of MHI. In the article by Bobick et al., the value of δ is usually taken as 1, but in practice, taking different δ values will change the information provided by the motion history map. Therefore, δ can take the corresponding empirical value according to the research needs. The role of δ is to attenuate the gray value of the pixel area in the previous frame that has not been actuated in the current frame according to the size of δ. As shown in Fig. 4, to raise the right-hand movement, we take δ = 135 and 110 respectively. It can be observed that as the value increases, the “smear” of the motion profile in the figure, that is, the portion where the motion occurs earlier, is eliminated more.
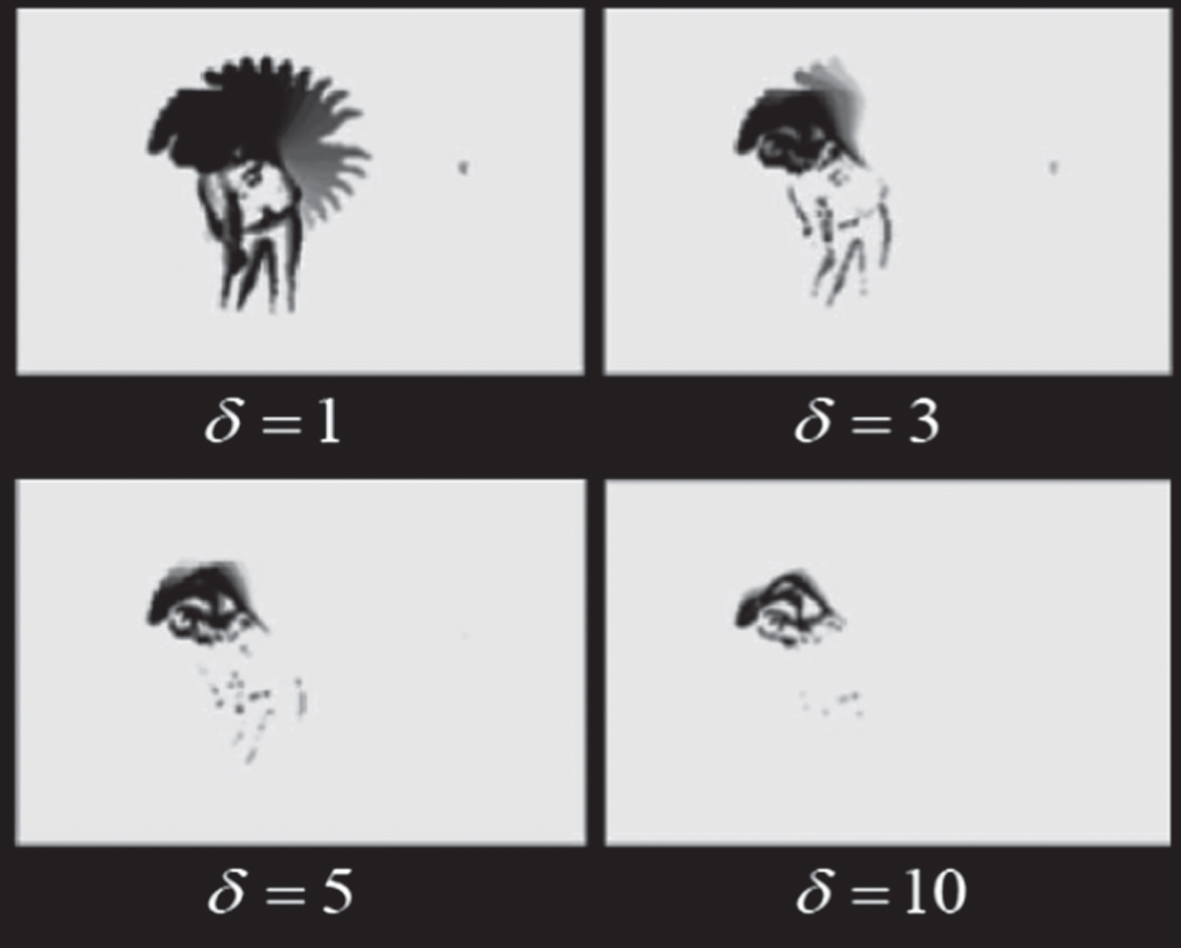
Effect of decay parameters on MHI.
In addition to this, the difference threshold ξ is also one of the important parameters of the motion history map. In the four motion history diagrams shown in Fig. 5, the difference thresholds are sequentially increased from left to right, which are ξ = 30, 50, 75 and 150, respectively. It can be observed that when the threshold is too small, the motion foreground and background cannot be well distinguished, which results in the background of the motion history map being full of noise. The background noise gradually disappears as the difference threshold increases, and a “cavity” appears in the center of the motion region. The cavity increases as the threshold increases until only the edge portion of the motion remains in the motion history map. In some application studies using motion history diagrams as templates, we need to pay special attention to the impact of the difference threshold on the motion profile template.
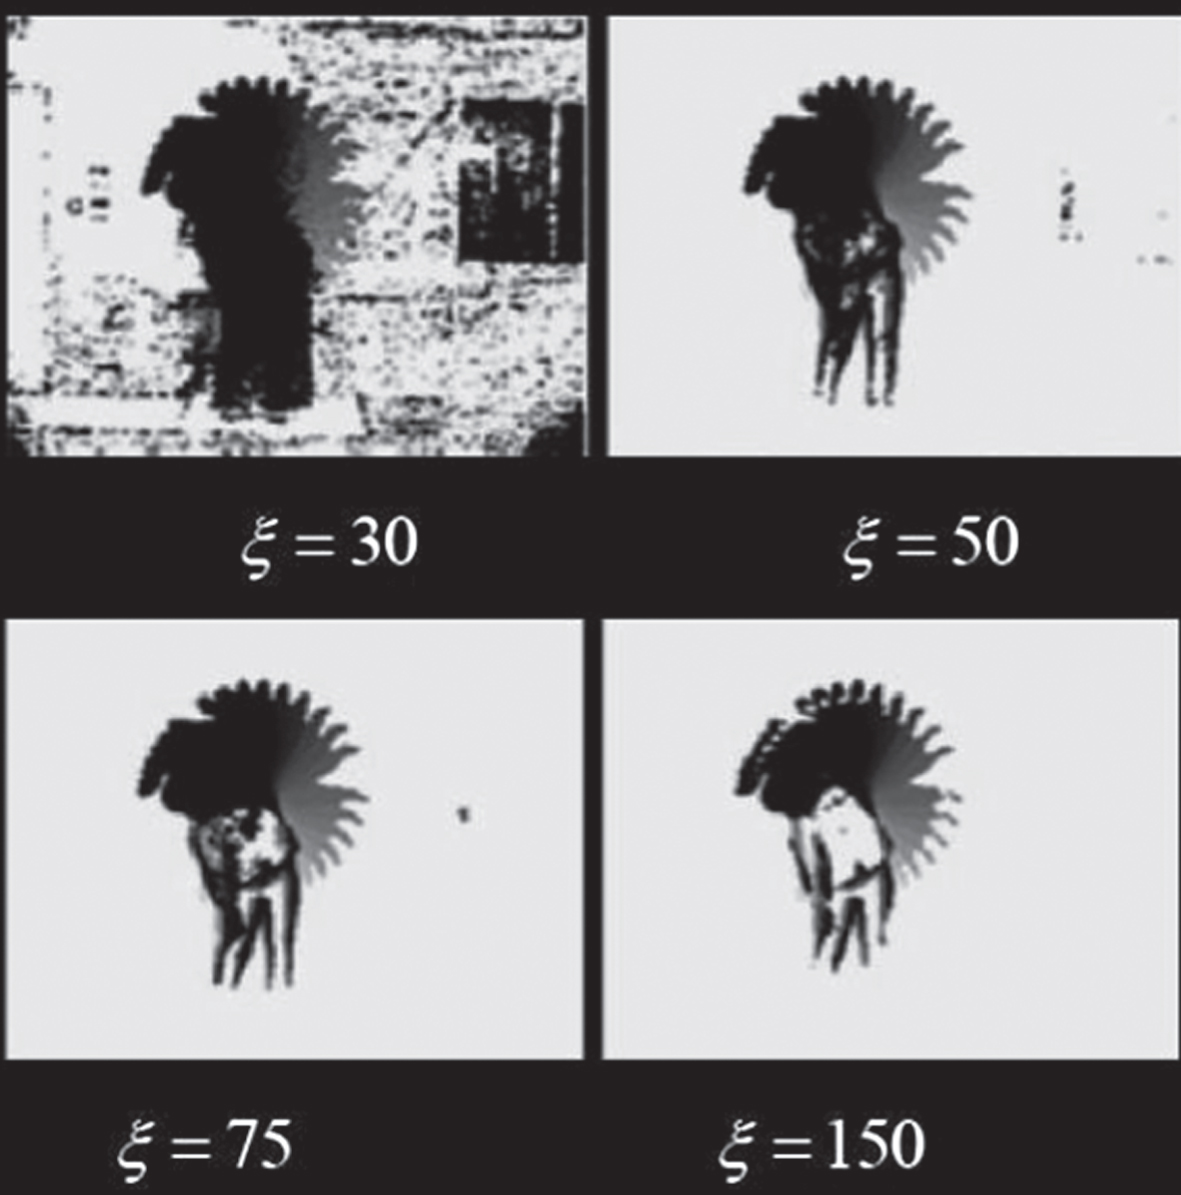
Effect of difference threshold on MHI.
After getting the MHI of the video behavior sample, the next question to consider is how to classify these behaviors. Histogram of oriented gradient (HOG) is a feature discriptor used for target detection in the field of computer vision and image processing. The method is to count the direction gradient information of local regions in the image, which has many similarities with Edge Orientation Histograms (EOH), scale-invariant feature transforms, and shape contexts. The difference is that the HOG feature is calculated on a small area of the same size on the image, and in order to improve performance, an overlapping local contrast normalization technique is also employed.
Dalal and Triggs of the National Institute of Computer Technology and Control in France first proposed the HOG characterization descriptor and first published a paper on HOG in 2005. In this article, HOG is mainly applied to pedestrian detection in still images, and then HOG feature descriptors are also applied to pedestrian detection in video, as well as detection of vehicles and common animals in still images.
The basic idea behind the HOG feature descriptor is that the appearance and shape of the target of a local region within the image can be described by the distribution of intensity gradients or edge directions. The image is divided into small connected regions called cell units, and for the pixels within each cell unit, a histogram of the gradient direction is calculated. The resulting HOG feature descriptor is a cascade of these histograms. To improve accuracy, you can calculate the pixel intensity on a larger block on the image and then use that value to normalize the contrast across all cells within the block. This normalization gives better invariance to changes in lighting and shadows.
The HOG feature has several key advantages over other similar feature descriptors. Since the HOG feature operates on local cell units, it is invariant to geometric and photometric transformations in addition to the orientation of the target. This change will only occur in larger areas of space. In addition, Daal and Triggs found that coarse spatial sampling, fine-direction sampling, and strong local optical normalization allowed pedestrians’ limb movements to be ignored. This ignore is based on the premise that pedestrians can maintain a generally upright posture. Therefore, HOG feature descriptors are particularly suitable for human detection in images.
The process of extracting HOG features from MHI can be done by following these steps:
First, the gradient of the horizontal and vertical directions of the sample image is calculated, and the magnitude and direction of each pixel gradient are calculated accordingly. The formula for calculating the gradient is as follows:
In the formula, I (x, y) represents the pixel intensity value of the image at (x, y) point, G x (x, y) represents the gradient in the horizontal direction, G y (x, y) represents the gradient in the vertical direction, and G (x, y) and θ (x, y) represent the magnitude and direction of the gradient at the pixel point (x, y), respectively. Through this step, we can get the contour information in MHI.
Second, the pixels in the MHI image are divided into a plurality of cells, the cells do not overlap, and a descriptor for each cell is formed. In this experiment, each cell contains 6 × 6 pixels and nine direction channels are set in each cell. The statistical method of each unit gradient histogram is to use the previously calculated gradient direction to determine which direction channel the pixel belongs to, the gradient magnitude is used to pass the direction pass, and finally the descriptor of each unit is formed by weighted voting.
Local normalization of the gradient intensity can cope with changes in the contrast between the local light in the picture and the foreground-back view. We use a rectangular block of size 2 × 2 to include multiple cells in the block. The descriptor of the block is formed by the descriptors of the cells in the series block. The overlap between the blocks means that the feature vectors obtained by concatenating the descriptors of the blocks in the end will include the characteristics of each cell multiple times with different results. The features of all the cells in a block are concatenated to obtain the HOG feature descriptor of the block.
After extracting the HOG features from the MHI of the video samples, this paper will use the Kernel-based Nonlinear Representor, KNR, which has the best representation ability for the features, and compare it with the classic KNN, linear SVM and Gaussian kernel-based SVM classifier in subsequent experiments.
The structure of the KNR classifier is shown in Fig. 6.
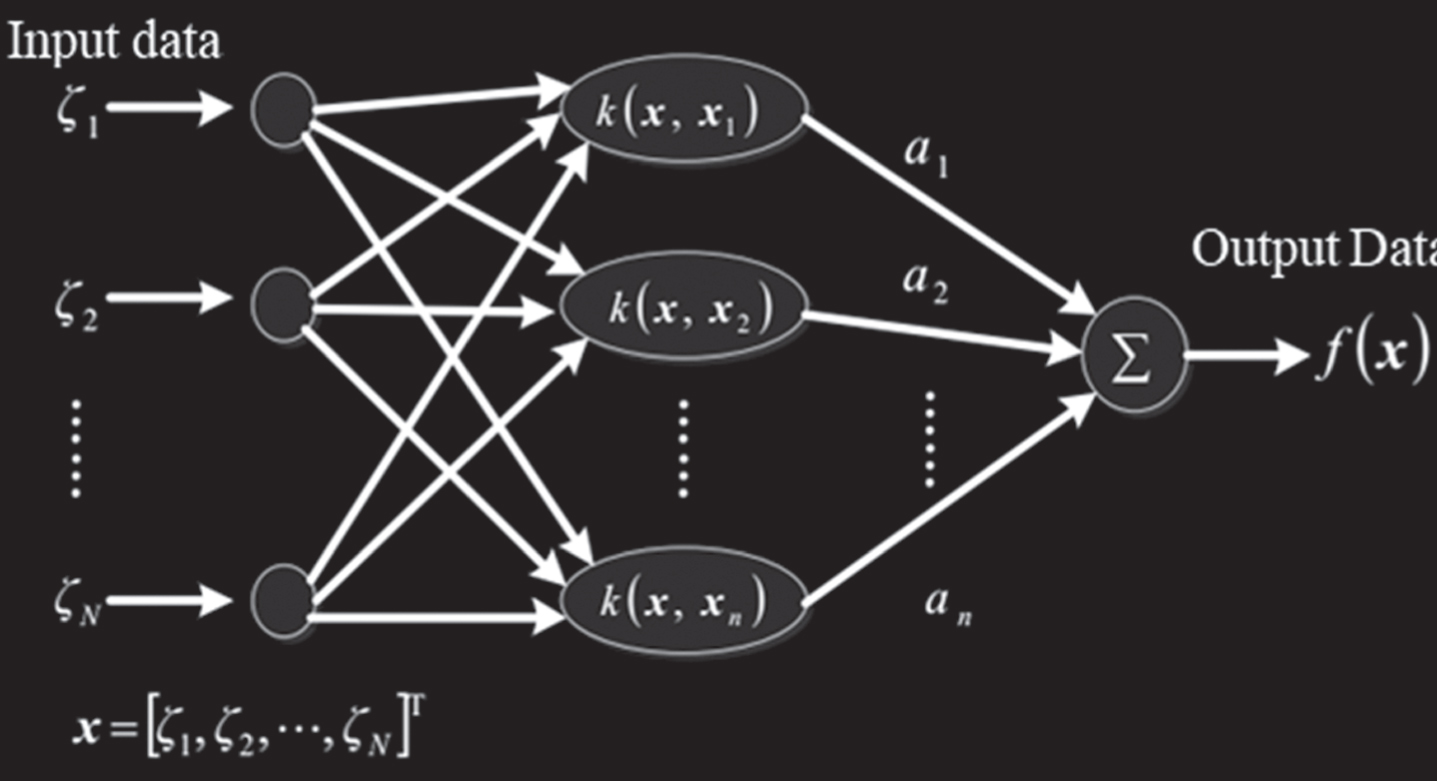
KNR structure diagram.
We assume that the discriminant function of the pattern feature belongs to the Hilbert space of the regenerative kernel, x
i
is the i-th training sample set, x is the test sample, and the corresponding kernel function k is defined as:
Then the decision function is superimposed by multiple kernel functions, which are expressed as follows:
In the formula, a is a coefficient vector. Training the KNR classifier is to train a coefficient vector a
i
for the i-th category. Each coefficient vector is defined as follows.
In the formula, K+ represents the Moore-Penrose of the kernel matrix.  ,
,  Moore-Penrose
  .
.
When using KNR classification in the experiments in this paper, an important part is the choice of parameters in the kernel function. The kernel function chosen in this paper is a Gaussian kernel function:
In order to improve the efficiency of basketball object segmentation, this paper makes full use of the basic characteristics of basketball in the previous frame according to the time correlation of basketball and uses the inter-frame tracking method to segment the basketball in subsequent frames. First, the basketball object template is created by using the basketball region segmented in the previous frame, and then the object model is further established. Then, this study uses AdaBoost to detect images at two levels, and based on the basketball object template, the effectiveness of the tracking results is detected. If the basketball area tracking is valid, the object template will be updated, and if it is invalid, the basketball detection algorithm will be restarted.
With the initial basketball test results, we can design a basketball tracking algorithm based on the search strategy and matching principle. Considering the complexity of basketball, this paper uses the global search method instead of the original DS method. In order to overcome the influence of basketball and environment on the color and edge characteristics of basketball itself, this paper chooses AdaBoost algorithm based on Haar-like feature to match basketball objects. After completing the initial segmentation of the basketball object, the coordinates and radius of the basketball are obtained, and the search area is established centering on the center of the basketball. Firstly, the AdaBoost basketball object is positioned at a low resolution, and the relative center coordinates and radius of the basketball are obtained to establish a search area, and then the image is interpolated, and then the final positioning is performed by using the AdaBoost algorithm.
The experiment selects some data in the basketball video and image database of the two games as test data. The experimental results are shown in Table 1. Figures 7 and 8 show the results of a basketball segmentation of a game video.
Experimental processing time
Experimental processing time
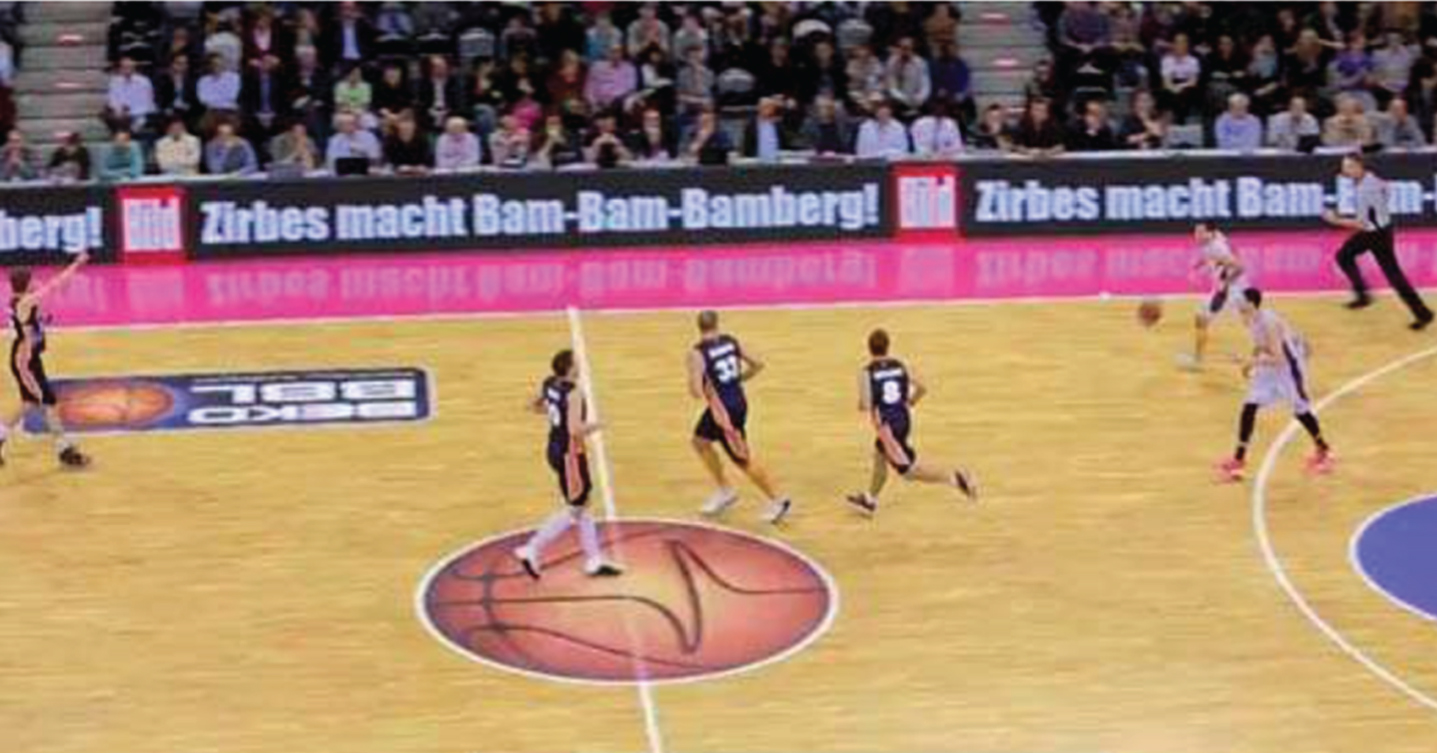
Original image of database.
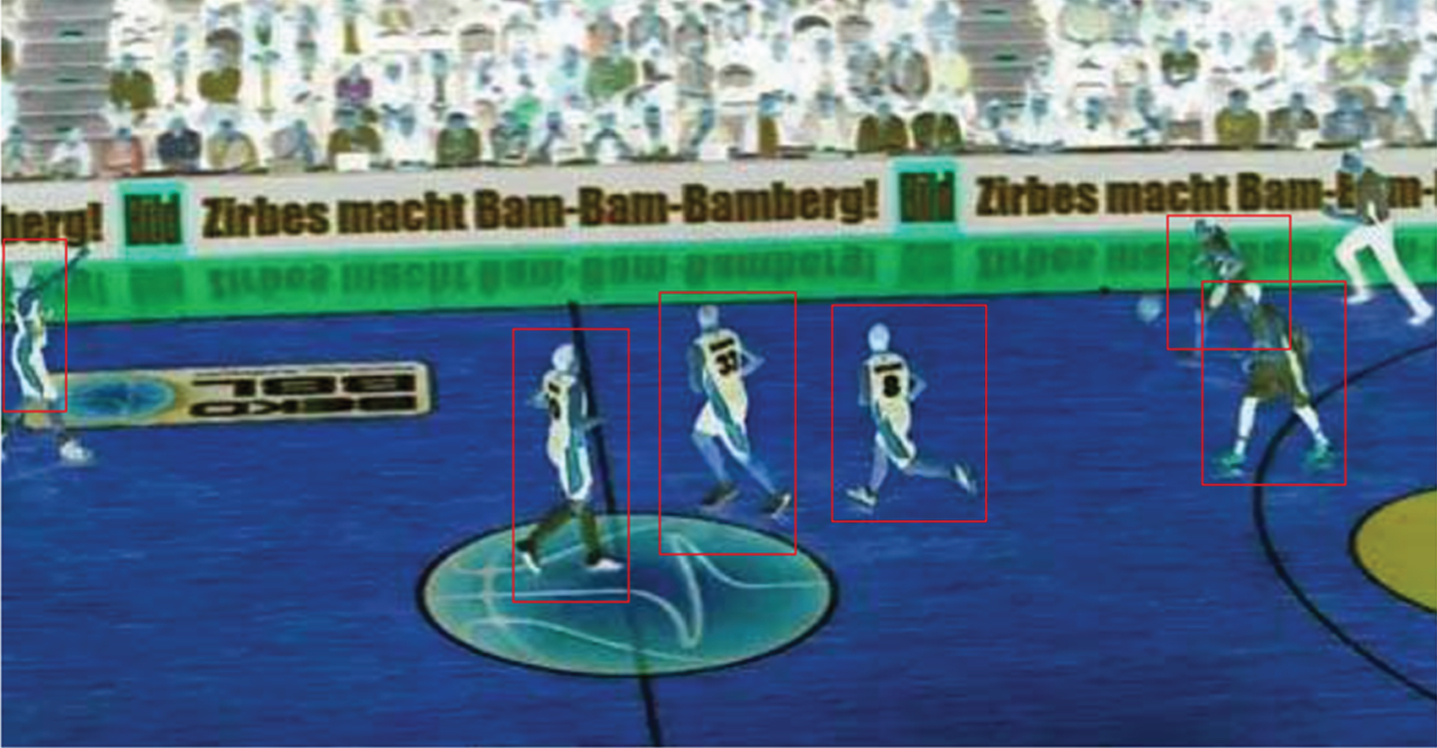
Capture images of basketball players.
Further, the segmentation results of the algorithm and the original algorithm are compared, as shown in Fig. 8. It can be seen that the algorithm can effectively segment the basketball object in a complex background, which is obviously improved compared with the original algorithm, especially the segmentation false detection rate drops a lot. At the same time, the algorithm of this study is robust to complex motions such as partial occlusion of basketball, motion blur and self-rotation of basketball.
In the basketball game video, there are often some special effects of the director’s editing. These effects are usually abrupt shots between video segments, and also include gradient lenses for the overlay and sweep modes. Through the processing of the video data in the data analysis layer, the result of the shot segmentation is displayed in the left column in the form of a key frame.
The starting frame of the video segment to be processed after lens segmentation is displayed in the panel on the left side of the interface. After double-clicking the video frame to be processed, the frame enters the object detection processing panel of the lower column. The basketball object segmentation module is started by selecting the video start frame to be processed and double-clicking, as shown in Fig. 9.
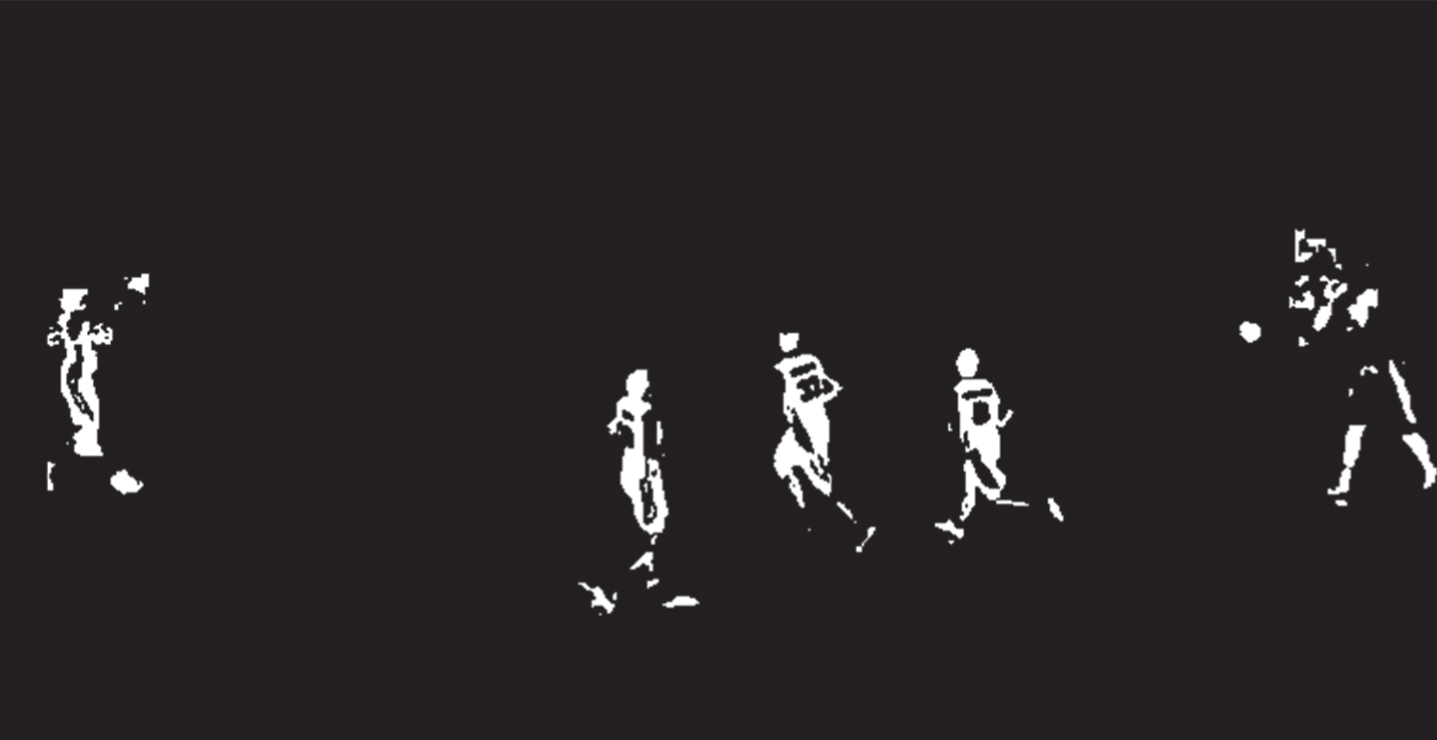
Object detection interface.
In Fig. 9, the athletes are separated from the background, and all backgrounds of the stadium, including the audience, venue facilities, color interference, etc., are excluded. Secondly, it should be noted that in the picture displayed on the court, in addition to the six players, a referee is included. However, the referee figure was not seen in the object detection interface, and only 6 athletes existed. It can be seen that the identification model of this study has certain effects.
The core function of the basketball video analysis system is to analyze the video footage and basketball objects of the clip while browsing the video content and give the corresponding analysis results to complete the extraction of the semantic features of the basketball game to lay the foundation for further analysis of specific semantic segments. The biggest feature of this system is the detection and tracking of the key object in the basketball game - basketball. Many semantic events in basketball games are directly related to basketball, such as dribbling, shooting, free throws, etc., all of which have their specific movement track. By analyzing its motion characteristics, it will be of great help to video analysis of basketball games. In summary, this topic builds a video analysis and demonstration system for basketball games based on basketball detection and tracking algorithm. Compared with the traditional system, this system takes the basketball object detection as the core and analyzes the game content from the perspective of video key objects. It is a useful attempt to push the video analysis of basketball games into practical use.
This project aims to use the modern computer technology to quantitatively analyze the tactical behaviors in the competition. Moreover, through video excerpts and data statistics, the statistical analysis of the players and competitors during the game will be carried out to improve the on-the-spot decision-making ability of the coaches and athletes and promote the improvement of the sports level of the sports events. The goal of this project is to study a tactical behavior analysis method for basketball games. It can identify and analyze existing tactical behaviors, further realize visualization, and facilitate coaches to conduct basketball teaching and timely cracking opponent tactics in order to take favorable defense and attack. In addition to the academic significance, the research of this subject can also have some direct applications: the establishment of a video database is suitable for all kinds of sports professionals or enthusiasts to appreciate and learn the tactics of the collected sports competitions. Moreover, it is suitable for basketball coaches to use the system for basketball teaching, and to crack the opponent’s tactics in time to take favorable defense and attack. In order to accurately and accurately identify and track multi-target players in real time, this paper proposes a multi-target player recognition method based on visual shell, which provides a good foundation for facilitating follow-up player path tracking and tactics identification and analysis. Based on the multiple recognition methods of the visual shell, this study uses the multi-camera cutting idea to cut the course cube, which can quickly identify multiple players on the field. The method can effectively deal with occlusion and other problems and has high accuracy and real-time performance.