
Abstract
Product classification is a critical task for the smooth running of the purchase process in e-commerce websites. When it comes to P2P marketplaces, users can act both as sellers and as buyers, and they need to assign predefined categories to the products they want to sell. Besides being tedious for users, this task can result in ambiguous or inaccurate assignments. This article presents a method for the automatic categorization of items offered in a local P2P marketplace using a multi-level classification approach. Our experiments demonstrated a significant improvement in the classification results of the proposed solution compared to a traditional direct classification approach.
Introduction
Peer-to-peer (P2P) marketplaces are a popular trend in e-commerce. The market consists of two parties: users who provide products or services and users who may be interested in purchasing them. As opposed to retailing e-commerce, the platform allows any user to play both roles, eliminating the distance between them. For example, a user can sell his/her laptop on the platform and also find a new laptop to buy in the same platform.
Some P2P marketplaces, such as Amazon or eBay, can offer numerous types of products and services without sticking to a certain niche, while others target users with specific needs, for example, Airbnb for booking rooms or apartments. Marketplaces can also be characterized by the markets in which they operate. P2P marketplaces that operate locally are accessible to buyers in a certain country or region, whereas global platforms like Amazon and Airbnb offer their services globally.
Despite the type of marketplace, most of them rely on a hierarchical set of pre-defined categories to help users to browse the products in which they are interested. Platforms usually rely on sellers categorizing their products or services from a tree-like category structure by selecting one of many possible categories. It is usually tedious for users to complete this task, and it is error-prone when some of the categories seem ambiguous or redundant, which negatively impacts the platform’s acceptance by users [1].
The use of AI techniques, particularly Machine Learning (ML) techniques, in online sales websites is an increasingly used way to leverage the competitive advantage of companies, to improve the operation of the site, and to personalize the user experience [2, 3].
In this article, we present an approach to predict the category of a product or service announcement in a local Spanish-speaking P2P marketplace given only its title. We use Natural Language Processing (NLP) techniques and Machine Learning (ML) algorithms to build a multi-level classification model. This way, sellers can avoid the tedious and ambiguous process of manually deciding which category to choose for their products or services. Other researchers have studied ML techniques and NLP for classifying products both for small/medium-sized sites and for large ones, with millions of products, based on their title and/or description [4, 5, 10]. However, most related works in the area are for texts written in English. Some works for other languages can be found in the literature [12].
We evaluated our approach with data collected from a local P2P marketplace from a region of Argentina, called Region20 1 , but it can be applied or extended to other similar small/medium size platforms with a taxonomy-based product organization. The results obtained so far support the effectiveness of our proposal and its viability.
The article is organized as follows. In section 2 we analyze related works. In section 3 we describe the structure of the testbed marketplace. In section 4 we present our proposed approach. Then in section 5 we describe the experimental evaluation that we have conducted. Finally, in section 7 we present our conclusions and future works.
Related work
A growing number of companies are using AI techniques, such as Machine Learning, to increase their competitive advantage in online sales platforms [2, 6]. For example, in [1] different classifiers (Naive Bayes, KNN, Linear SVC, random forests, perceptron, regression) are compared to determine their ability to predict a product category. Unlike our work, the focus here is on the phrases used by clients in searches. In [7], the authors present a comparative study on different algorithms for supervised learning to classify real-world datasets related to e-commerce products. KNN resulted in the model with the highest accuracy to classify the data used in the study. On the other hand, in [8], an approach that combines different Machine Learning, Deep Learning, and NLP techniques is proposed to classify products from the text of the publication title. Similarly to our approach, a multi-level classification is proposed. In [9] the authors propose a novel machine learning method for the problem, referred to as gcForest, which utilizes the cascade forest of decision trees and multigrained scanning mechanisms. This work only uses the title of the announcement to categorize products.
Also, some works have addressed the large-scale version of the problem for e-commerce giants, with millions of products [10]. For example, in [4] the authors used a combination of two different neural models, deep belief nets and deep auto-encoders, for both titles and descriptions. In [11] the work proposes K-Means clustering to group e-commerce products from the online store website in Malaysia, with billions of retailers and consumers.
Some other approaches different from ML have also been studied. For example in [5] the authors propose a Machine Translation approach where the authors translate a product’s natural language description into a sequence of tokens representing a root-to-leaf path in a product taxonomy. According to the authors, this approach gives better results than traditional classification techniques.
It is worth mentioning that all the related works analyzed have their product titles and descriptions written in English. However, our work is based on product titles and descriptions written in Spanish. There exist some works for other languages, such as [12] where the authors propose a variant of Convolutional Neural Network (CNN) models, the Attention CNN (ACNN), for large-scale categorization of millions of Japanese items into thirty-five product categories. In [13] the authors build a classifier on web-scraped, hand-labelled product data from German retailers and test the transfer to French data using cross-lingual word embedding. We compare its performance against a classifier trained on single languages and a classifier with both languages trained jointly. For other works related to our proposal, the reader can check [3].
Description of the testbed marketplace
This section presents an overview of Region20, the marketplace used as a testbed for our proposal. A screenshot of the landing page of the portal is presented in Fig. 1. Although this work describes an approach we have developed for this particular platform, it can be applied or extended to other platforms that share the same functionality and a similar structure.
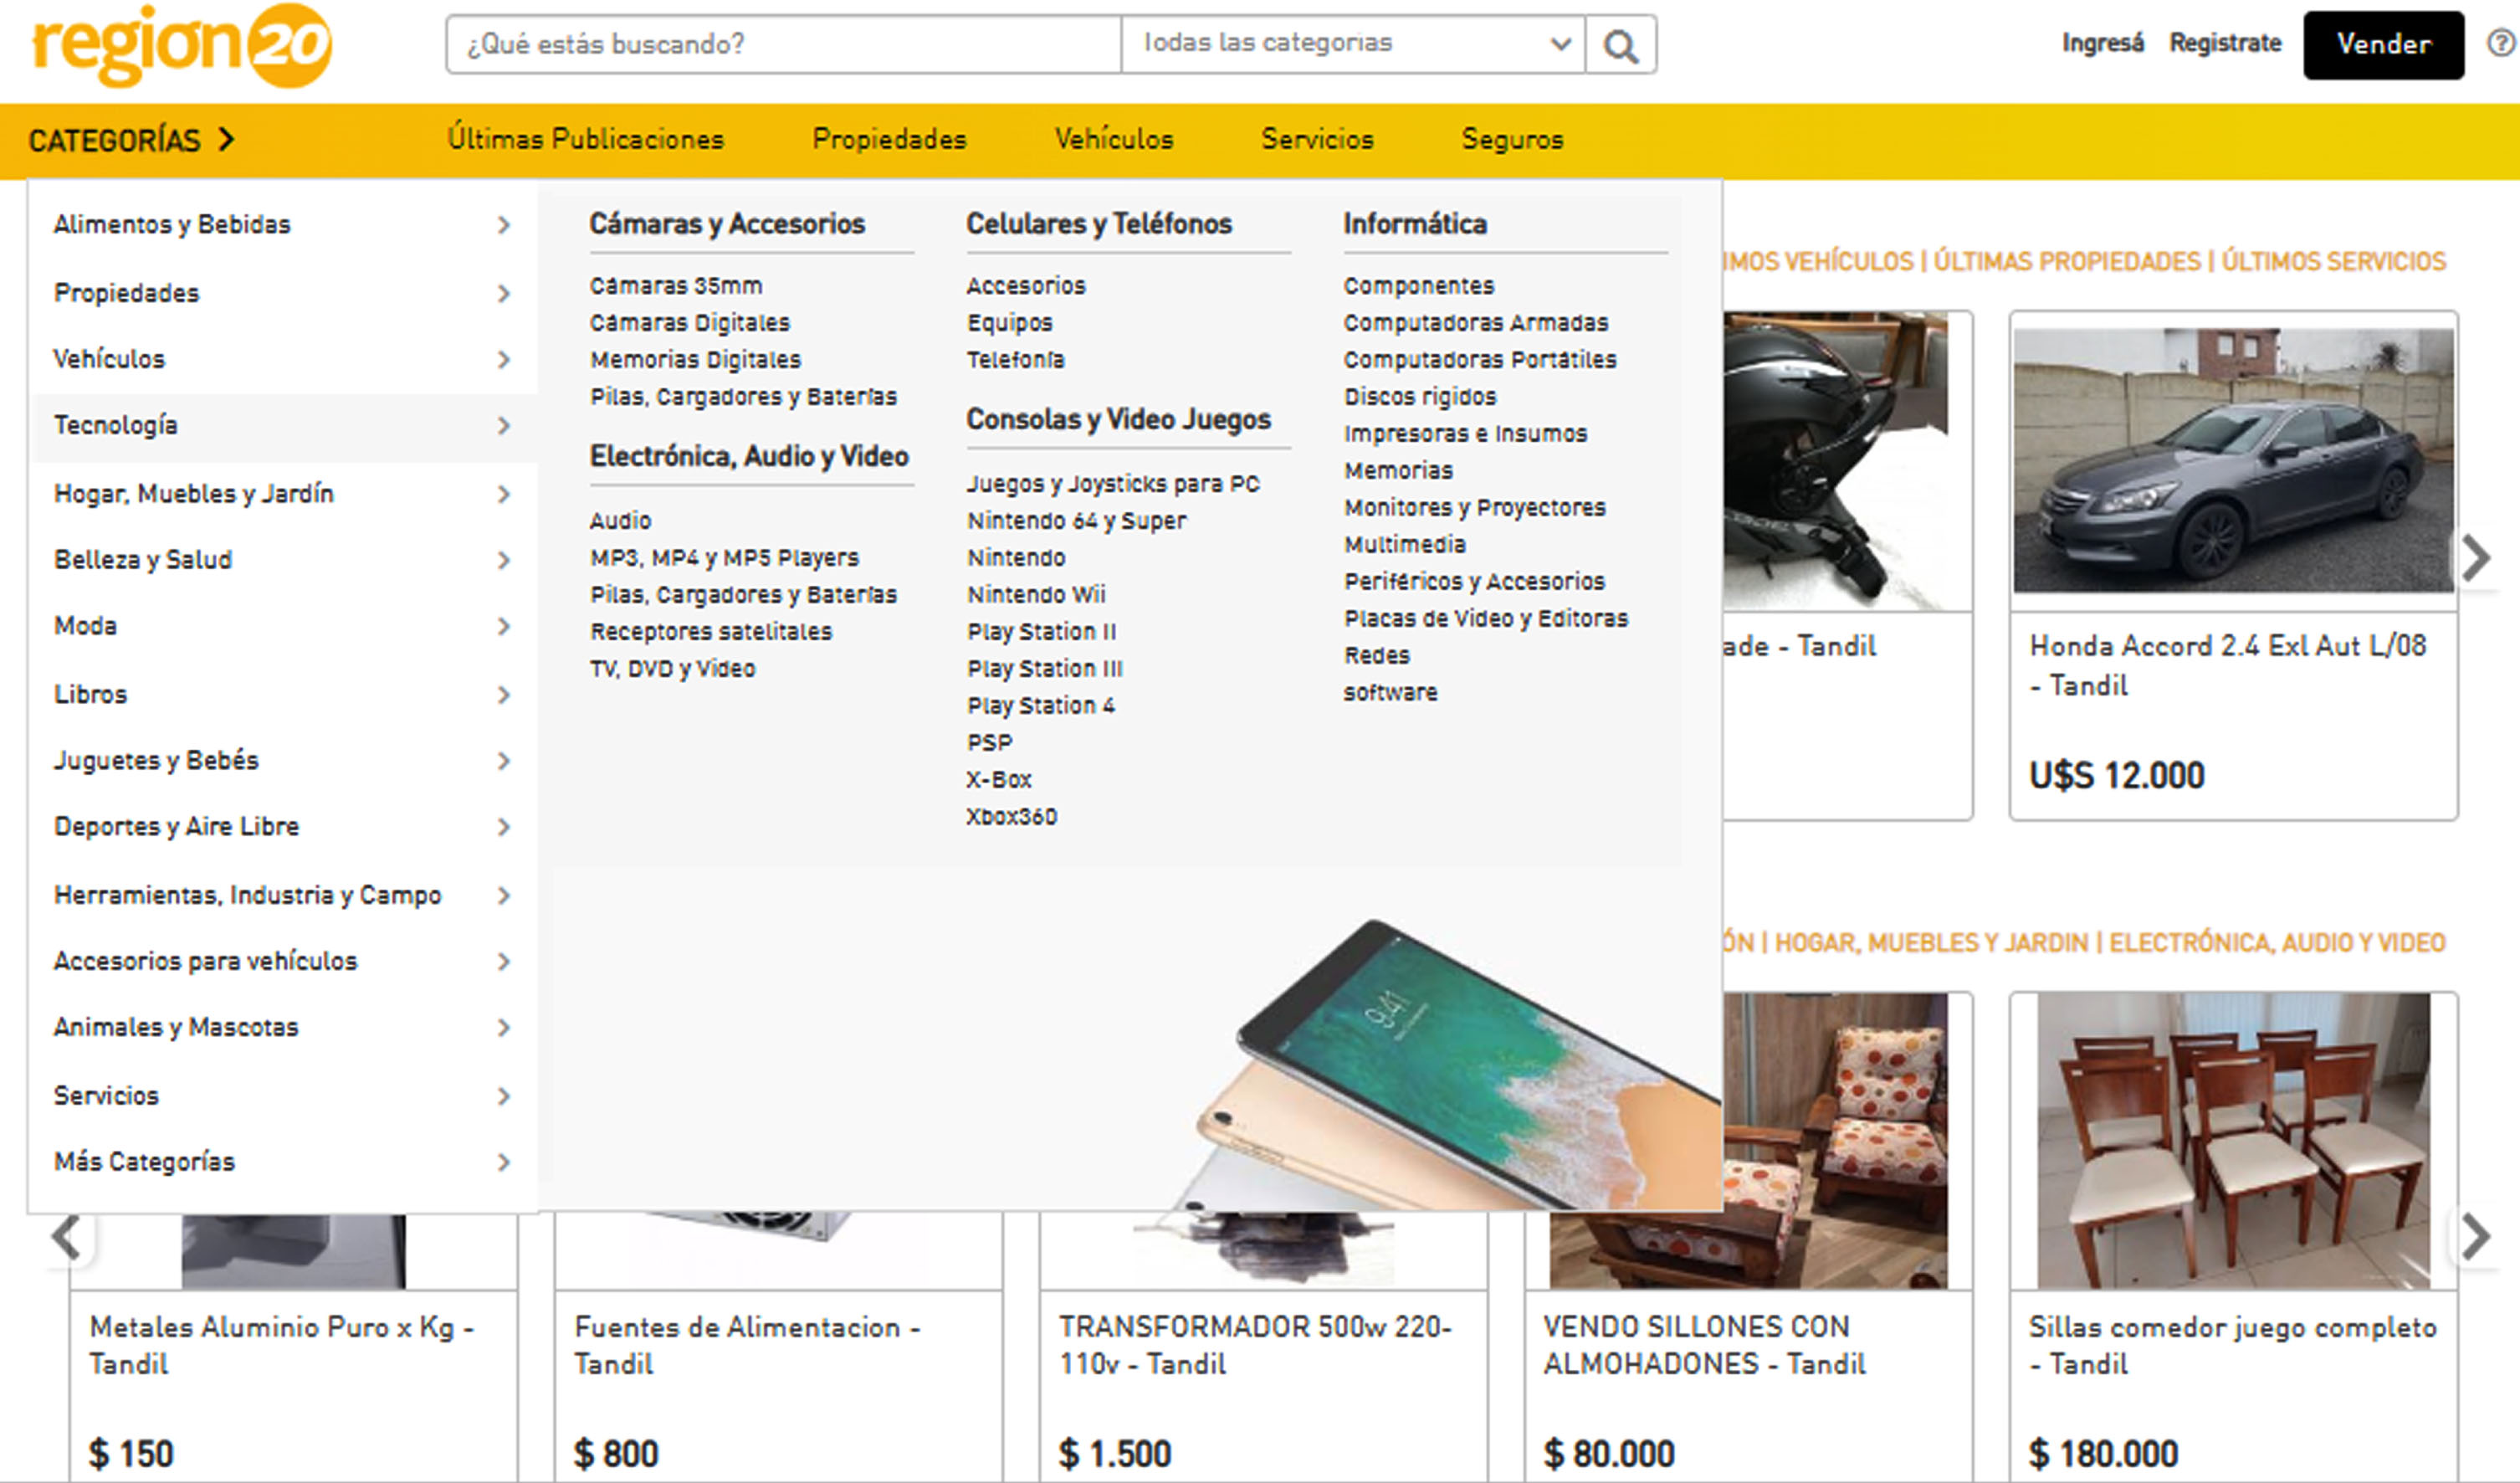
Region20 landing page and selection of categories.
The Region20 regional portal was launched to the market in 2006 by the Región Global S.A. Company (Argentina), and it currently has more than 150,000 registered users. The marketplace does not charge a commission for sales and it offers the possibility of publishing articles for free, which means that there is a very important flow of publications. As in any marketplace, registered users have the possibility of publishing advertisements for the sale or rental of products and services. These announcements are initially organized into four main groups, Vehicles, Properties, Articles and Services, which are then subdivided into a total number of 858 categories and subcategories. As its name indicates, the Vehicles group contains advertisements for all kinds of vehicles. The taxonomy then divides vehicles into Cars, Trucks, Pickups, Quad bikes, Motorcycles, Utilitarian Vehicles and Other Vehicles, which are then grouped according to brand and model. There are various types of real estate advertisements in the Properties group, including houses, apartments, plots of land, offices, and warehouses, among others, available for sale and for rent. The Articles group includes general advertisements for any other type of product, not included in the other main categories. Similar to the previous ones, articles can be categorized in three layers of depth. For example, level 1 category named “Food and Beverages” has the following level 2 subcategories: Accessories, Beverages, Prepared Meals, Sweets and Desserts, Fresh, and Others. Within Beverages, for example, we can find the following level 3 categories: Water, White Drinks, Beers, Juices and Soft Drinks, Liqueurs, Wines and Whiskies. It may occur that a category does not have three levels of depth, for example, “Regional products and gifts” is a category with a single level. Finally, the ads belonging to the Services group, unlike the previous ones, does not represent the sale of a physical product. These are classified in the following categories: Beauty and Personal Care, Printing, Professionals, General Transportation, Classes and Training, Vehicle Maintenance, Clothes and Fashion, and Tourism and Recreation, each one with different subcategories, as appropriate. A title, a free-text description, the price (currency and amount), the payment method, and optionally images are requested for each of the four types of ads on the portal. In the case of Vehicles and Properties, structured data is also requested for a better characterization of the product. Something similar occurs in Services where the aim is to make the characteristics of the service provided more visible in the portal. Currently, to publish an advertisement, users must manually select a category from those offered by the portal at the beginning of the publication, according to the pre-established category hierarchy. Then, three moderators are in charge of manually reviewing each of the published announcements, and checking, among other things, that they are well categorized. The process of selecting a category can be tedious and confusing for users since they are organized into a taxonomy (in the worst case in four levels that are displayed in cascade when choosing a parent category), and sometimes there is some ambiguity and overlap between the categories. This resulted in a large number of ads being misclassified by users, or different categories being assigned to similar ads randomly (for example, different ads for the same model of a given vehicle were classified as cars, trucks, or utilitarian randomly). Even moderators find it difficult to detect this situation since they only see one ad at a time and they must determine whether it is correctly classified or not. It is therefore important to automate the selection of the category of a publication in order to improve both the usability of the site and the work of moderators.
In this section, we describe our proposal to automatically classify product advertisements. The approach consists in applying NLP techniques to represent the ads computationally (Section 4.1) and in training a multi-level classifier able to assign to each particular ad the most probable category according to the taxonomy of the portal (Section 4.2).
Natural language processing
The most accepted format for computationally representing raw text is known as “bags of words”, whose representation is with vectors. In this model, raw text is mapped to a highly dimensional vector space where each document (in our case, the title of the ads) consists of a sequence of terms, i.e. the terms in a set of documents determining the dimensions of the space. There are more sophisticated representations that seem to have better quality, but the experiments conducted over short texts do not lead to a significant improvement over term-based approaches. In these representations, weights traditionally represent the relevance of words to the user or within the topic, usually indicating how often they appear. In our study, TF-IDF was used to weigh terms since it allows us to minimize the impact of words that are usually repeated in the different advertisements, regardless of the categories (e.g. “en venta”, meaning “for sale”) and to give importance to those that are representative of the categories explored. To begin with, raw text is divided into significant entities called tokens, such as words or sentences. Then, a normalization process is applied by lower-casing tokens, removing punctuation and converting numbers to their word equivalent. Stop-words were removed after the normalization process. “Stop-words” are words that are not helpful in determining the category of the document because of their frequency (they appear in most documents) or because of their semantics. When we talk about stop-words we are generally referring to articles, prepositions, adverbs, pronouns and even some verbs that do not represent anything relevant to the content. Therefore, they can be safely ignored without altering the meaning of the sentence. There are predefined lists of stop-words for each language and even for particular topics. Furthermore, we performed an exploratory analysis to determine words that were frequently found in many ads such as “vendo” (sale), “oferta” (offer), among others.
Classification techniques
Figure 2 presents our proposed meta-classifier, consisting of a set of classifiers in cascade. Considering the title of an ad as the input, the first classifier determines one of the four main categories, namely Article, Vehicle, Property, or Service. This first classifier is trained with all the advertisements published in the website but uses the first-level category associated with the actual category of the advertisement as the target variable (class).
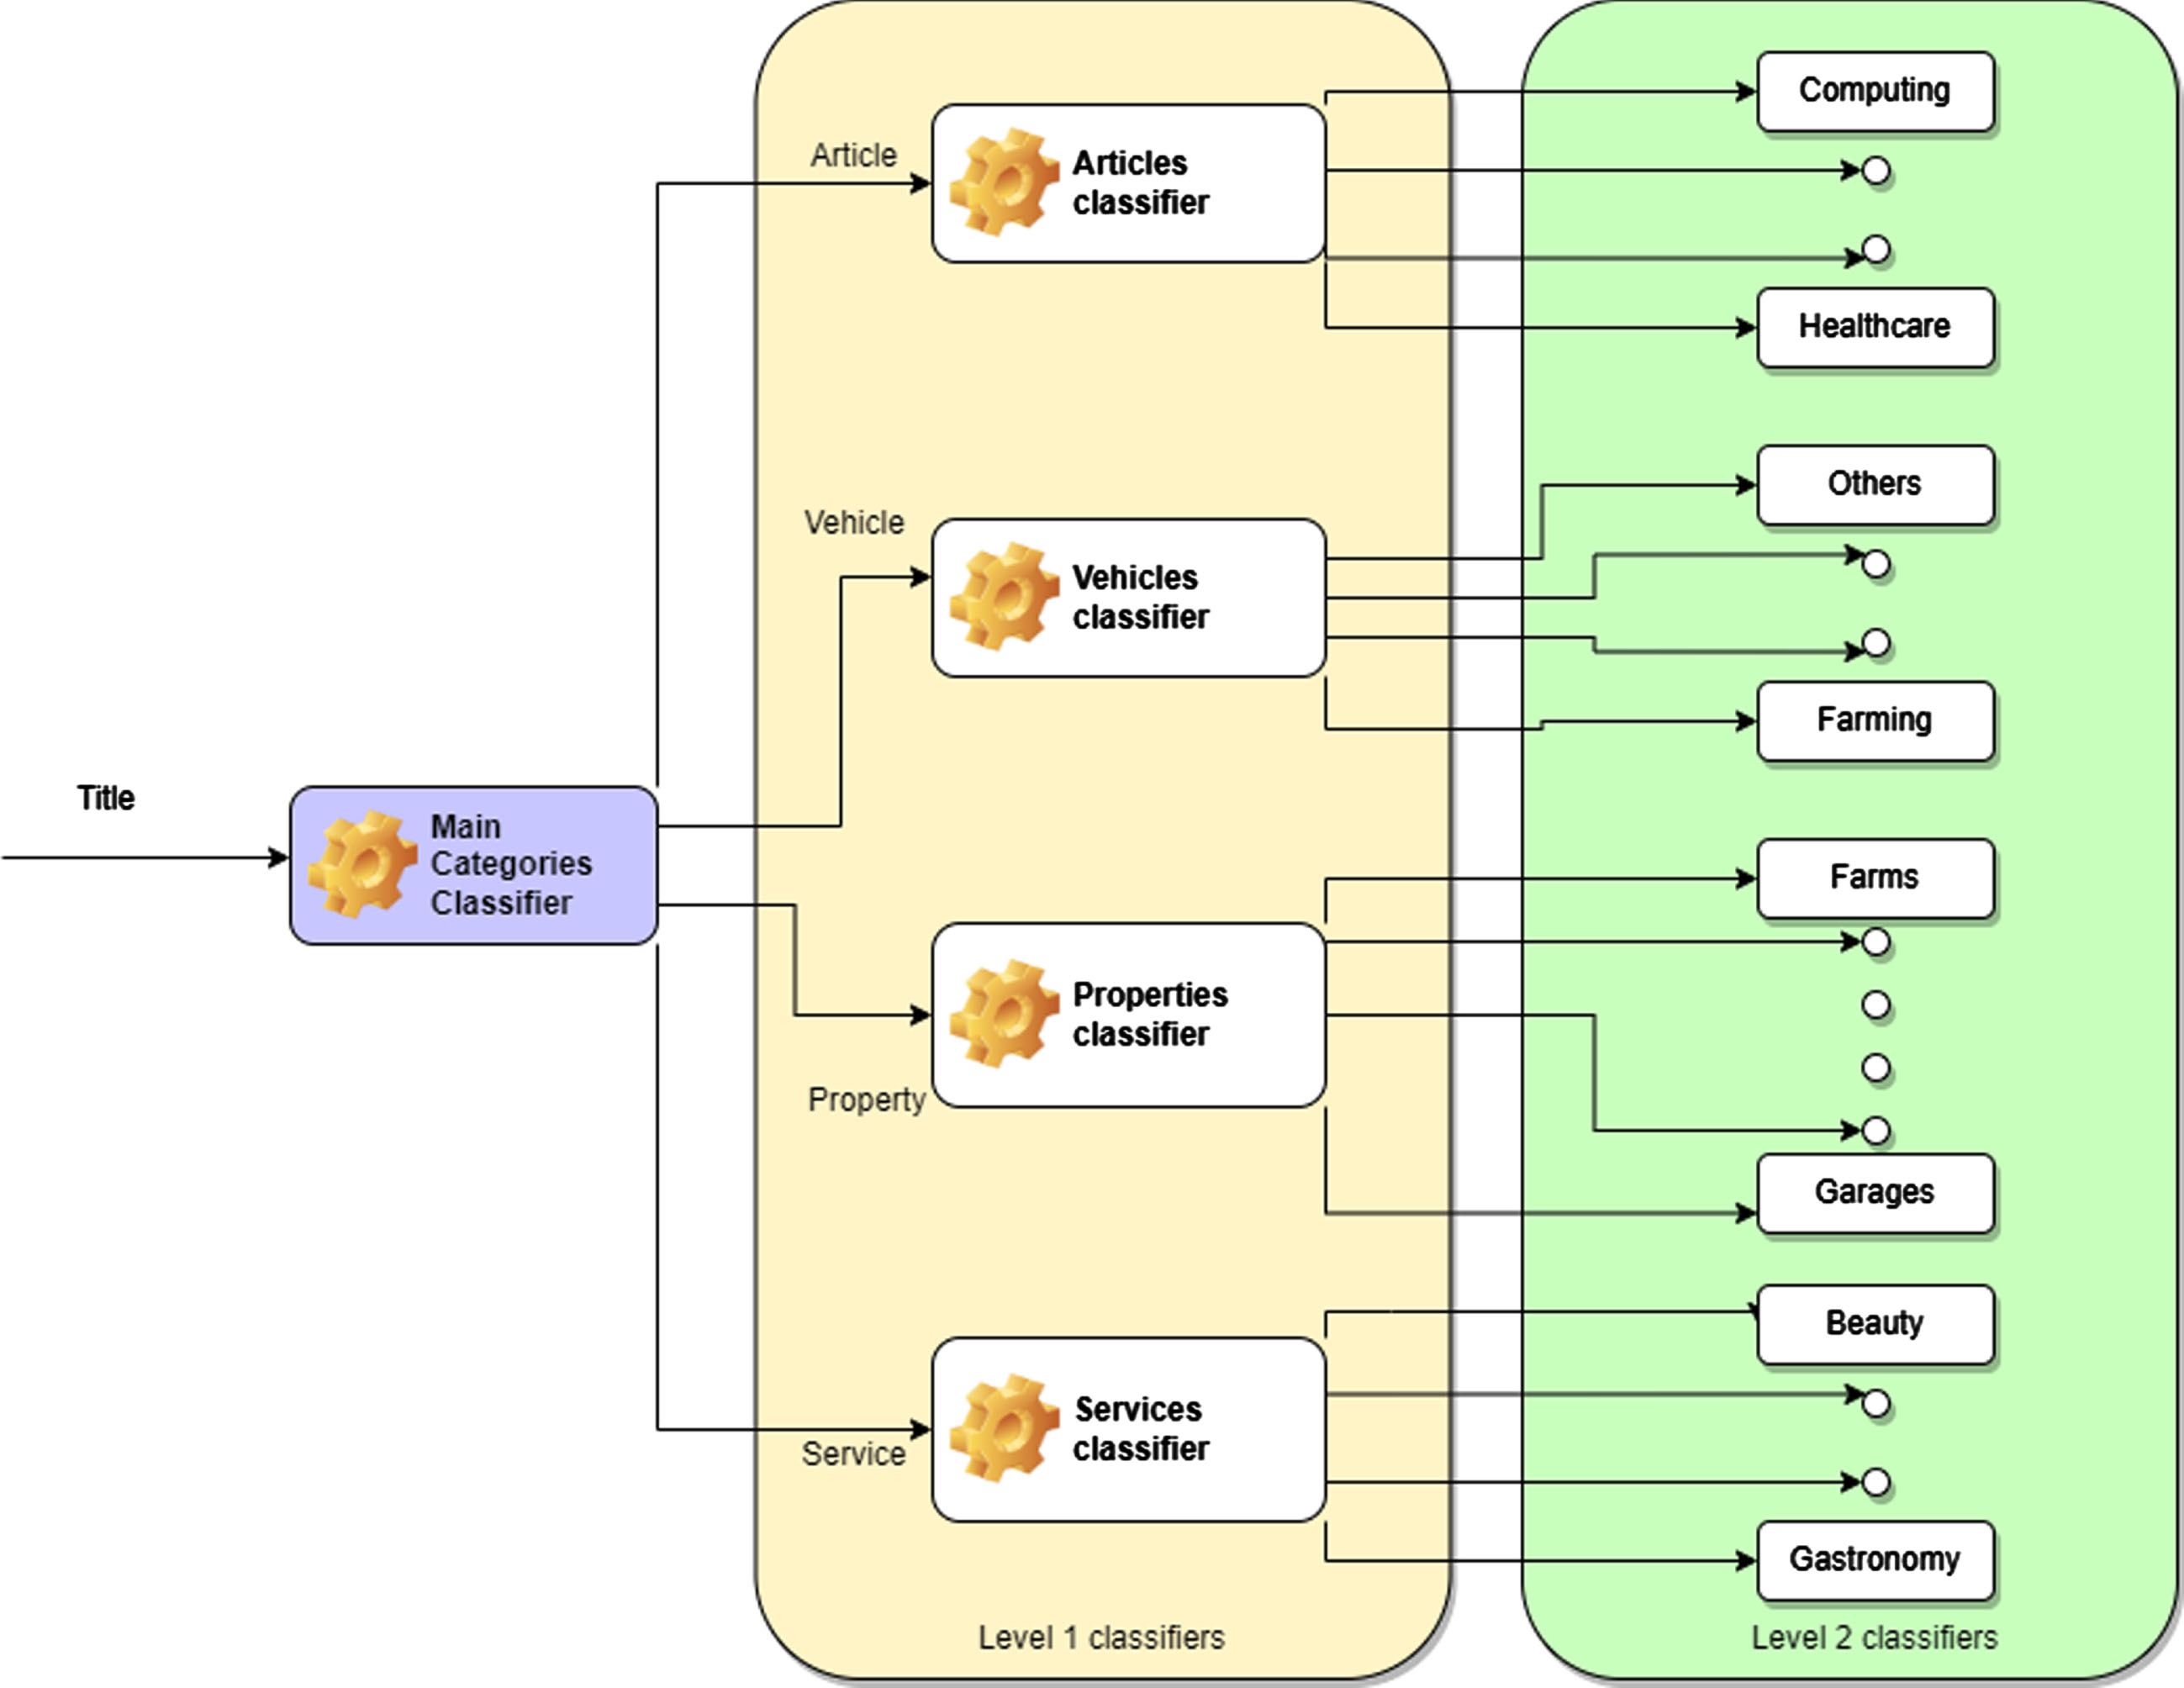
General view of the classification approach.
With the title of the ad and the first category predicted, Level 1 classifiers continue with the classification procedure. In this meta-classifier, 4 different classifiers coexist, one for each of the possible 4 categories of the first level. These classifiers determine the categories in which the given category is subdivided. For example in the Articles category, the classifier deals with categories ranging from Computing to Health. To train each of these classifiers, the original advertisement dataset is subdivided into four subsets, according to the main category of each advertisement. This procedure is repeated in the next level (whenever the subcategory is subdivided again, otherwise a leaf of the category tree is reached and the classification process is considered finished). For example, if we have an advertisement classified as Article, and then as Computing, the Level 2 classifier is used to determine the subcategory within Computing (e.g. peripherals). It might occur that there are no ads for a certain subcategory or that all the ads belong to the same subcategory. In these situations, it is not necessary to train a classifier. For example for the Properties category and plots of land subcategory, which can be subdivided into Purchase or Sale, if all the existing plots of lands publications are within the Sale category, then a classifier for Plots of land is not trained.
Different classification techniques were analyzed to implement the classifiers, such as SVM (Linear SVC), Decision trees, Bayesian classifiers, and Regression.
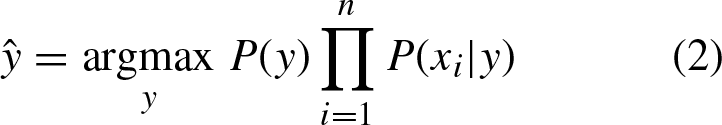
Naive Bayes classification methods are a set of supervised learning algorithms based on the application of Bayes’ theorem with the “naive” assumption of conditional independence between each pair of features given the value of the class [14]. Bayes’ theorem establishes the relationship expressed in Equation 1, given the class variable y, and the dependent feature vector
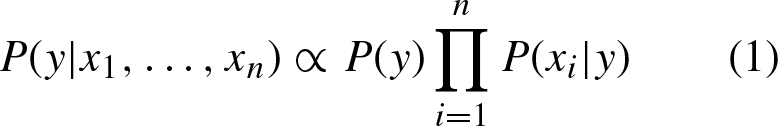
The different types of Naive Bayes classifiers differ mainly in the assumptions they make regarding the distribution of P (x i |y). For example, Multinomial Naive Bayes implements the algorithm for multinomially distributed data and it is one of the two classical variants of Naive Bayes used for text classification (where data is typically represented as word vectors).
Decision trees are a non-parametric supervised learning method used for classification and regression [14]. The goal is to create a model that predicts the value of a target variable by learning simple decision rules inferred from data features. A decision tree consists of internal nodes that denote a test on an attribute, branches that represent a test output where all instances in a branch have the same value for the evaluated attribute, and leaf nodes that represent class labels. Basic top-down tree building consists of two phases: tree building and tree pruning. At the beginning of the process, all the training examples are in the root. The instances are partitioned recursively based on attribute selection. Then, pruning aims to remove branches of the tree that reflect noise in the training data and might lead to errors when classifying the test data, to improve classification accuracy. The key to the success of a decision tree learning algorithm depends on the criteria used to choose the attribute that partitions the set of examples in each iteration. Some possibilities to choose that attribute are: random, which selects any attribute randomly; least values, which selects the attribute with the fewest possible values; most values, which selects the attribute with the most possible values; maximum gain, which selects the attribute that has the highest expected information gain, that is, it selects the attribute that will result in the smallest expected size of the sub-trees, assuming that the root is the current node; among others.
Logistic regression
Logistic regression, despite its name, is a linear model for classification rather than regression. Logistic regression is also known in the literature as logit regression, maximum entropy classification (MaxEnt), or log-linear classifier [15]. In this model, the probabilities that describe the possible outcomes of a single trial are modeled using a logistic function. Like all regression analyses, logistic regression is a predictive analysis. It is used to describe data and explain the relationship between a binary dependent variable and one or more nominal, ordinal, or interval independent variables. The reason why logistic regression is widely used, despite the existence of other advanced algorithms, is because it is very efficient and it does not require too many computational resources, which makes it viable to run in production. Although the technique is generally applied to binary classes, multinomial logistic regression can be used to predict a target variable with three or more values.
Support vector machines
Support vector machines (SVM) are a set of supervised learning algorithms [15]. In the case of binary classification, given a set of points, a subset of a larger set (space), in which each of them belongs to one of two possible categories, an SVM-based algorithm builds a model capable of predicting whether a new point (whose category we do not know) belongs to one category or the other. As in most supervised classification methods, the input data (the points) are viewed as a p-dimensional vector (an ordered list of p numbers). The SVM looks for a hyperplane that optimally separates the points of one class from those of another, which may have been previously projected to a higher dimensional space. The fundamental characteristic of SVM resides in the concept of “optimal separation”: this type of algorithm searches for the hyperplane that has the maximum distance (margin) with the points that are closest to itself. This is also why SVMs are sometimes referred to as maximum margin classifiers. In this way, the points of the vector that are labeled with one category will be on one side of the hyperplane and the points that are in the other category will be on the other side. The vector formed by the closest points to the hyperplane is called the support vector. There are different algorithms depending on the functions used, which can be linear or kernel functions with other mathematical formulations. In particular, in this project, Linear SVC was used.
Experimental evaluation
In this Section, we present the experiments carried out to evaluate the proposal. The dataset used is described first, in Section 5.1. The methodology followed for the experimentation is then detailed in Section 5.2. Finally, in Section 5.3 the results are presented and some characteristics of the advertisements that made the evaluation task difficult are finally discussed in Section 6.
Dataset description
As previously mentioned, the Region20 portal organizes its ads into four main groups, namely Vehicles, Properties, Articles, and Services. In turn, each of these main categories is divided into different subcategories, with at most four levels in the hierarchy. In total, the user must select one of 858 different categories to assign to an advertisement that he wishes to publish. The available dataset consisted of a total of 469,734 ads published between October 2005 and September 2021, divided into 258,086 products, 10,270 services, 161,299 vehicles, and 40,079 properties. The initial dataset was restricted to publications after 1-1-2020 due to a change made on that date in the category structure of the site, resulting in 46,103 ads, divided into 26,288 products, 507 services, 13,083 vehicles, and 6,225 properties. For the experimental evaluation, titles of the advertisements were pre-processed as detailed in Section 4.1. After applying the pre-processing step, many ads were removed as we found titles with no content. The total number of ads used was then 31,349.
Methodology
In order to evaluate the different learning algorithms, we used the cross-validation technique. Cross-validation is a technique used to evaluate the results of a statistical analysis and ensure that they are independent of the partition between training data and test data. It consists of repeating and calculating the arithmetic mean obtained from the evaluation measures on different partitions. It is used in environments where the main objective is prediction and the accuracy of a model that will be carried out in practice is to be estimated. By using this validation technique, the performance of the different classification algorithms was evaluated, and the one with the best predictive power for the available data was selected. Then, the 66/33 stratified hold-out technique was used to individually evaluate each prediction level. The technique known as Hold-out, or retention technique, simply divides the original data set into two disjoint subsets. The first subset, usually the largest, is used for model training. The second subset, independent of the previous one, is used to test how well the built model fits “new” data, that is, data not used for training. Finally, the classification algorithms were trained with the total of the available data, and a new dataset consisting of articles published after September 2021 was used to validate the whole process.
Experimental results
First, we decided to explore whether it was feasible to predict the category of a product given its title in the 28 level 1 product categories. These categories correspond to the Vehicles, Properties, and Services categories, plus 25 subcategories corresponding to different “Articles”. Different classification algorithms were analyzed and evaluated, resulting in the Support Vector Machines with a linear kernel (LinearSVC) being the technique that best fit the available data, yielding a general average precision of 0.84 ± 0.05 (Fig. 3).
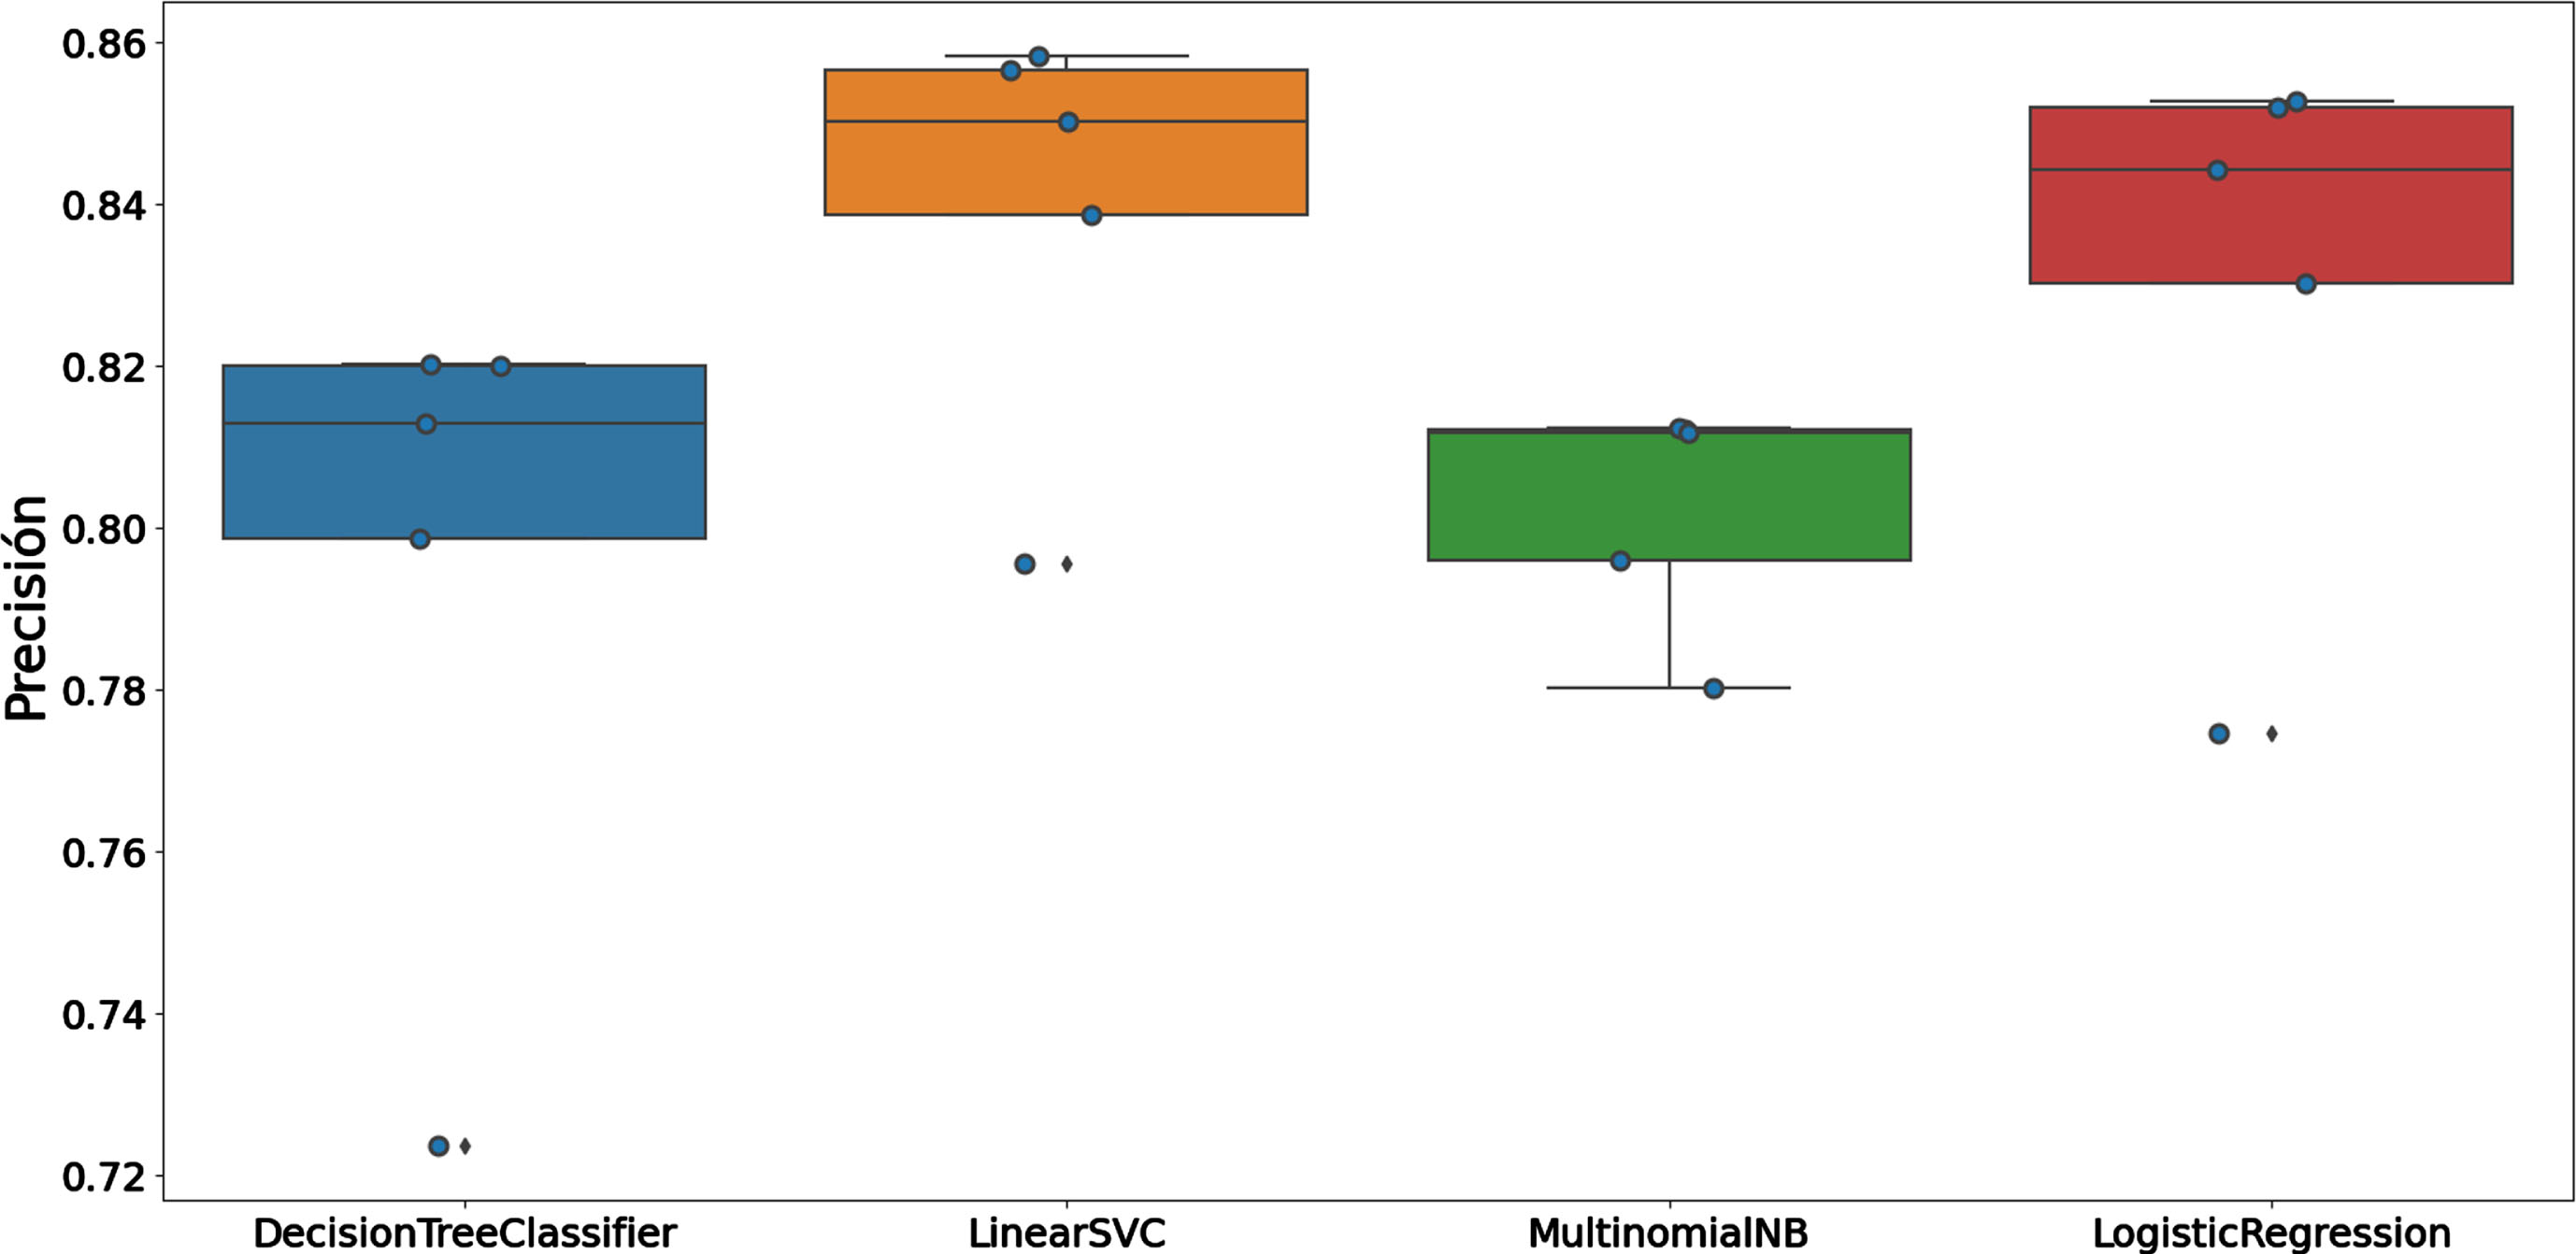
Comparison of classification results for different classifiers.
Although the average precision is a useful metric to determine the effectiveness of a classification model, can be misleading when dealing with datasets that are highly unbalanced in their class distribution. For this reason, in Fig. 4 we present the confusion matrix obtained through a validation using the Hold-out technique, using 66% of the data to train the classification model and the remaining 33% for testing.
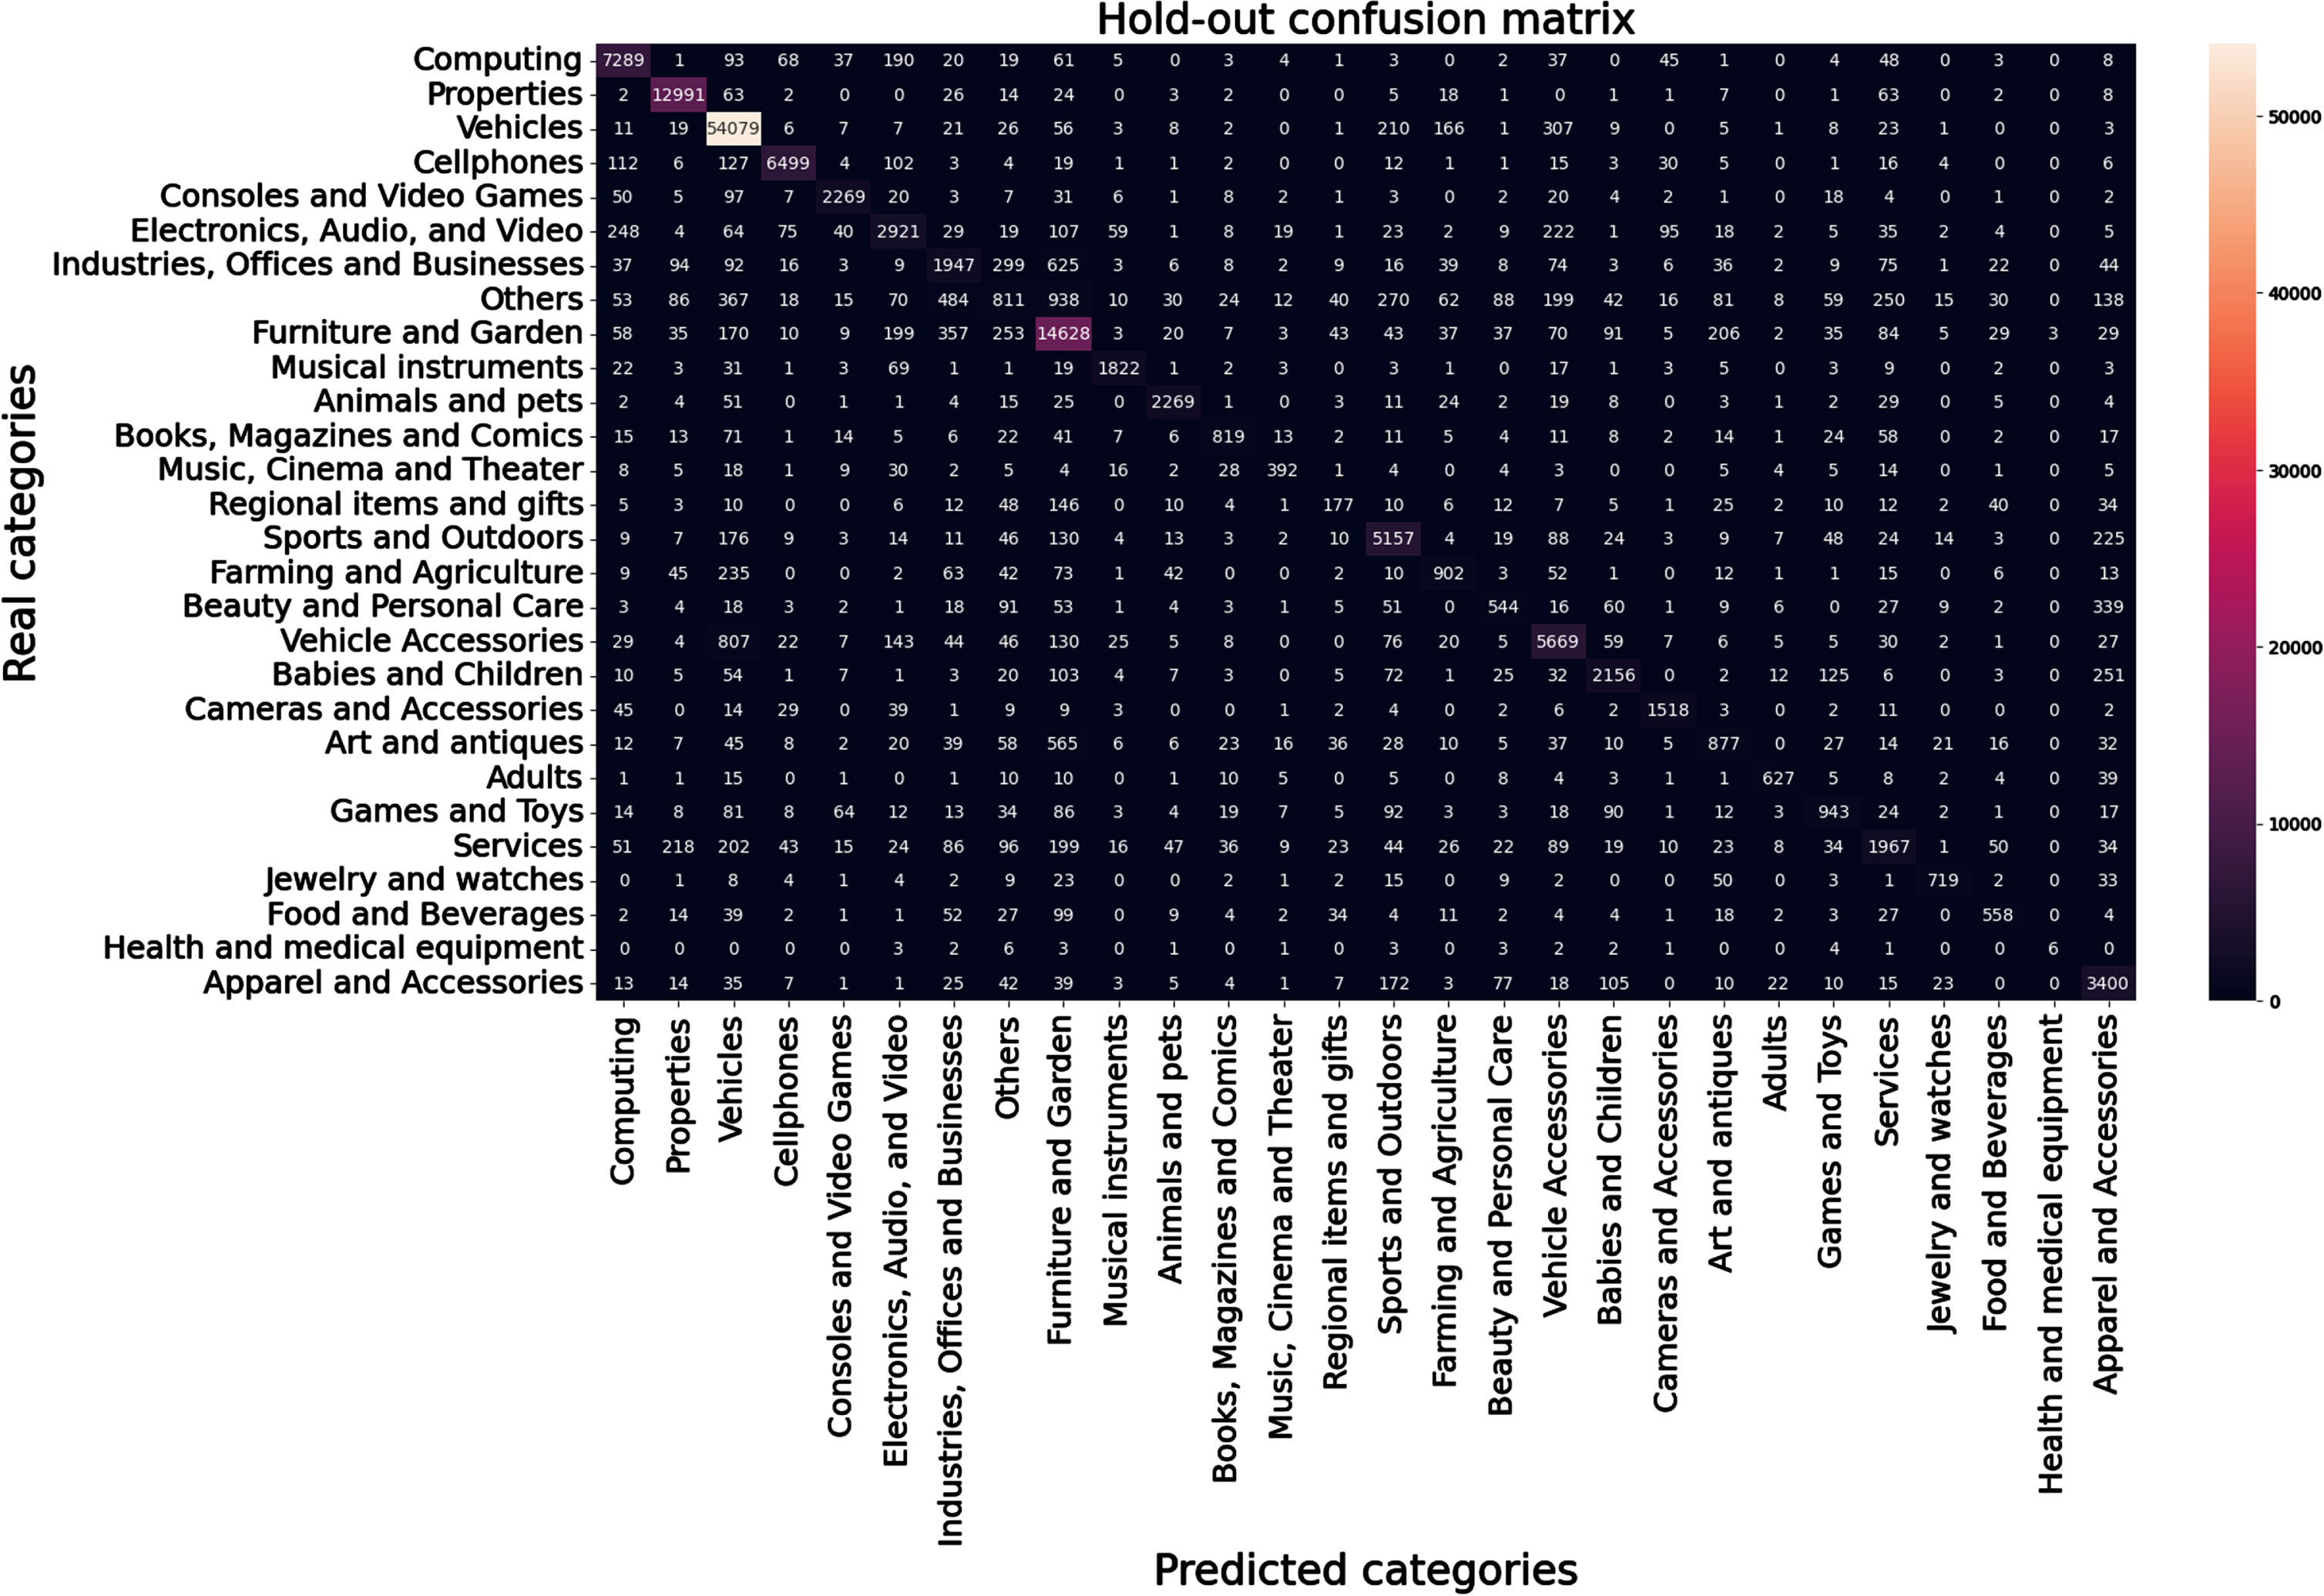
Confusion Matrix for a 66/33 Hold-out classification.
We observed that, despite the unbalanced class distribution, the classification for most categories was good. As an example, for the “Vehicles” category, which represents the majority class, 98% of the total items belonging to that category could be correctly identified (recall). The precision of this class (articles for which the category was correctly predicted) was 95%. The classes with the worst performance were “Health and Medical Equipment”, the minority class, with 67% accuracy and only 16% recall, and the “Others” class, with 39% accuracy and 19% recall. From the results obtained in this first experiment, we concluded that the use of the titles of the articles published in the different categories would be sufficiently descriptive to create a prediction model with acceptable levels of precision and recall.
As we mentioned before, there is an important disparity and diversity within the categories of the system. It is also important to note that categories are organized hierarchically and considering this knowledge could benefit the classification results. Therefore, in a second stage, a classification is made at the different levels in the hierarchy as shown in Fig. 2.
In a first stage, the individual performance of each classification level was evaluated, using the hold-out technique to have the possibility of inspecting precision and recall for each category. It should be noted that for the first level classification, the 25 level-1 categories that did not correspond to Vehicles, Properties and Services were grouped into a single category called Articles.
For the first level, excellent results were obtained, with 97% accuracy and 99% recall for the Articles category, 99% accuracy and 99% recall for the Properties and Vehicles categories. The greatest errors in the classification algorithm were obtained for the Services category, which is an expected result since it is the class with the fewest ads for training. In any case, the precision obtained for this class is high (89%), resulting in a notably lower recall (46%). This means that the ads for which the algorithm predicts the Services category correspond to articles in this category in 89% of cases, but only 46% of ads belonging to the category were found. Observing the confusion matrix, it was observed that most of these ads were classified as Articles.
For the second level, the set of ads reserved for model training was divided into 4 subsets, one for each level 1 category. With each of these subsets, a specialized classifier was trained on each level 1 category. For the subcategories of Properties, the classification was almost perfect with precision and recall of 1.00, except for one ad for Houses and one ad for Apartments that were classified as plot of land, and two ads for House category that were classified as Apartments. In the case of the Services category, a lower performance was observed with several advertisements from various categories classified as “Other Services”. This is expected, due to the variability of terms used to describe this category. In any case, the values obtained for the metrics are more than acceptable, with an f1 metric with values greater than 60% in most cases. Ads belonging to the Vehicles category also showed good performance for most subcategories, with a macro f1 value weighed by the number of ads belonging to each category of 90% . Finally, for the 25 sub-categories of Articles, the precision and recall metrics were variable within the different categories, generally being those with the lowest performance, those with fewer training examples for which the models could not adequately learn the descriptive words for the category. In any case, the f1 metric weighted by the number of ads in each category was 77%, which, being classified among 25 possible categories, is a highly acceptable value.
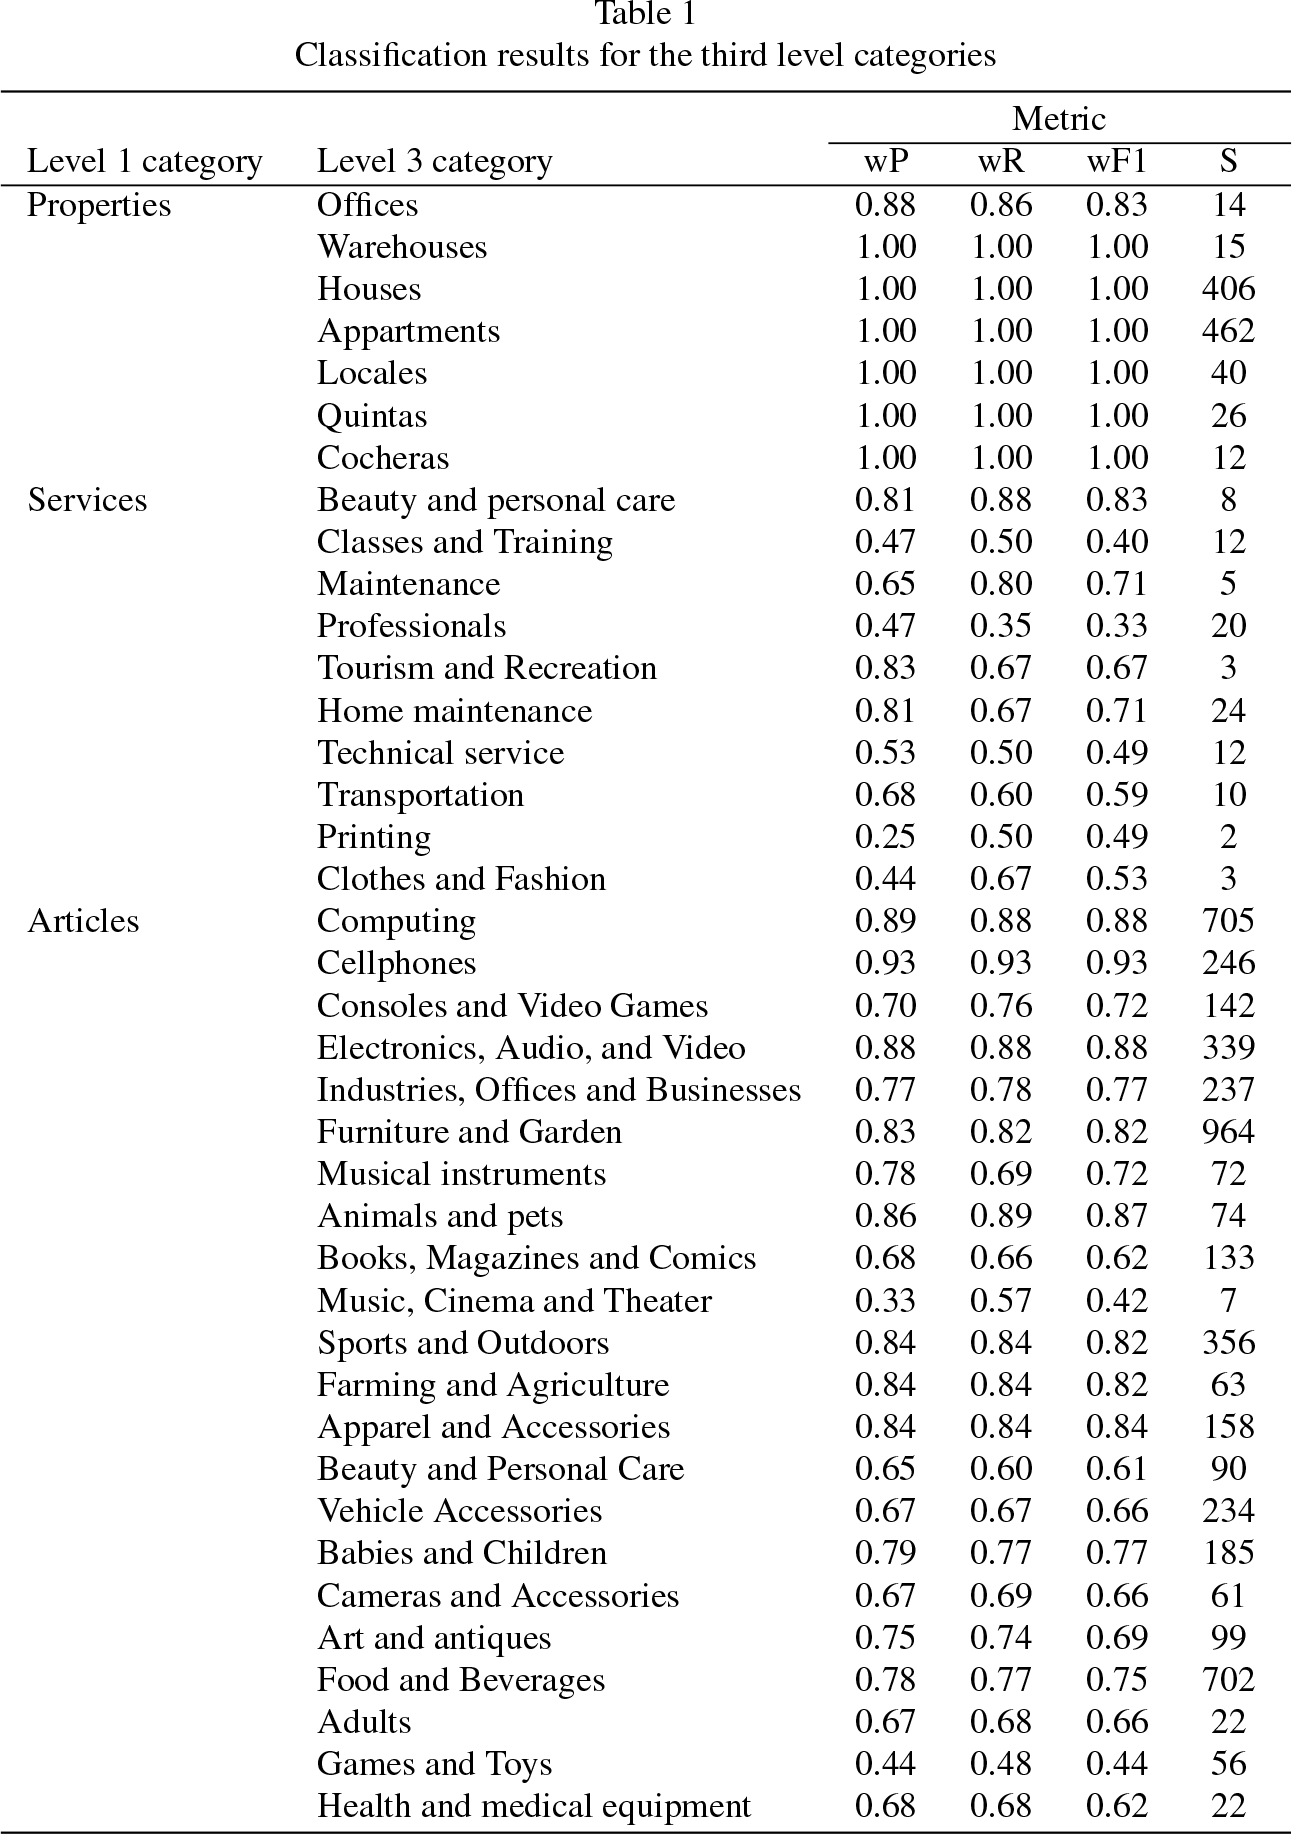
Finally, the classification of the ads in the third level categories was analyzed, that is, the subcategories within each category analyzed in the previous evaluation. Given the number of ads available for analysis, we considered this to be the last possible classification, since by subdividing it into third-level categories, many categories would not contain enough ads to train the classification models.
For each second-level category, a third-level category classifier was then created, which was then used to predict the category of each ad reserved for testing. Table 1 shows the results of the classification for the third level categories. It should be noted that for the Vehicles category, a classification was not made at this stage since there were no third level categories with enough advertisements to learn the models. Table 1 shows the precision (wP), recall (wR) and the F1 metric, weighted by the support (S) of each category, that is, the number of ads available in the test data set for each one of them.
Classification results for the third level categories
Finally, in order to fully evaluate the designed solution, we retrained the classifiers with all the data available and new publications were used for testing. As mentioned above, the data with which we initially worked corresponds to a snapshot of the database from June 2020 to August 2021. The new publications obtained from August to December 2021, when the evaluation was carried out, constituted a total number of 6,097 publications.
For each publication, the same procedure was followed as during training, except that now the complete pipeline proposed in Fig. 2 was applied. In summary, given a product advertisement: The title of the advertisement is extracted and it is pre-processed. With the pre-processed title, the first category is obtained (level 1 classifier, i.e., Articles, Properties, Vehicles or Services) With the first predicted category and the title, the classifier corresponding to level 2 is selected and the subcategory of the advertisement is predicted. With the subcategory obtained in the previous step and the title, a new classification is made according to level 3 classifiers. It should be taken into account that this step may be optional, either because the subcategory is no longer divided or because there was not enough information to train a level 3 classifier. The final result of the pipeline is the publication with its corresponding main category or level 1 category, the corresponding sub category (level 2) and, if possible, the category for level 3.
Following the aforementioned pipeline, each new publication is tagged with three nested categories.
The accuracy achieved for the first classifier was 98.55% (number of publications correctly classified, divided by the total number of publications). Out of the total of 6,097 publications, only 88 were misclassified. For the second category, an accuracy of 82.15% was obtained. It must be considered that for this classification the error of the first classification is carried over. However, the values achieved are more than promising.
For the third category, the accumulated error was used, since many of the categories of the second level do not have subcategories, therefore, if we look only at the classification of the third level, we could think that it is the final one. However, it may be that you have not been successful in the first level or in the second, but in the third. The accuracy of the third level alone is 81.94% while the accuracy of the concatenated classification, that is, that the three levels have been correct, was 76.34% .
When analyzing the results obtained, we paid attention to classification errors, since these are propagated between the subsequent categories. We observed that some classification errors corresponded to errors in the manual classification made by the user for some ads in the dataset. Since the category assigned to ads is selected by the user, for some kinds of products, the selection of the correct category is not trivial. Before being published in the portal, a system administrator or moderator performs a final manual control and he/she changes the publication status from pending approval to published if he/she considers, among other factors, that the category is appropriate for the ad. However, the system administrator or moderator does not check that the selected category is consistent with all the posts on the site, which can lead to unintentional misclassifications.
Consider, for example, the ad with id 485378, with the title (translated from Spanish) “Toyota Corolla Wheel Rim 16”, within the main category of Services. From the title, it is difficult even for a human being to decide whether it is indeed a service or an article. However, when viewing the publication, it can clearly be objected that it is well classified in the dataset (Services → Vehicle Maintenance → Others), when the automatic classification obtained is Articles → Vehicle Accessories → Spare Parts. Another example can be found in the ad with id 488231, which title is “RVM CZ250T”. The category for this ad in the dataset is Articles → Others while the classifier tags it as Vehicles → Motorcycles. In this case, the classifier suggests a more appropriate category for the ad than the one selected by the user. There exists also examples with titles “apartment for sale”, classified as Services in the dataset for which the automatic classification assigns the category Properties → Apartment → Sale, which cannot be considered as an error.
Conclusions
This article presented an approach to assist in the process of deciding which category to assign to a service or product advertisement on an e-commerce portal. We proposed a meta-classifier that allows taking advantage of all the information available in the portal, from the title of a publication to a hierarchy of available categories. This hierarchy allowed us to approach the information of the publications in a segmented way and not just a final category, significantly improving the results of the classification. To facilitate the task of publishing an ad in the portal, in this project we focused only on the title of the ad. In this way, we are able to suggest a category to the user with the smallest amount of information. Current trends in ads classification focus on visual information, seeking to categorize new ads not from a title or any textual description, but from an image of the publication [16]. In this regard, there is a dataset of images available in the Region20 portal, that could be used in future collaborations for the supervised learning of an automatic classifier from this visual information. Another possible future research line is trying to adapt or dynamically change the taxonomy as the user interests change [17].
Funding
This work has been supported by the Dr. Manuel Sadosky Foundation, Argentina, through a Stage 0 Research Project.