
Abstract
In large-section tunnel engineering, there is uncertain and inconsistent information in risk factors, due to complex geological, irregular hydrological conditions, limited survey technology, and inexperience of construction technicians. However, it is difficult for existing risk assessment methods to consider and express this uncertain information comprehensively, which will affect the accuracy of tunnel risk assessment. Hence, this paper develops a method of neutrosophic numbers similarity measure based on arcsine function to address the expression of uncertain information in the risk factors of large-section tunnel. The uncertain information in risk factors is considered comprehensively and the comprehensive weight of tunnel risk factors is calculated by the analytic hierarchy process and the entropy weight method in this method, in order to provide a reference for similar tunnels.
Introduction
With the development of Chinese economy, the construction of underground engineering has entered a booming period. The growing demand for road transport poses new challenges for tunnel construction. Since the beginning of the 21st century, a great number of large-section tunnels have been built to meet the needs of economic development. However, large-section tunnel has high-risk coefficients and is prone to accidents such as collapse, water inflow and inrush, and large deformation damage. Therefore, it is essential for technicians to evaluate the risk level of large-section tunnel in order to construct them safely and smoothly.
In recent decades, significant research work has been conducted in relation to risk assessment methods for large-section tunnel. Various methods have been proposed, including the method of fuzzy comprehensive evaluation [1, 2], the cloud model [3, 4], the Bayesian network [5, 6], the Dempster-Shafer evidence theory [7, 8], the risk matrix method [9], and the fault tree method [10]. Moreover, some scholars have integrated and improved these methods for practical applications. For instance, Ziming Xiong (2018) [11] proposed a new multi-scale 3D geological modeling method, which analyzed limited sampling data and provided reasonable results for risk assessment in tunnel construction. Xianghui Deng (2018) [12] combined the fuzzy method and BP neural network to establish a risk evaluation model based on historical data from 50 tunnels. Wang Fan (2019) [13] applied non-parametric Bayesian networks to develop a knowledge-based expert system for tunneling risk analysis. To improve the accuracy of risk assessment results for construction projects, C. J. Lin (2020) [14] improved the normal cloud model to combine fuzziness and randomness in risk assessment. Jeongheum Kim (2022) [15] proposed a risk evaluation model for tunnel collapse based on the Analytic Hierarchy Process (AHP) technique and Delphi survey analysis.
However, in practical project scenarios, technicians are often unable to have a comprehensive understanding of the entire project due to the complex engineering geology, irregular hydrological factors, and limited survey technology. As a result, the risk factors associated with the tunnel are only partly certain. Unfortunately, the existing risk assessment methods have difficulty considering and expressing this uncertain and inconsistent information comprehensively, which ultimately affects the accuracy of the risk assessment. In recent years, neutrosophic theory, as a new theory to express uncertainty, has been widely accepted and applied in different fields, such as medical field [16–19], electrical engineering field [20–22], and computer field [23–25]. Neutrosophic numbers (NNs) are an important part of the neutrosophic theory, which can express the uncertain information of engineering data by adjusting the uncertain value. In the field of civil engineering, NNs can express uncertain information in engineering risk factors more concisely and comprehensively. Hence, they have important applications in landslide stability [26–28] and rock roughness identification [29–31]. In this paper, the NNs are applied to the risk assessment of large-section tunnel, and arcsine similarity measure method is proposed to calculate the risk level of tunnel samples, aiming to provide a fast and accurate method for risk assessment of large-section tunnel.
In the rest of the paper, Section 2 reviews the concept of NNs and their application in similarity measure. NNs arcsine similarity measure is proposed based on properties of similarity measure in section 3. In Sect. 4, the calculation steps of NNs arcsine similarity measure are introduced in detail. Section 5 introduces the engineering application and section 6 presents the comparative analysis. The conclusion of this paper and further research is given in section 7.
Preliminaries
In this section, the concept of NNs and their application in similarity measure is reviewed.
The concept of NNs
In 1998, Smarandache [32] introduced neutrosophic philosophy to mathematical problems, resulting in neutrosophic theory, which includes neutrosophic numbers (NNs). NNs are a crucial component of the neutrosophic theory, which enables the theory to express uncertain information. NNs express data information in the form of intervals to ensure that the uncertain part of the data will not be lost.
The general form of the NNs is expressed as U = s+tY, which consists of a deterministic part s and an uncertain part tY. For example, if the cross-sectional area of a tunnel is 160∼180 m2, assuming that the uncertain coefficient Y ∈ [0, 2.5], s is determined to be 160 and t is 8, resulting in the NN U = 160 + 8Y, where Y ∈ [0, 2.5].
There are two NNs U1 = s1 + t1Y and U2 = s2 + t2Y, then the basic algorithm of NNs is as follows [33, 34]:
The similarity measure is a kind of method to calculate the similarity of feature information according to a certain measure criterion [35]. On the basis of the NNs algorithm, the similarity measure calculation method of the NNs vector is introduced.
Assuming that there are two NNs vectors A={U
A
1, U
A
2, . . . , U
An
}, B={U
B
1, U
B
2, . . . , U
B
n}, U
Aj
, U
Bj
>0. The NNs elements in the vector are expressed as U
Aj
= s
Aj
+t
Aj
Y, U
Bj
= s
Bj
+t
Bj
Y (j = 1, 2, . . . , n), s
Aj
, t
Aj
, s
Bj
, t
Bj
≥0. In practical applications, the NNs elements are often normalized, so that U
Aj
, U
Bj
∈[0, 1]. The similarity measure D(A, B) of NNs should satisfy the following properties [36]: 0≤D(A, B)≤1; D(A, B)=D(B, A); D(A, B)=1, if and only if A = B; If A⊆B⊆C, then D(A, C)≤D(A, B) and D(A, C)≤D(B, C).
Ye Jun [37] proposed the NNs Dice similarity measure Equation (2) based on these properties.
However, Equation (2) has a drawback that the denominator becomes 0, when s Aj , s Bj , t Aj , t Bj = 0, resulting in Equation (2) unmeaningful.
To overcome the drawback, Ye Jun [38–40] proposed improved cosine similarity measure Equation (3) and tangent similarity measure Equation (4) based on the cosine function and tangent function.
Motivated by the improved cosine similarity measure Equation (3) and tangent similarity measure Equation (4), this paper proposes the arcsine similarity measure Equation (5).
The arcsine similarity measure F (A, B) should satisfy the following properties (S1-S4): 0≤F (A, B)≤1; F (A, B)=F (B, A); F (A, B)=1, if and only if A = B; If A ⊆ B ⊆ C, then F (A, C)≤F (A, B) and F (A, C)≤F (B, C).
(S2) Proof is straightforward.
(S3) For any two U
Aj
, U
Bj
, if U
Aj
= U
Bj
, this implies s
Aj
= s
Bj
, t
Aj
Y = t
Bj
Y for j = 1, 2, . . . , n. Hence,
(S4) If A ⊆ B ⊆ C, then there are s Aj ≤s Bj ≤s Cj ,
t Aj Y≤t Bj Y ≤ t Cj Y for j = 1, 2, . . . , n. Then, the following inequalities (6) are obtained:
Hence, F (A, C)≤F (A, B) and F (A, C)≤F (B, C) since the arcsine function is a decreasing function within the interval [0, sin (1)]. Therefore, the proofs of these properties are completed.
In order to facilitate the comparison of Equation (3) (4) (5), it is assumed that Y = 0, then U Aj =s Aj , U Bj =s Bj . Assuming that U Aj =0.1, U Bj =0.1, 0.2, 0.3, 0.4, 0.5, 0.6, 0.7, 0.8, 0.9, 1, then U Bj -U Aj =(j-1)×0.1, U Bj = j×U Aj , j = 1, 2, 3, . . . , 10. It can be concluded that U Bj -U Aj satisfies a linear relationship. The similarity measure values of U Aj , U Bj are calculated by Equation (3) (4) (5), as shown in Table 1 and Fig. 1.
Similarity measure values of UAj and U Bj
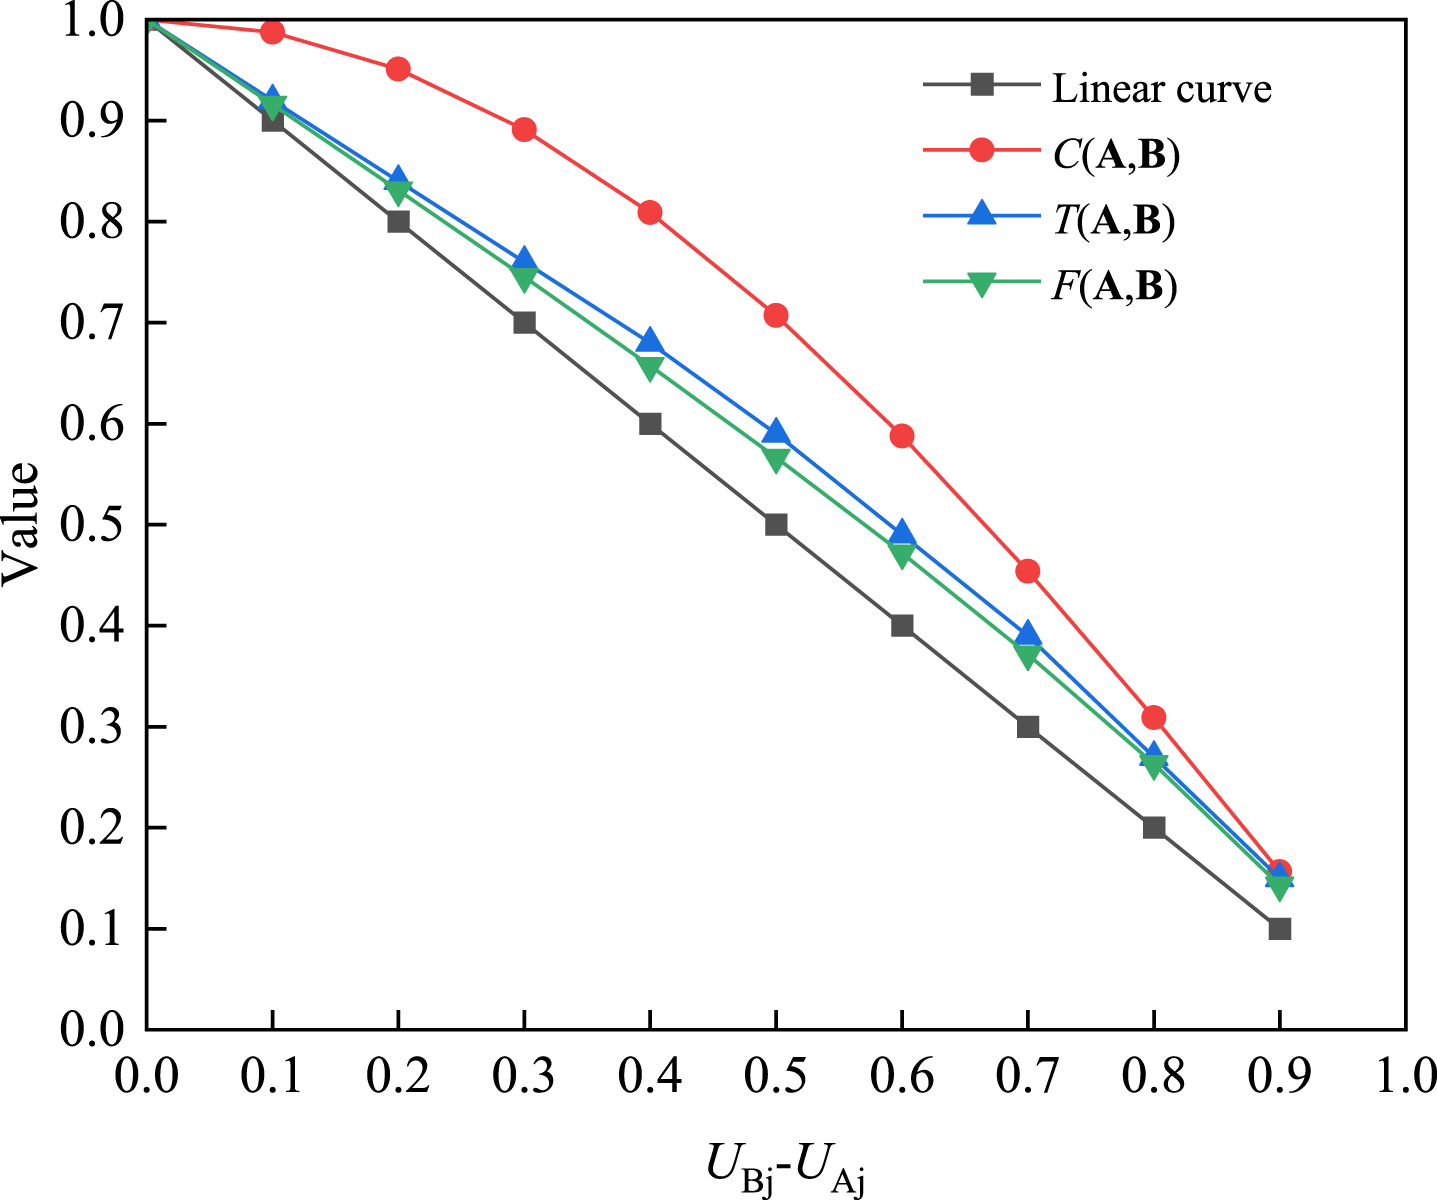
Comparison of three similarity measures.
As shown in Fig. 1, it can be seen that the curve of the arcsine similarity measure value is closer to the linear value curve in terms of slope and shape compared to the curves of cosine similarity measure value and tangent similarity measure value. This indicates that the arcsine similarity measure Equation (5) can reflect the linear relationship between U Aj and U Bj more reasonably.
The risk assessment process of NNs arcsine similarity measure in large-section tunnel is shown in Fig. 2.
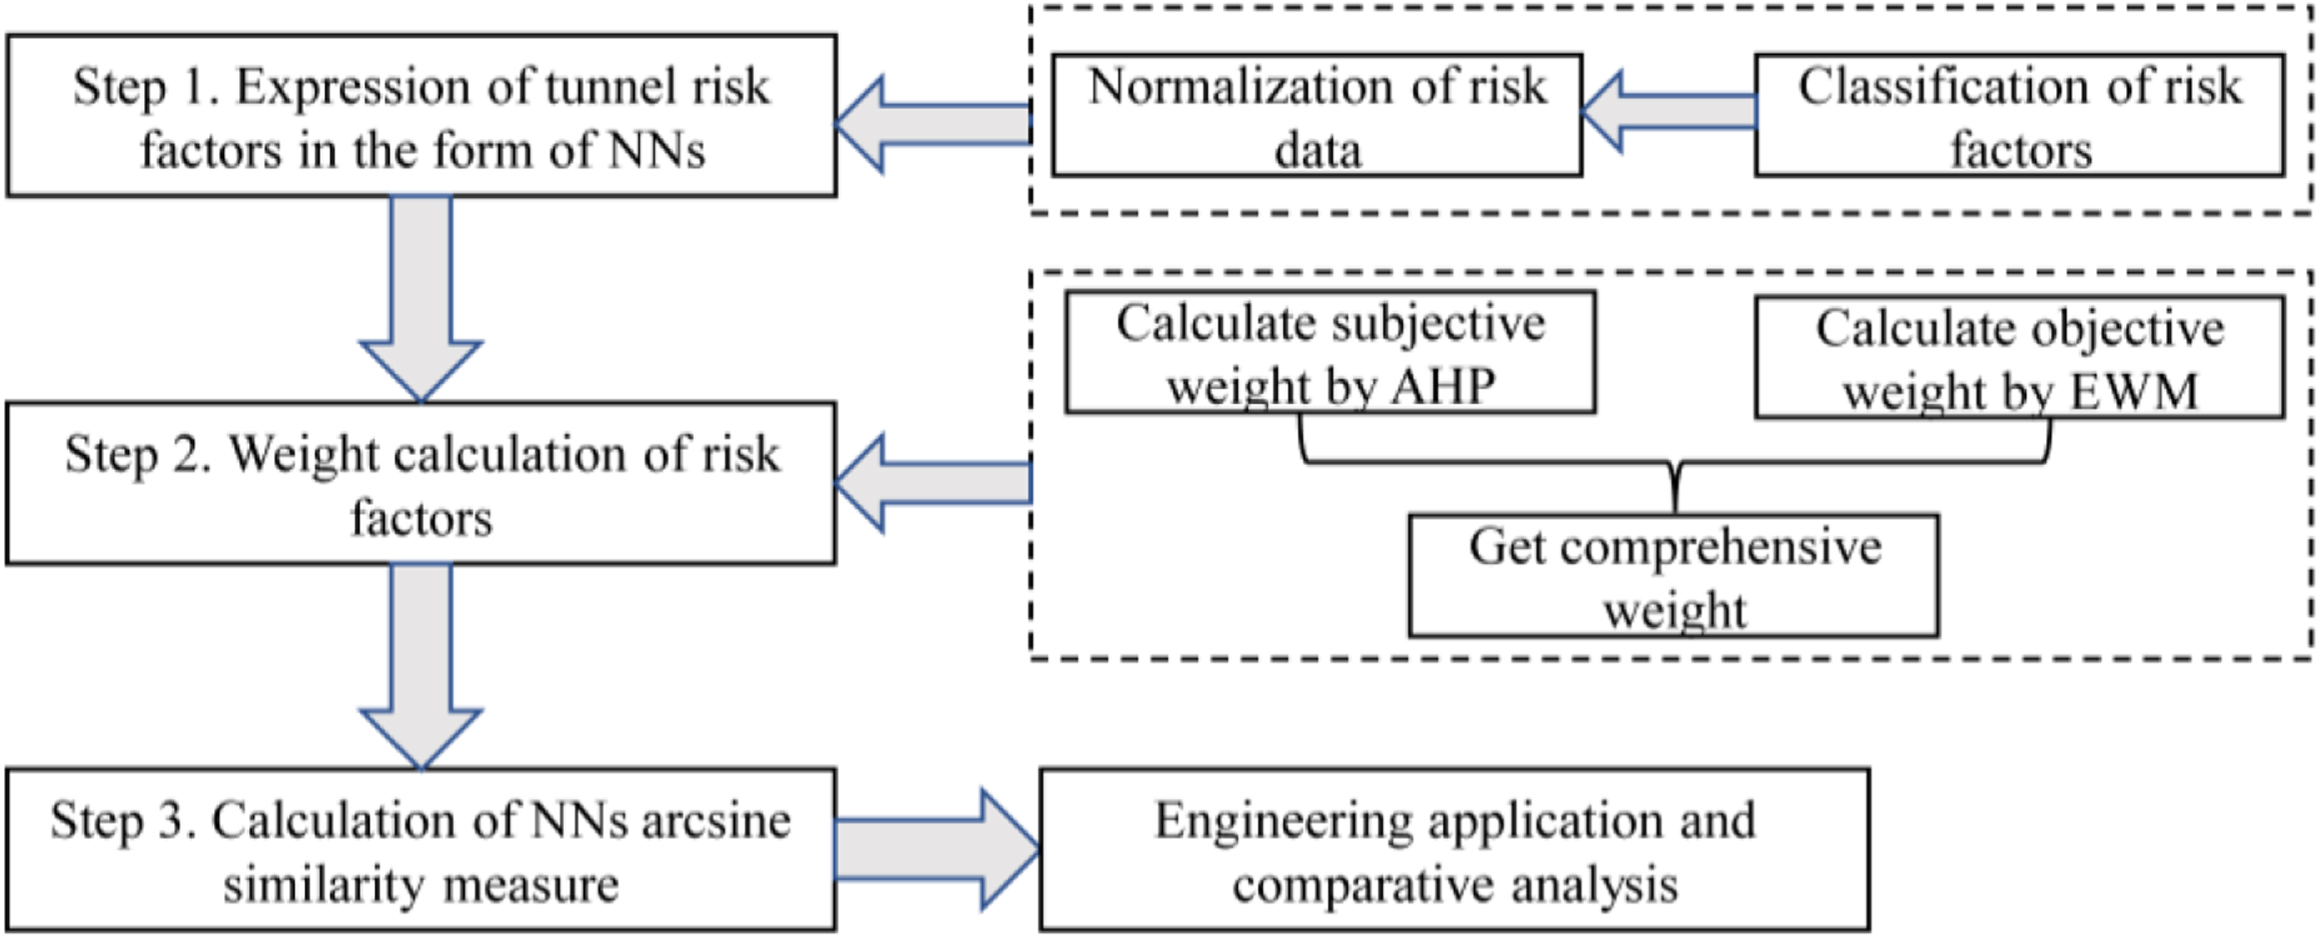
Steps for the method in this paper.
In tunnel construction, there are numerous potential risks, which can be roughly divided into engineering geological, design, and construction factors, as shown in Table 2. The factors of surrounding rock grade, burial depth, bias pressure, excavation span, cross-sectional area, and flat rate are considered as quantitative evaluation parameters. On the other hand, groundwater condition, design technology, excavation method, and construction management are considered qualitative evaluation factors.
The classification criteria of evaluation index
The grades of the surrounding rock in Table 2 are classified according to the integrity and strength of the rock mass. The shallower the burial depth of the tunnel, the more unfavorable it is to the stability of the tunnel. The bias pressure can usually be expressed by the slope of the hill, the greater the slope, the greater the risk. The groundwater condition is classified from lack to abundance with increasing risk levels. The rainfall during the construction period can also be considered together with the groundwater condition indicator. The design level is a comprehensive evaluation of the design plan of the design unit. For large-section tunnel, it involves targeted research, rigorous verification of load calculation methods, full reference to similar large-section tunnel engineering cases, and a reasonable and scientific design plan after expert discussions. If the design plan is deemed sufficient, the design level is classified as excellent. If the design plan lacks any of the above steps, its level is lowered accordingly based on the number of missing steps. The excavation methods are classified according to common methods used for the large-section tunnel. If an excavation method is not listed in Table 2, it can be evaluated based on its equivalent actual effect. The increase in the excavation span of a tunnel will reduce the stability of the surrounding rock. Especially for large-section tunnel, the increase in the span will greatly increase the risk level during the construction process. The level of construction management directly affects the construction quality of tunnel projects. First-class construction management is beneficial for controlling tunnel risks. The construction management level of construction companies can be evaluated from various aspects such as the technical level of engineering personnel, construction technical management systems, and construction technical equipment, so as to be classified into different levels. The level of construction management directly affects the construction quality of tunnel projects. First-class construction management is beneficial for controlling tunnel risks. The construction management level of construction companies can be evaluated from various aspects such as the technical level of engineering personnel, construction technical management systems, and construction technical equipment, so as to be classified into different levels.
The dimensions of risk factors in Table 2 are different, and mathematical calculations cannot be performed directly. Hence, it is necessary to normalize the data in Table 2 to the [0, 1] interval through certain calculations.
For the quantitative evaluation of risk factors (surrounding rock grade, burial depth, bias pressure, excavation span, cross-section area, flat ratio), the evaluation range is transformed into the [0, 1] interval, with data that has a positive effect on tunnel safety closer to 0 and data that has a negative effect on tunnel safety closer to 1, and then each level of data is transformed by interpolation. For example, the evaluation range of tunnel burial depth is between 10 and 60 meters. The shallower the burial depth, the greater the impact on the safety of the tunnel. When the burial depth is less than 10 meters, it is 1 in the interval [0,1]. According to the interpolation method, when the burial depth of the tunnel is between 20 and 40 meters, it is [0.6, 0.8] in the interval [0,1].
For qualitative risk factors evaluation (groundwater, design technology, excavation method, and construction management), design and construction experts provide numerical values within the interval [0, 1] based on their professional knowledge and engineering experience to reflect the degree of impact of each factor. After normalizing the data in Table 2, the normalized tunnel risk factor evaluation in Table 3 is obtained.
Normalized tunnel risk factor evaluation table
In order to express the deterministic and uncertain information of risk factors more simply and comprehensively, the interval values in Table 3 are expressed in the form of NNs. By setting the uncertain value Y∈[0, 0.25], Table 4 is obtained in the form of NNs.
Evaluation table of tunnel risk factors in the form of NNs
The Analytic Hierarchy Process (AHP) [41] and the Entropy Weight Method (EWM) [42, 43] are combined to attain the comprehensive weight vector of risk factors in the large-section tunnel.
Firstly, calculate subjective weight of risk factors by the AHP.
The AHP is used to compare pairwise the risk factors for the large-section tunnel, and the judgment matrix C is obtained. The evaluation criteria is shown in Table 5.
AHP judgment principles
Solve the characteristic root problem:
Where C is the judgment matrix, λmax is the largest eigenvalue, and ω is the eigenvector.
Calculate the geometric mean:
Calculate the relative weights:
Calculate the largest eigenvalue:
According to the matrix theory, when the consistency condition is satisfied, the judgment matrix C has only one maximum eigenvalue λmax=n. In practical applications, the judgment matrix C will deviate from complete consistency. When the deviation is within a certain range, it is considered acceptable.
Calculation of deviation consistency index:
At the same time, it is necessary to satisfy the requirement of random consistency ratio:
Secondly, calculate objective weight of risk factors by the EWM.
The EWM is used to analyze the degree of difference in indicator values and calculate the objective weight of each indicator.
Given n samples, each with m indicators, the original indicator value matrix X={xij}n ×m is constructed. The data in the matrix is normalized:
The final entropy weight method factor weight set is obtained by combining the entropy weights of each indicator.
Finally, the comprehensive weight of risk factors is got.
After obtaining the subjective weight set W=(w1, w2, . . . , w m ) by AHP and the objective weight set V=(v1, v2, . . . , v m ) by EWM, the comprehensive weight coefficient set is obtained K=(k1, k2,..., k n ).
The AHP and EWM are the representatives of the subjective weight analysis method and objective weight analysis method respectively, and their respective advantages and disadvantages are very obvious. Combining the AHP and EWM can effectively balance the subjectivity and objectivity of the weight analysis process. This approach allows for the ex-
In practical engineering applications, the relative importance of various risk factors varies. The comprehensive weight vector K=(k1, k2, . . . , k
n
) of tunnel risk factors is calculated using the method in step 2, where k
j
∈[0, 1],
The similarity measure values between the sample S and the five levels of the large-section tunnel are calculated by Equation (18). Then the five similarity measure values F (I, S), F (II, S), F (III, S), F (IV, S), F (V, S) are obtained. The grade corresponding to the maximum similarity value among the five calculated similarity values is the calculated grade of the sample. For example, if max (F)=F (I, S), it means that the calculated risk grade of the tunnel sample is I (negligible).
Yangjiashan tunnel is located in the province of Zhejiang, China. It is a key engineering project connecting the Hangzhou-Jinhua-Quzhou expressway and the Hangzhou-Shaoxing-Taizhou expressway, and it is the first double eight-lane large-section tunnel in Zhejiang province. The total length of the left tunnel is 320 m, and the right tunnel is 325 m. It is located in a low mountainous area and belongs to a mountain tunnel. The engineering characteristics of the Yangjiashan tunnel are its large-section area, weak surrounding rock, and shallow burial depth.
By reviewing the design information of the Yangjiashan tunnel project, the most unfavorable section of the tunnel is selected, and the risk indicator parameter Table 6 for the Yangjiashan tunnel is obtained.
Risk index parameters of Yangjiashan tunnel
Risk index parameters of Yangjiashan tunnel
Normalize the data in Table 6 and express it in the form of NNs. Set the uncertain value Y∈[0, 0.25] to obtain the parameter Table 7 of the risk index for the Yangjiashan tunnel in the form of NNs.
Risk index parameters of Yangjiashan tunnel in form of NNs
The comprehensive weight vector of the risk factors for Yangjiashan tunnel is calculated as K=(0.202, 0.060, 0.066, 0.062, 0.049, 0.140, 0.140, 0.067, 0.077, 0.137) by the AHP and the EWM. The arsine similarity measure values between the sample S of Yangjiashan tunnel and five risk levels are calculated as F(I, S)=0.539, F(II, S)=0.718, F(III,
S)=0.777, F(IV, S)=0.770, F(V, S)=0.716 by Equation (18). From the calculation results, it can be seen that F(III, S) > F(IV, S) > F(II, S) > F(V, S) > F(I, S), and thus max(F)=F(III, S). Therefore, the calculated risk level of the Yangjiashan tunnel is III (general risk).
In order to verify the effectiveness of the arcsine similarity measure Equation (18) proposed in this paper, the cosine similarity measure Equation (3) and the tangent similarity measure Equation (4) proposed by Ye Jun [21–23] are applied to the case of Yangjiashan large-section tunnel. Substituting the calculated comprehensive weight value vector K of tunnel risk factors into Equations (4), the cosine similarity measure Equation (19) and tangent similarity measure Equation (20) considering weight factors are obtained.
The cosine similarity measure values and tangent similarity measure values of the Yangjiashan tunnel sample S and the five risk levels are calculated by Equations (20), as shown in Table 8.
Comparison of the results of the three calculation methods
Comparison of the results of the three calculation methods
Bold values represent the maximum similarity measure value.
It can be seen from Table 8 that the calculation results of the cosine similarity measure method and the tangent similarity measure method are consistent with the result of the arcsine similarity measure method, which demonstrates the effectiveness of the arcsine similarity measure method proposed in this paper.
The fuzzy comprehensive evaluation method, cloud model method, Bayesian network method, D-S evidence theory, and other methods can also express uncertainty, but these methods are more about expressing uncertainty in objects and have difficulty expressing uncertainty of humans. For example, in the assessment of groundwater in tunnel risk factors, technical personnel cannot have a sufficient understanding of the groundwater conditions at the engineering site due to limited surveying techniques, irregular precipitation, and other reasons. Then, there will be uncertainty in their judgment of the groundwater conditions. This uncertainty maybe 10% or 20% for technical personnel. However, the existing risk assessment methods are difficult to express this kind of uncertainty judgment of humans, which may affect the risk assessment results of the actual project. The NNs arcsine similarity measure method can express this kind of uncertainty of technical personnel by adjusting the size of the uncertain value Y in the NNs. For example, for the judgment of groundwater conditions, the uncertain value Y can be set to Y∈[0, 0.20] to express the uncertainty judgment of technical personnel. By expressing the uncertainty of humans and objects, the tunnel risk assessment results proposed by the NNs similarity measure method will be more in line with the actual situation of the project, thus providing accurate risk assessment reference for technical personnel.
This paper presents the method of arcsine similarity measure in the form of NNs. The method is based on the fact that NNs can express uncertain information of risk factors more simply and comprehensively, which improves the accuracy of risk assessment. Compared with the existing cosine and tangent similarity measure formulas, the arcsine similarity measure formula proposed in this paper can express the linear relationship between samples more scientifically and reasonably. Considering that in practical engineering problems, the relative importance of each risk factor is different, the comprehensive weight value of the risk factors is calculated by the AHP and the EWM. Finally, this paper takes the Yangjiashan large-section tunnel in Zhejiang Province as an example to list the application process of this method, in order to provide a reference for the risk assessment of similar tunnels.
In this study, the weights of risk factors are calculated comprehensively by the AHP and the EWM. In future research, more scientific and reasonable methods can be used to calculate the weights of risk factors. The NNs arcsine similarity measure method can reasonably consider and express uncertain information of risk factors, and it can be applied to more engineering fields in the future, such as risk assessment of long-span bridges, research on foundation pit collapse risk, and stability assessment of large dams.
Footnotes
Acknowledgments
This work was supported by the National Natural Science Foundation of China (Grant No. 52278402, 42207176), the Zhejiang Provincial Natural Science Foundation of China (Grant No. LZ22E080008), Ningbo Natural Science Foundation (Grant No. 2022J116), and the Scientific Research Plan Project of Zhejiang Provincial Department of Transportation (2019019).