






Abstract
BACKGROUND:
Patients with cerebrovascular disorders (CVDs) tend to exhibit impulsive behaviour without controlling their movements, leading to difficulty in performing activities of daily living and an increased risk of accidents. This hastiness, termed ‘pacing impairment’, has been studied but is not fully understood.
OBJECTIVE:
To experimentally examine the kinetic features of pacing impairment by focusing on changes in speed and investigating neuropsychological substrates.
METHODS:
We instructed 53 inpatients with CVDs, 20 orthopaedic inpatients, and 20 healthy participants to trace a 200 mm-sided square as slowly as possible for 120 seconds. We measured the tracing length and mean acceleration and examined the relationship between these measurements, neuropsychological symptoms, and lesion sites.
RESULTS:
Gradual acceleration in drawing, i.e., decline in motor suppression, was observed more frequently in the CVD group than in the control groups. Excessive acceleration was associated with unilateral spatial neglect, frontal lobe signs, and attention disorders but not with motor impersistence. Additionally, the incidence of excessive acceleration did not differ between left and right hemisphere lesion subgroups and was not associated with any specific lesion site.
CONCLUSION:
Pacing impairment can manifest as general or holistic deficits in attentional function widely distributed throughout the cerebral hemispheres.
Keywords
Introduction
Diller and Weinberg (1970)reported that the slowness and quickness of individuals with right and left hemiplegia, respectively, are associated with a history of multiple accidents. Rapport et al. (1993) suggested that impulsivity and attention disorders, assessed using a questionnaire and neurological assessments, are related to falls in patients with right hemisphere damage. In addition to the risk of falls and accidents, patients with cerebrovascular disorders (CVDs) tend to have difficulty adjusting the speed of intended actions to the situation, for example, they may eat too quickly or move a wheelchair before completing safety settings. Although these symptoms are well-known in clinical practice, to our knowledge, studies published in English have not investigated the underlying pathophysiology. However, rehabilitation research in Japan has focused on addressing this hasty nature of patients with CVD, and studies have investigated the pathophysiology of this symptom, an entity of higher brain dysfunction, ‘pacing impairment’ (Miyamori, 1988).
Most of these previous studies experimentally examined the relationship between the line-tracing speed of patients and other clinical symptoms or cerebral lesions using the ‘square-tracing task’ developed by Hirabayashi et al. (1998). The methods section of this manuscript describes the square-tracing task in detail. Thus far, pacing impairment has been associated with motor impersistence (MI) (Hirabayashi et al., 1991; Numata et al., 2003), unilateral spatial neglect (USN) (Hamada et al., 2000), and attention deficit (Yotsumoto et al., 2010), while no apparent association with MI (Hamada et al., 2000) or USN (Hirabayashi et al., 1991; Numata et al., 2003) has also been reported. It seems difficult to attribute pacing impairment to any previously known neuropsychological symptom. Concerning the lesion locus responsible for this symptom, studies have reported the right frontal lobe region perfused by the middle cerebral artery adjacent to the watershed region (Hirabayashi et al., 1991, 2008). However, lesions in the left hemisphere can also present pacing impairment (Hamada et al., 2000, Hirabayashi et al., 1998).
The current summary of these studies is that although pacing impairment and symptoms such as USN, MI, and attention deficit may share a partially common pathological basis, they are mutually independent symptoms (Hamada et al., 2000, Hirabayashi et al., 2008). However, previous studies have not considered this important question: Is the hastiness of patients with CVD uniformly fast, or does it change over time (does it gradually become faster, or does it start fast and slow down over time)?
Therefore, in this study, we aimed to clarify the detailed pathophysiology of pacing impairment by measuring the tracing speed (trace length within 120 seconds) as the conventional method as well as acceleration in the square-tracing task. The study also examined whether pacing impairment can be attributed to other symptoms and whether it is related to a specific cerebral lesion or lateralised to the left or right hemisphere by examining the relationships between these measurements and neuropsychological symptoms or lesion sites.
Material and methods
Participants
The study participants included 53 inpatients with CVD, 27 and 26 of whom had cerebral haemorrhages and infarctions, respectively (CVD group: 33 men/20 women; age range: 39–91 years [median, 69.0]; days after onset: range, 24–213 days [median, 97.0]). Of the patients with CVD, 27 and 26 had damage in their right and left cerebral hemispheres, respectively. The study also included two control groups comprising (1) 20 orthopaedic inpatients with fractures of the spine or lower limbs or amputation of the lower limbs (orthopaedic disease [OD] group: 10 men/10 women; age range: 43–88 years [median, 73.0]), and (2) 20 healthy persons (healthy control [HC] group: 10 men/10 women; age range: 40–83 years [Median, 66.5]). Members of the HC group were recruited from the hospital staff and family members of the patients. Age and sex composition did not differ significantly between the three groups; all patients were right-handed. Lesion sites in the CVD group were confirmed using computed tomography or magnetic resonance imaging.
The exclusion criteria for the CVD group were as follows: 1) history of multiple CVDs; 2) bilateral hemispheric lesions except a few lacunae that were asymptomatic before the onset of stroke; 3) diagnosis of other neuropsychiatric disorders before the onset of stroke; 4) difficulty in understanding instructions for tasks due to consciousness disorders or severe aphasia; and 5) difficulty in performing the square-tracing task and other neurological examinations due to motor or visuospatial impairment. Participants underwent a preliminary trial to determine whether the task was understood and performed appropriately. The exclusion criteria for the OD and HC groups were as follows: 1) a history of neuropsychiatric disorders and 2) a Mini-Mental State Examination (MMSE) (Vertesi et al., 2001) score≤23.
We provided all participants and, where necessary, the family members of some patients in the CVD group, with verbal and written explanations of the study. We obtained written informed consent from all participants, and the study was approved by the Ethics Committee of our institution (2017-206, 2018-11).
Procedure
Neuropsychological assessments
We used (1) MMSE, (2) Raven’s Coloured Progressive Matrices (Raven, 1976), (3) MI test, (4) line bisection test, (5) Frontal Assessment Battery (FAB) (Dubois et al., 2000), and (6) subtests of Clinical Assessment for Attention (Japan Society for Higher Brain Dysfunction, 2006) including digit span, tapping span, and visual cancellation (i.e., targets: triangle for symbol cancellation test and numeral ‘3’ for digit cancellation test) to assess the neuropsychological functions of participants in the CVD group. MI was defined as < 20 seconds of eye closure followed by eye-opening with simultaneous tongue protrusion. USN tendency was rated by the line bisection test score (0 to 9) using the Japanese version of the behavioural inattention test, with lower scores indicating more severe USN (Ishiai, 1999). We used MMSE to assess the cognitive function of the participants in the OD and HC groups.
Square-tracing task
All participants performed the square-tracing task developed by Hirabayashi et al. (1998) (Fig. 1). In this task, the examiner asked the participants to trace a 200 mm -sided square printed on an A3-sized paper with a pencil as slowly as possible and measured the length traced in 120 seconds. The examiner instructed the participants in the CVD group to use only the hand ipsilateral to their cerebral lesions, whereas those in the OD and HC groups used both hands separately. In the original method (Hirabayashi et al., 1998), tracing was performed clockwise with either hand. However, in this study, tracing was performed clockwise if the right hand was used and counter-clockwise if the left hand was used, and the hand not used was placed on the knee or an armrest. Before performing the task, the examiner provided the following instruction: ‘From the start point, trace along the sides of the square drawn on the paper as slowly as possible, without stopping or lifting the pencil’. Each participant’s tracing motion was recorded using three video cameras installed at the front, contralateral to the hand, and above the front of the patient.

Square-tracing task
We measured the length traced within the first 120 seconds. Then, we divided the 120 seconds into 24 sections of 5 seconds each, and we measured the trace length during each section using ImageJ 1.51 (Schneider et al., 2012) image processing software. We calculated the mean tracing speed (mm/s) for all 24 sections for each patient. Furthermore, we calculated the mean acceleration (mm/s2) of tracing during the full 120 seconds using the linear approximation formula for the changes in speed in the 24 sections of 5 seconds.
We set the cut-off values for trace length and average acceleration at the third quartile plus 1.5 times the interquartile range (IQR) of the respective values in the HC group to detect impeded task performance in the CVD and OD groups. We classified individuals who exceeded the cut-off values of the trace length and mean acceleration as the ‘excessive speed’ and ‘excessive acceleration’ subgroups, respectively.
We examined the relationship between trace length and mean acceleration in the CVD group using Spearman’s rank correlation coefficient. Next, we compared the trace length and mean acceleration between the three groups using the Kruskal–Wallis and Mann–Whitney U tests. After confirming that there was no difference in performance between the left and right hands in the OD and HC groups, we used data from the right hand for all between-group comparisons. The performances of subgroups of the CVD group with right- and left-sided lesions were also compared using the Mann–Whitney U test.
Relationship between age/days after onset and performance on the square-tracing task
We analysed the relationships of the trace length and mean acceleration with age in the CVD group and HC group using Spearman’s rank correlation coefficient. We also examined the relationships of the trace length and the mean acceleration with the number of days after onset in the CVD group.
Relationship between performance in the square-tracing task and neuropsychological assessments
We analysed the relationships of trace length and mean acceleration with neuropsychological assessments in the right and left hemisphere lesion subgroups using Spearman’s rank correlation coefficient. We also examined the relationship of MI with trace length and mean acceleration, comparing the measurements between the presence and absence of MI using Mann–Whitney U test.
Relationship between lesion sites and performance in the square-tracing task
We divided the patients in the CVD group into two subgroups based on the side of the lesion. We compared the proportion of individuals with ‘excessive speed’ and ‘excessive acceleration’ in the two subgroups using Fisher’s exact test.
Additionally, we divided the patients in the CVD group into two subgroups depending on whether the lesion involved the thalamus or basal ganglia (i.e., caudate nucleus, putamen, and globus pallidus). We compared the proportion of individuals with ‘excessive speed’ and ‘excessive acceleration’ in the two subgroups using Fisher’s exact test.
We performed all statistical analyses using SPSS version 28 (IBM Corp., Armonk, NY, USA). A post-hoc test of statistical power was performed for statistically significant results using G*power 3.1.9.7 (Faul et al., 2009) to examine the sufficiency of the sample size.
Results
Square-tracing task
We analysed the data of all participants without missing values. Figure 2 shows the performance of the three groups in the square-tracing task. Of the 53 patients, 20 (9 with right- and 11 with left-sided lesions) in the CVD group and 7 (2 traced using the right hand, 2 using the left hand, and 3 using both hands) of 20 patients in the OD group had ‘excessive speed’. In these patients, the trace lengths of each hand were above the third quartile plus 1.5 times the IQR of those in the HC group (626.9 mm using the right hand and 694.5 mm using the left hand).
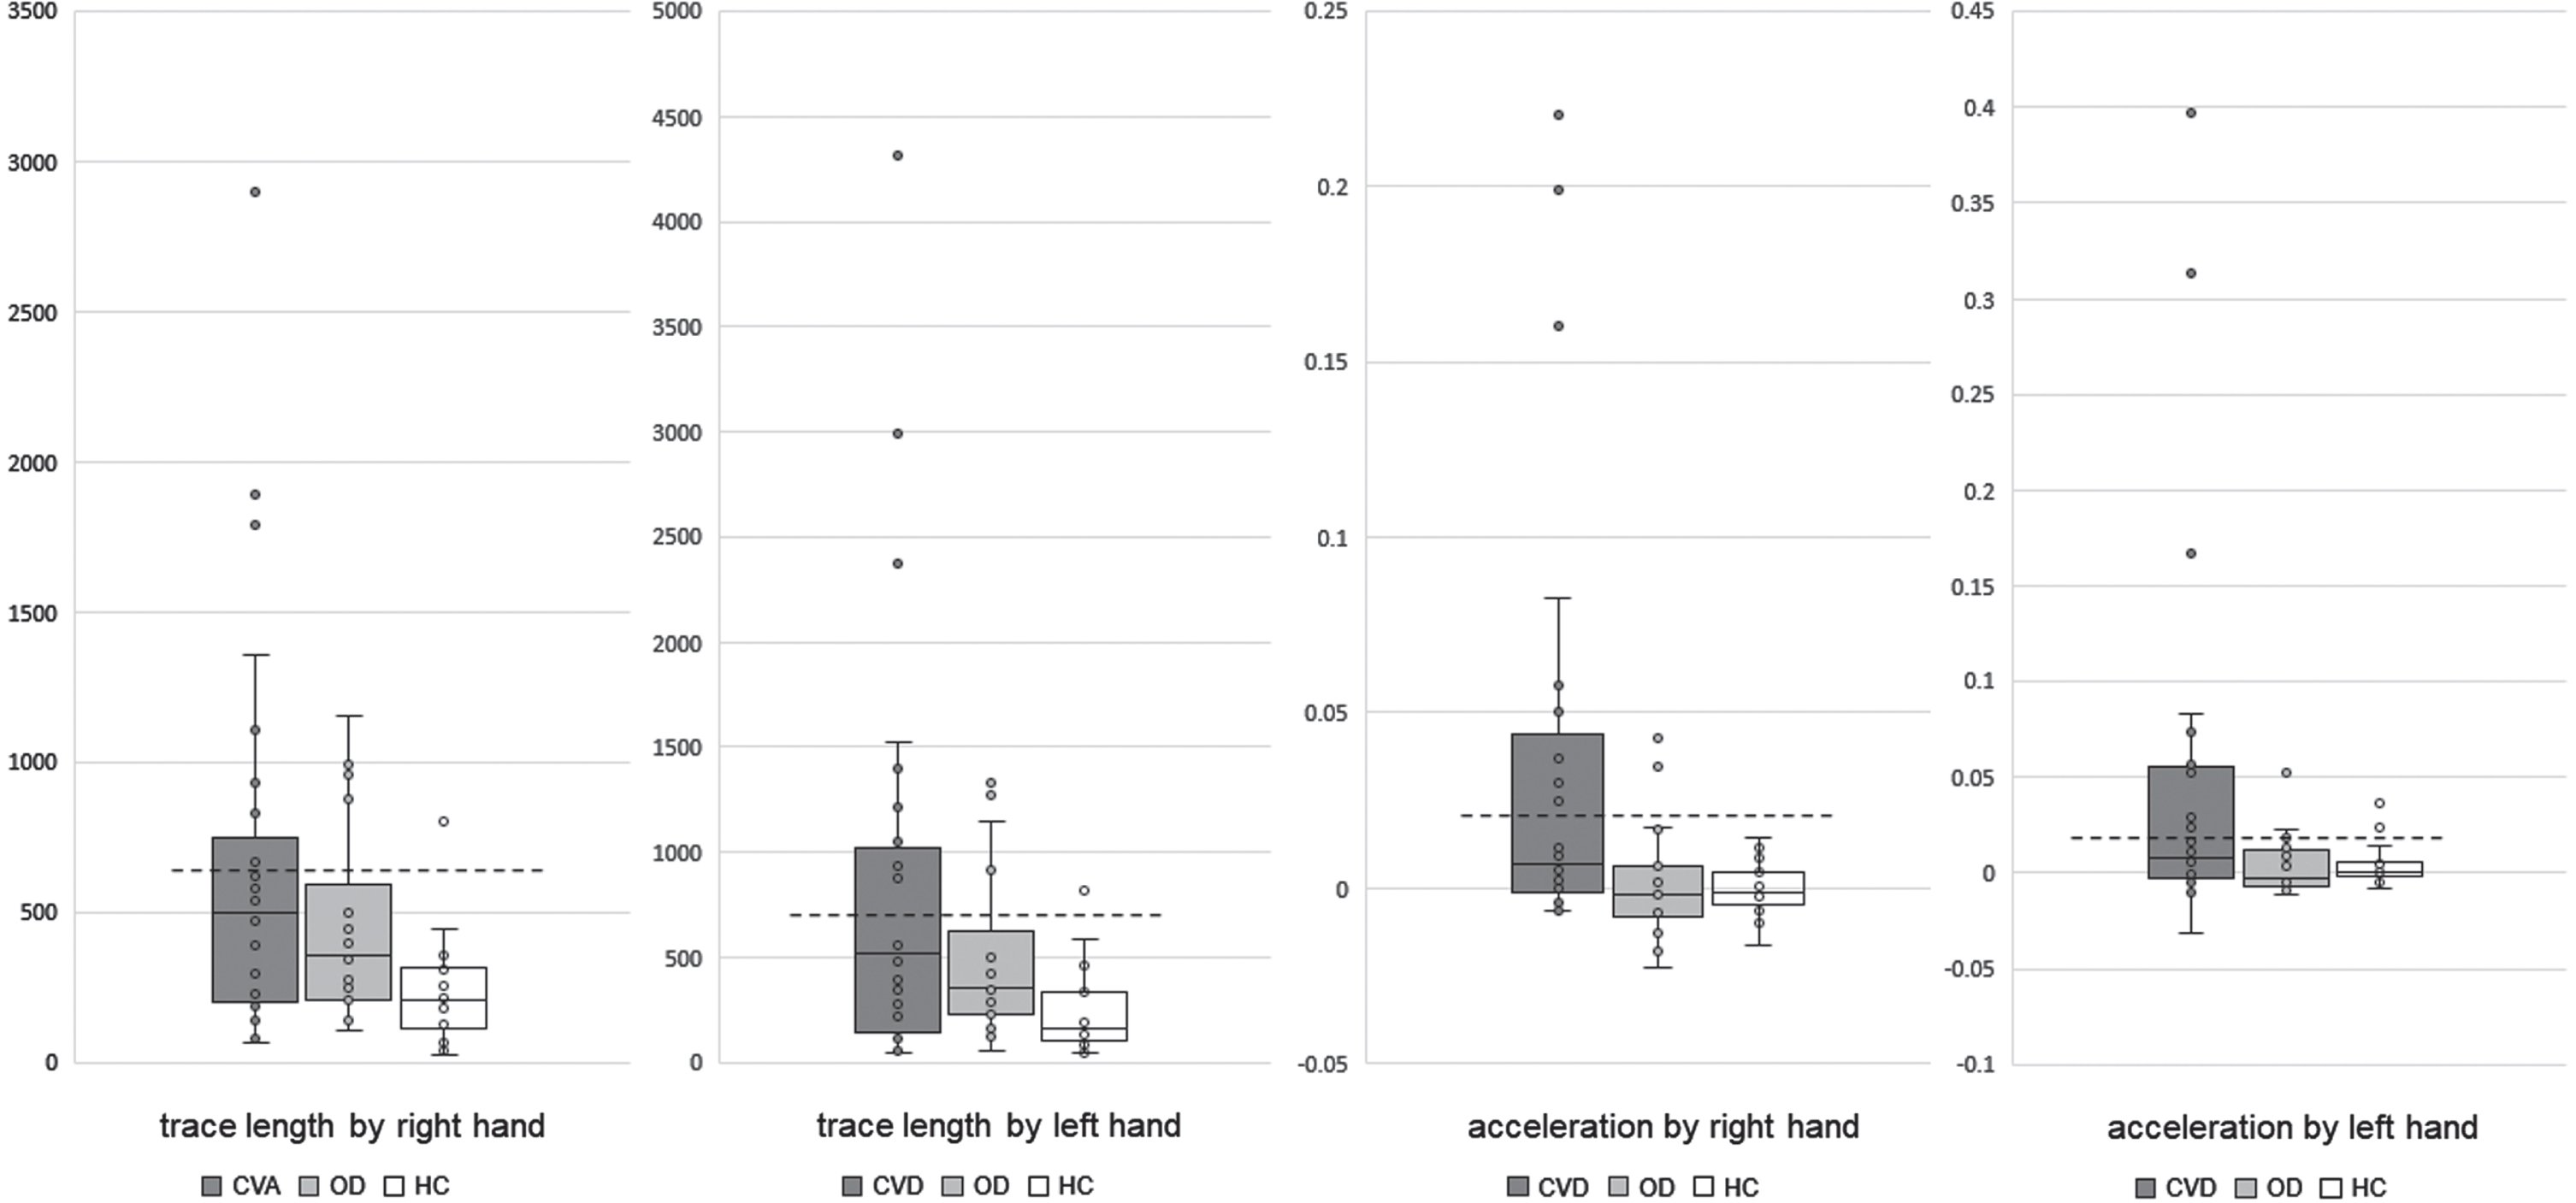
Trace length and acceleration distribution. Patients with CVD performed the task using the hand on the non-paralysed side; however, the HC and OD groups performed this task with both hands. The dotted line indicates the cut-off value. CVD, cerebrovascular disorder; OD, orthopaedic disease; HC, healthy controls.
Regarding mean acceleration, 22 (11 with right- and 11 with left-sided lesions) of the 53 patients in the CVD group and 4 (2 traced using the right hand and 2 using the left hand) of the 20 patients in the OD group had ‘excessive acceleration’ above the third quartile plus 1.5 times the IQR of those in the HC group (0.0183 mm/s2 using the right hand and 0.0164 mm/s2 using the left hand).
Trace length and mean acceleration were positively correlated in the CVD group (ρ= 0.731, p < 0.01). While ‘excessive speed’ and ‘excessive acceleration’ were present and overlapped in 16 patients, ‘excessive speed’ alone was observed in 4 patients and ‘excessive acceleration’ alone in 6 others.
Trace lengths in the CVD and OD groups were significantly longer than those in the HC group (p < 0.05). No significant difference in trace length was observed between the CVD and OD groups. The mean acceleration in the CVD group was significantly higher than those in the OD and HC groups (p < 0.05). No significant difference in trace length or mean acceleration was observed between the two CVD subgroups in the right and left hemispheres.
Statistical power was calculated as the post hoc test for above significant results. 1-β error for all of them was≥0.80.
Age and trace length were positively correlated in the HC group and the CVD group (HC group: ρ= 0.649, p = 0.002, CVD group: ρ= 0.341, p = 0.012). No significant correlation was observed between the age and mean acceleration in the two groups.
No significant correlation of the trace length or mean acceleration with the number of days after onset was observed in the CVD group.
Statistical power was calculated as the post-hoc test for the abovementioned significant results. 1-β error for both was > 0.80.
Relationship between neuropsychological assessments and performance on the square-tracing task
Table 1 shows the correlation between the performance of the patients in the square-tracing task and the scores for neuropsychological signs or symptoms in the CVD group. The presence of MI was not associated with performance on the square-tracing task in either the right or left hemisphere lesion subgroup. In the right hemisphere lesion subgroup, the line bisection test score showed significant negative correlations with trace length and mean acceleration. In contrast, verbal fluency and tapping span (forward) only showed a significant negative correlation with mean acceleration. In the left hemisphere lesion subgroup, the RCPM score showed a negative correlation only with mean acceleration; FAB global score/word fluency showed significant negative correlations with both trace length and mean acceleration, whereas the instructions/similarities in FAB and tapping span (forward and backward) in the subtests of Clinical Assessment for Attention showed negative correlations only with trace length.
Correlations between neuropsychological tests and trace length or acceleration in the square tracing task
Correlations between neuropsychological tests and trace length or acceleration in the square tracing task
Numbers are spearman’s ρ. †:Fisher’s exact test. n.s.: not significant. *: p < 0.05. **: p < 0.01.
Statistical power was calculated as the post hoc test for the results showing significant correlation coefficients: 1-β error > 0.8 for ρ> 0.513, 1-β error > 0.7 for ρ> 0.471, 1-β error > 0.65 for ρ> 0.445, and 1-β error < 0.65 for ρ< 0.427.
Of the 27 patients with right hemisphere lesions, 9 showed ‘excessive speed’, and 11 showed ‘excessive acceleration’. Of the 26 patients with left hemisphere lesions, 11 showed ‘excessive speed’ and 11 showed ‘excessive acceleration’. No difference in the incidence of these phenomena was observed between the two groups.
Of the 37 patients with lesions in the thalamus or basal ganglia, 14 showed ‘excessive speed’ and 16 showed ‘excessive acceleration’. Six of the 16 patients with lesions in other cerebral regions showed ‘excessive speed’ and six showed ‘excessive acceleration’. No difference was observed in the incidence of these phenomena between when the lesion included the thalamus or basal ganglia.
Discussion
The novelty of this study is the attempt to measure and analyse changes in speed during the square-tracing task and, based on the results, the attempt to re-examine whether pacing impairment is due to known symptoms of higher brain dysfunction or the involvement of specific brain lesions, which are unresolved issues in the literature.
There was a significant difference in the mean acceleration between the CVD and OD groups, which could not be demonstrated using the conventional measure of trace length at 120 seconds, i.e., speed. In other words, motor suppression rapidly attenuates on a timescale of tens of seconds in patients with CVD.
The correlation between trace length/mean acceleration and neuropsychological assessments in the CVD group also presents several new findings (Table 1). First, MI showed no apparent association with either mean acceleration or trace length, regardless of whether it was a right or left hemisphere lesion. Second, the degree of USN (linear bisection test) correlated with trace length and mean acceleration only in patients with right hemisphere lesions.
Third, the results of various subtests for frontal lobe dysfunction and generalised attention disorder showed that the functional deficits in the right hemisphere lesion subgroup correlated only with mean acceleration and not with trace length. In contrast, the functional deficits in the left hemisphere lesion subgroup had more items that correlated with trace length than with mean acceleration. This third finding suggests that the correlation reflects the different roles of the right and left hemispheres in maintaining movement control. However, despite these different characteristics, no apparent difference in performance on the tracing task was observed between the two subgroups.
In summary, the results of the present study and those of previous studies suggest that it is difficult to attribute pacing impairment to any known specific neuropsychological symptom. Rather, these findings suggest that this symptom can be manifested by disorders of various attentional functions scattered across a wide range of cerebral regions; whether directional or generalised attention and whether right or left hemispheric function.
The results of the present study at the lesion site also support this hypothesis. Most studies have emphasised the association between pacing impairment and lesions in the right hemisphere (Hirabayashi et al., 1991, 1998, 2008; Miyamori, 1988; Yotsumoto et al., 2010), particularly in the deep frontal lobe (Hirabayashi et al., 1991); however, the incidence of trace length and excessive acceleration did not differ between right and left hemisphere lesions, and no specific common lesion was found.
It is easy to speculate that damage to the supplementary motor cortex, which is involved in deliberate motor control, the dorsolateral prefrontal cortex, which is involved in sustained attention and self-monitoring, or the cortico-basal ganglia-thalamo-cortical loop (Alexander & Crutcher, 1990), which carries those functional systems, would cause pacing impairment. The presence of these lesions may be sufficient for the development of this symptom; however, these lesions may not always be necessary. Damage to the posterior cerebral regions involved in the visual, somatosensory, or other perceptual aspects of attentional function required to perform the tracing task is also presumed to cause this symptom.
From the results of this study, it should be noted that excessive speed and acceleration were also observed in patients with ODs. High load-bearing tasks, such as maintenance of deliberate motor control for extended periods, are only possible with a well-developed and fully functioning brain. Moreover, even central nervous system dysfunction without obvious organic damage, including ageing or physically inactive states, may interfere with such higher cognitive tasks. One of the results of this study that the age correlated with the trace length in the HC group may also support this speculation. It is possible to interpret higher brain function from a holistic perspective, in which symptoms are not solely determined by the local function of the damaged region but result from a breakdown in the integration of brain function and regression to an earlier developmental level of function.
This study has several limitations. First, we excluded patients with severe aphasia, obvious motor deficits, or visual and spatial deficits. Therefore, we included only a few cases with lesions expanding to the cerebral cortex, and patients with subcortical lesions were prominent in the sample population. Hence, the extent to which the relationship between lesion location and neuropsychological symptoms could be examined was limited. Second, most of the participants with CVD in this study were in the subacute phase, and whether similar experimental findings of pacing impairment can be obtained in the chronic phase is unclear. Third, the acceleration of movement was observed in the experiment using the tracing task alone, and the relationship between the change in movement speed and the risk of falling in actual activities of daily living situations was not examined. Future studies should examine the correlation between the results of the present experimental study and other ecological assessments of pacing disorder based on behavioural observations to confirm the validity of the assessment method.
Conclusion
Many patients with CVD present with a rapid decline in their ability to maintain deliberate motor control due to various lesions. Rehabilitation efforts focused on motor speed control may reduce the risk of falls and other accidents and improve activities of daily living in patients with CVD.
Footnotes
Acknowledgments
The authors thank the participants for their time and effort and their staff for cooperating in recruiting patients and collecting and analysing data.
Conflicts of interest
The authors declare no conflicts of interest.
Ethics statement
This study was approved by the Ethics Committee of our institution (2017-206, 2018-11), and the study procedures were in accordance with the ethical standards of the 1964 Declaration of Helsinki.
Informed consent
Written informed consent was obtained from all participants.
Funding
The authors report no funding.