
Abstract
OBJECTIVE:
To evaluate the utility of radiomics analysis for differentiating benign and malignant epithelial salivary gland tumors on diffusion-weighted imaging (DWI).
METHODS:
A retrospective dataset involving 218 and 51 patients with histology-confirmed benign and malignant epithelial salivary gland tumors was used in this study. A total of 396 radiomic features were extracted from the DW images. Analysis of variance (ANOVA) and least-absolute shrinkage and selection operator regression (LASSO) were used to select optimal radiomic features. The selected features were used to build three classification models namely, logistic regression method (LR), support vector machine (SVM), and K-nearest neighbor (KNN) by using a five-fold cross validation strategy on the training dataset. The diagnostic performance of each classification model was quantified by receiver operating characteristic (ROC) curve and area under the ROC curve (AUC) in the training and validation datasets.
RESULTS:
Eight most valuable features were selected by LASSO. LR and SVM models yielded optimally diagnostic performance. In the training dataset, LR and SVM yielded AUC values of 0.886 and 0.893 via five-fold cross validation, respectively, while KNN model showed relatively lower AUC (0.796). In the testing dataset, a similar result was found, where AUC values for LR, SVM, and KNN were 0.876, 0.870, and 0.791, respectively.
CONCLUSIONS:
Classification models based on optimally selected radiomics features computed from DW images present a promising predictive value in distinguishing benign and malignant epithelial salivary gland tumors and thus have potential to be used for preoperative auxiliary diagnosis.
Keywords
Introduction
Salivary gland tumors show a striking range of morphological diversity among complex pathological types. In 2017, the fourth World Health Organization (WHO) classification divided salivary gland tumors into five categories, namely, benign epithelial, malignant epithelial, soft tissue, lymphoid and hematopoietic, and secondary tumors. The most common type of primary benign epithelial tumors is pleomorphic adenomas, followed by Warthin tumors, whereas other tumors are relatively rare. The top three primary malignant epithelial tumors include mucoepidermoid, adenoid cystic, and acinic cell carcinomas [1]. The biological behavior of different tumor types varies. The discrimination between benign and malignant salivary gland tumors is important because it affects treatment planning and disease prognosis prediction [2].
Magnetic resonance imaging (MRI) provides high soft-tissue resolution and has become thpreferred method in preoperative diagnosis of benign and malignant salivary gland tumors [3–5]. However, the diagnose value of several imaging features, such as well- or ill-defined margin, homogeneity or heterogeneous internal signal with cystic or necrotic change, and signal intensity, appears to be controversial due to a wide spectrum of morphologic diversity among different histologic subtypes, especially between benign and low-grade malignant tumors [6–8]. Recently, diffusion-weighted imaging (DWI) and apparent diffusion coefficient (ADC) mapping have been proven to be potentially useful techniques for evaluating the characteristics of salivary gland tumors [9–11]. However, other studies indicated that determination of thresholds in distinguishing benign from malignant tumors solely on the basis of DWI remains difficult because of the overlap of mean ADCs [12, 13]. Thus, no consensus has been established with regard to the role of DWI in differentiating salivary gland tumors. Radiomics has been widely used in tumor research to extract high-throughput data by characterizing intratumoral heterogeneity to develop diagnostic, predictive, or prognostic models for improving clinical treatment planning [14, 15]. First-order parameters based on ADC histogram and texture analysis by using unenhanced and contrast-enhanced T1-weighted images may characterize parotid gland tumors, which were conducted in a smaller patient cohort [16, 17]. Compared with texture analysis mentioned above, radiomics combines many quantitative image features to build signatures and obtain a more comprehensive evaluation of the characteristics of tumor phenotypes [18–20].
In this study, we extracted a large panel of radiomic features from DWI of 269 patients with epithelial salivary gland tumors. Machine learning-based feature selection and classification approaches were performed in a training cohort and tested in a validation cohort. We hypothesized that combining optimal machine-learning model and radiomics data will differentiate epithelial salivary gland tumors.
Materials and methods
Patients and image acquisition
This retrospective study was approved by the institutional review board of our institution with waiver of written informed consent requirement. From January 2015 to April 2019, 336 consecutive patients with histopathologically proven epithelial salivary gland tumors who underwent DW MR imaging examination were enrolled in this study. The inclusion criteria were as follows: (a) DWI scanning was performed on the same 3.0 T MR scanner, (b) no history of any therapy before surgery, and (c) maximum diameter of the tumor was greater than 5 mm. The exclusion criteria were as follows: (a) incomplete clinical or imaging data, (b) biopsy was administered before MR scan, and (c) presence of severe susceptibility or motion artifacts. Finally, 269 patients were enrolled in this study and randomly assigned to the training (n = 214) and validation (n = 55) datasets in a ratio of 8 : 2 (Table 1). A flow diagram for the study population is presented in Fig. 1.
Patient distribution in the training and testing data sets
Patient distribution in the training and testing data sets
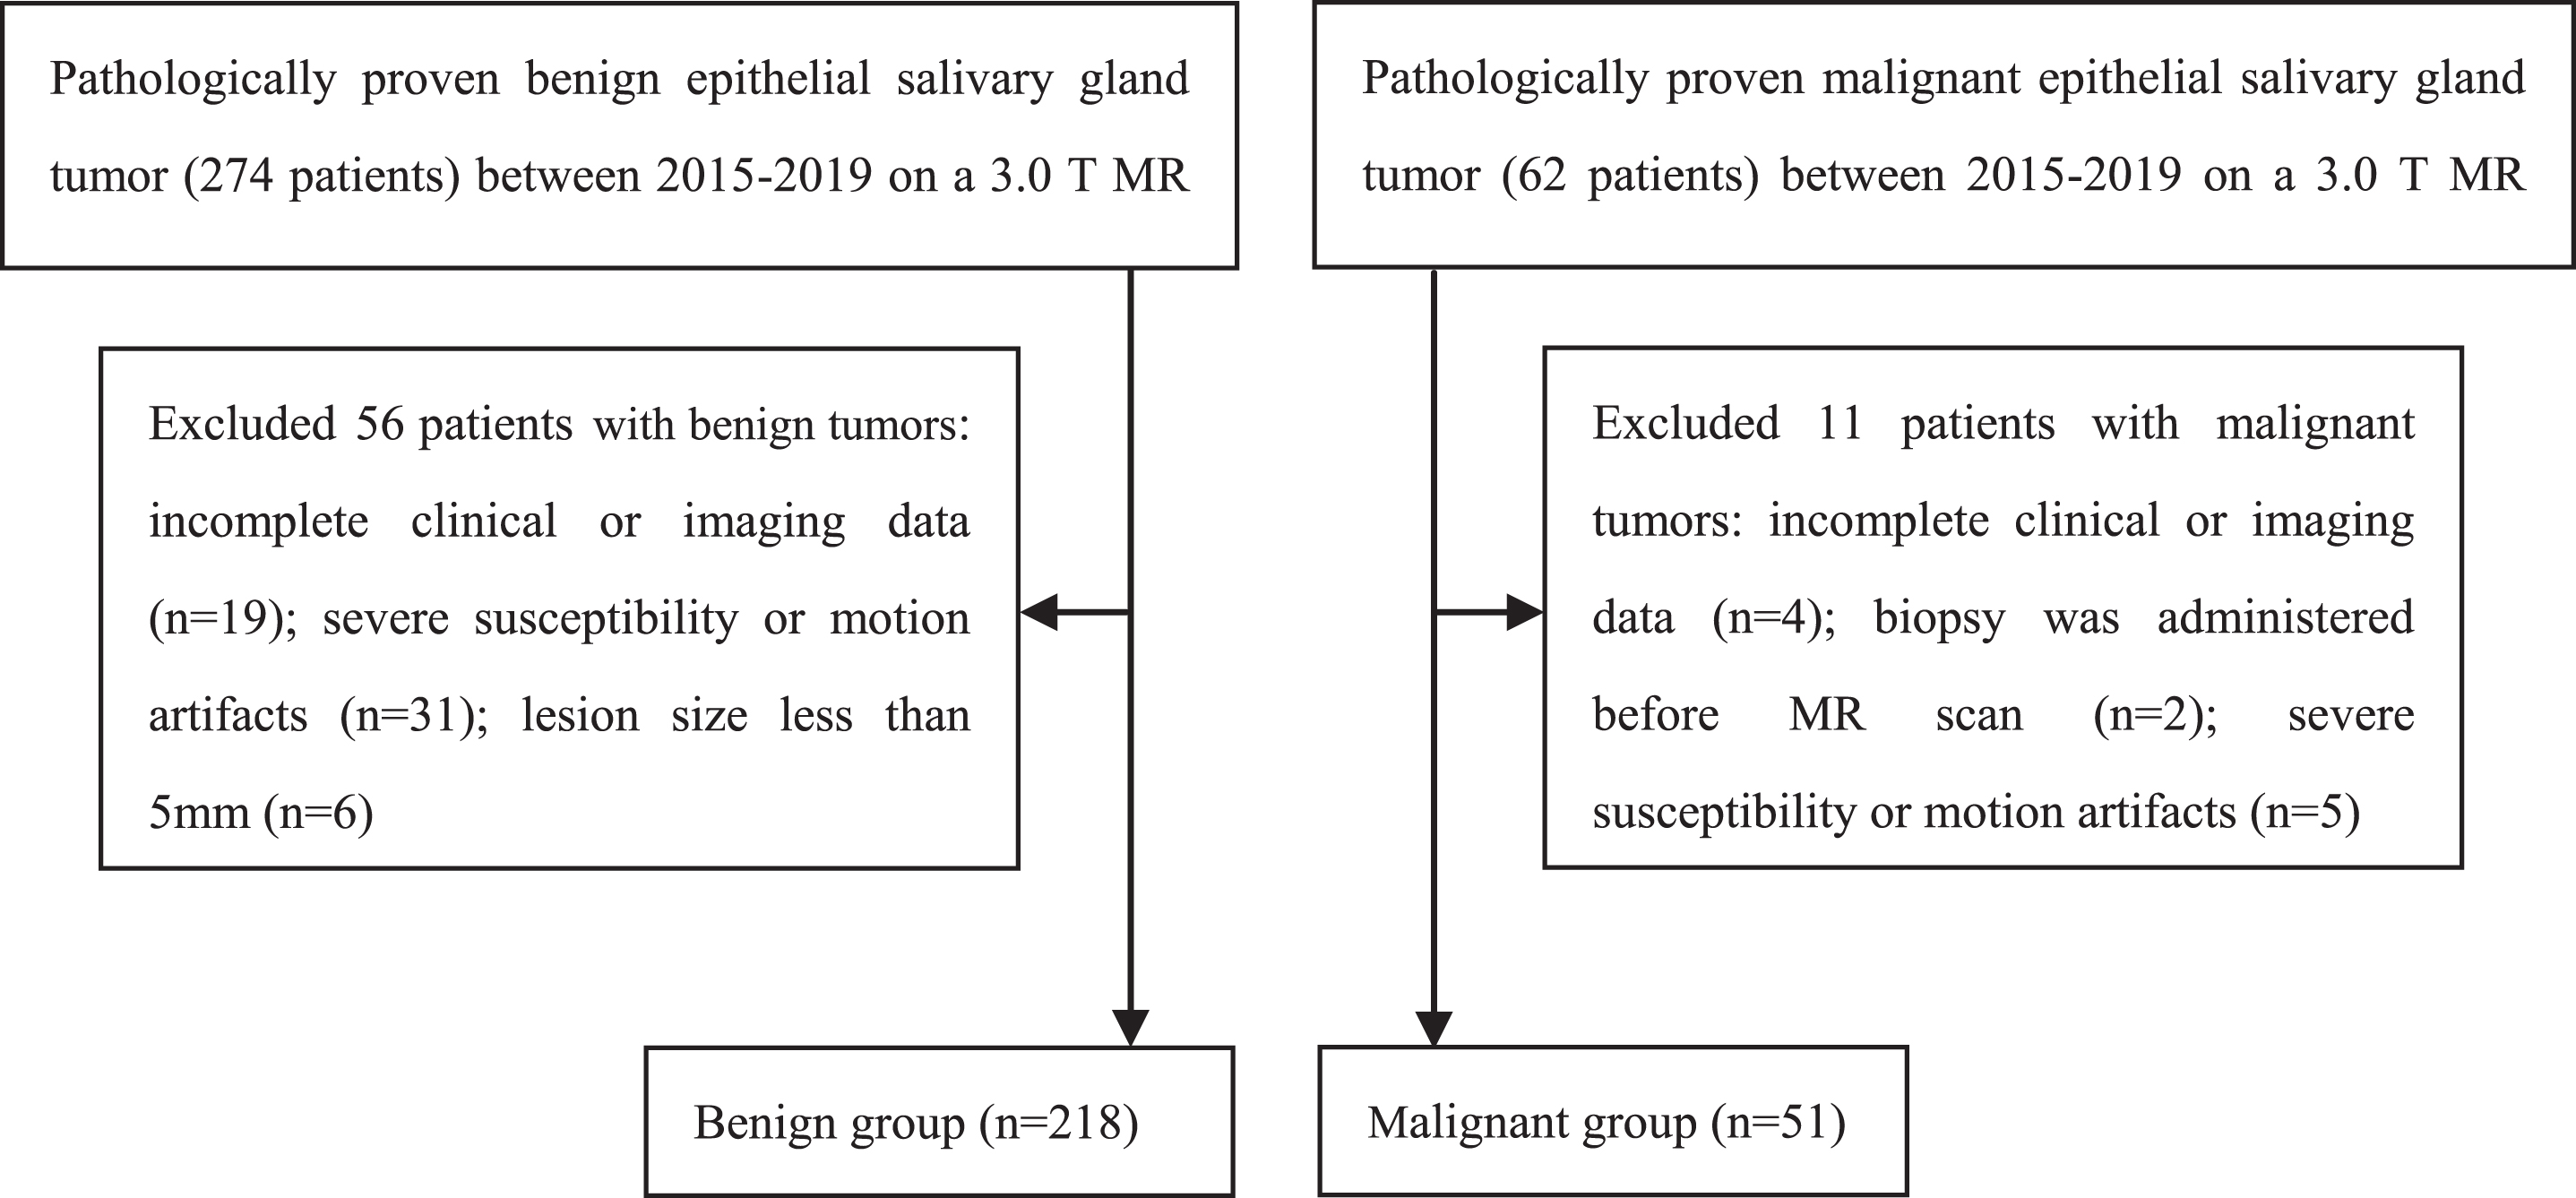
A flow diagram for the study population.
All DWI images were collected from the picture archiving and communication system of Jining No. 1 People’s Hospital. MRI examinations were performed using 3.0 T MR scanner (Siemens Trio, Germany) with a 12-channel head coil and 4-channel neck coil. The parameters of DWI sequence were as follows: b value, 0 and 1000 s/mm2 in three orthogonal directions; repetition time (TR), 4200 ms; echo time (TE), 94 ms; field of view, 24×24 cm; matrix, 192×173; slice thickness, 3 mm; spacing between slices, 0.3 mm; NEX 3; total acquisition time, 1 min 42 s.
ITK-SNAP software (www.itk-snap.org) was used for 3D volume of interest (VOI) segmentation. Two radiologists with 13 and 10 years of experience in head and neck radiology, who were blinded to the pathological results, drew manually all the regions of interest on each slice of the tumor on high b value DW images, including cystic, necrotic, and hemorrhagic regions with reference to T1-weighted and T2-weighted images. The inter- and intraobserver reproducibility of VOI delineation was determined using intra- and interclass correlation coefficients (ICCs), respectively. We initially chose 40 random images for VOI segmentation by the two radiologists independently. To assess intra-observer reproducibility, observer 1 repeated the same manual procedure after one week. ICC greater than 0.75 was regarded as being in good agreement [21]. And the work of observer 1 was used for further analysis. The manual segmentations of benign and malignant tumors were showed in Fig. 2.
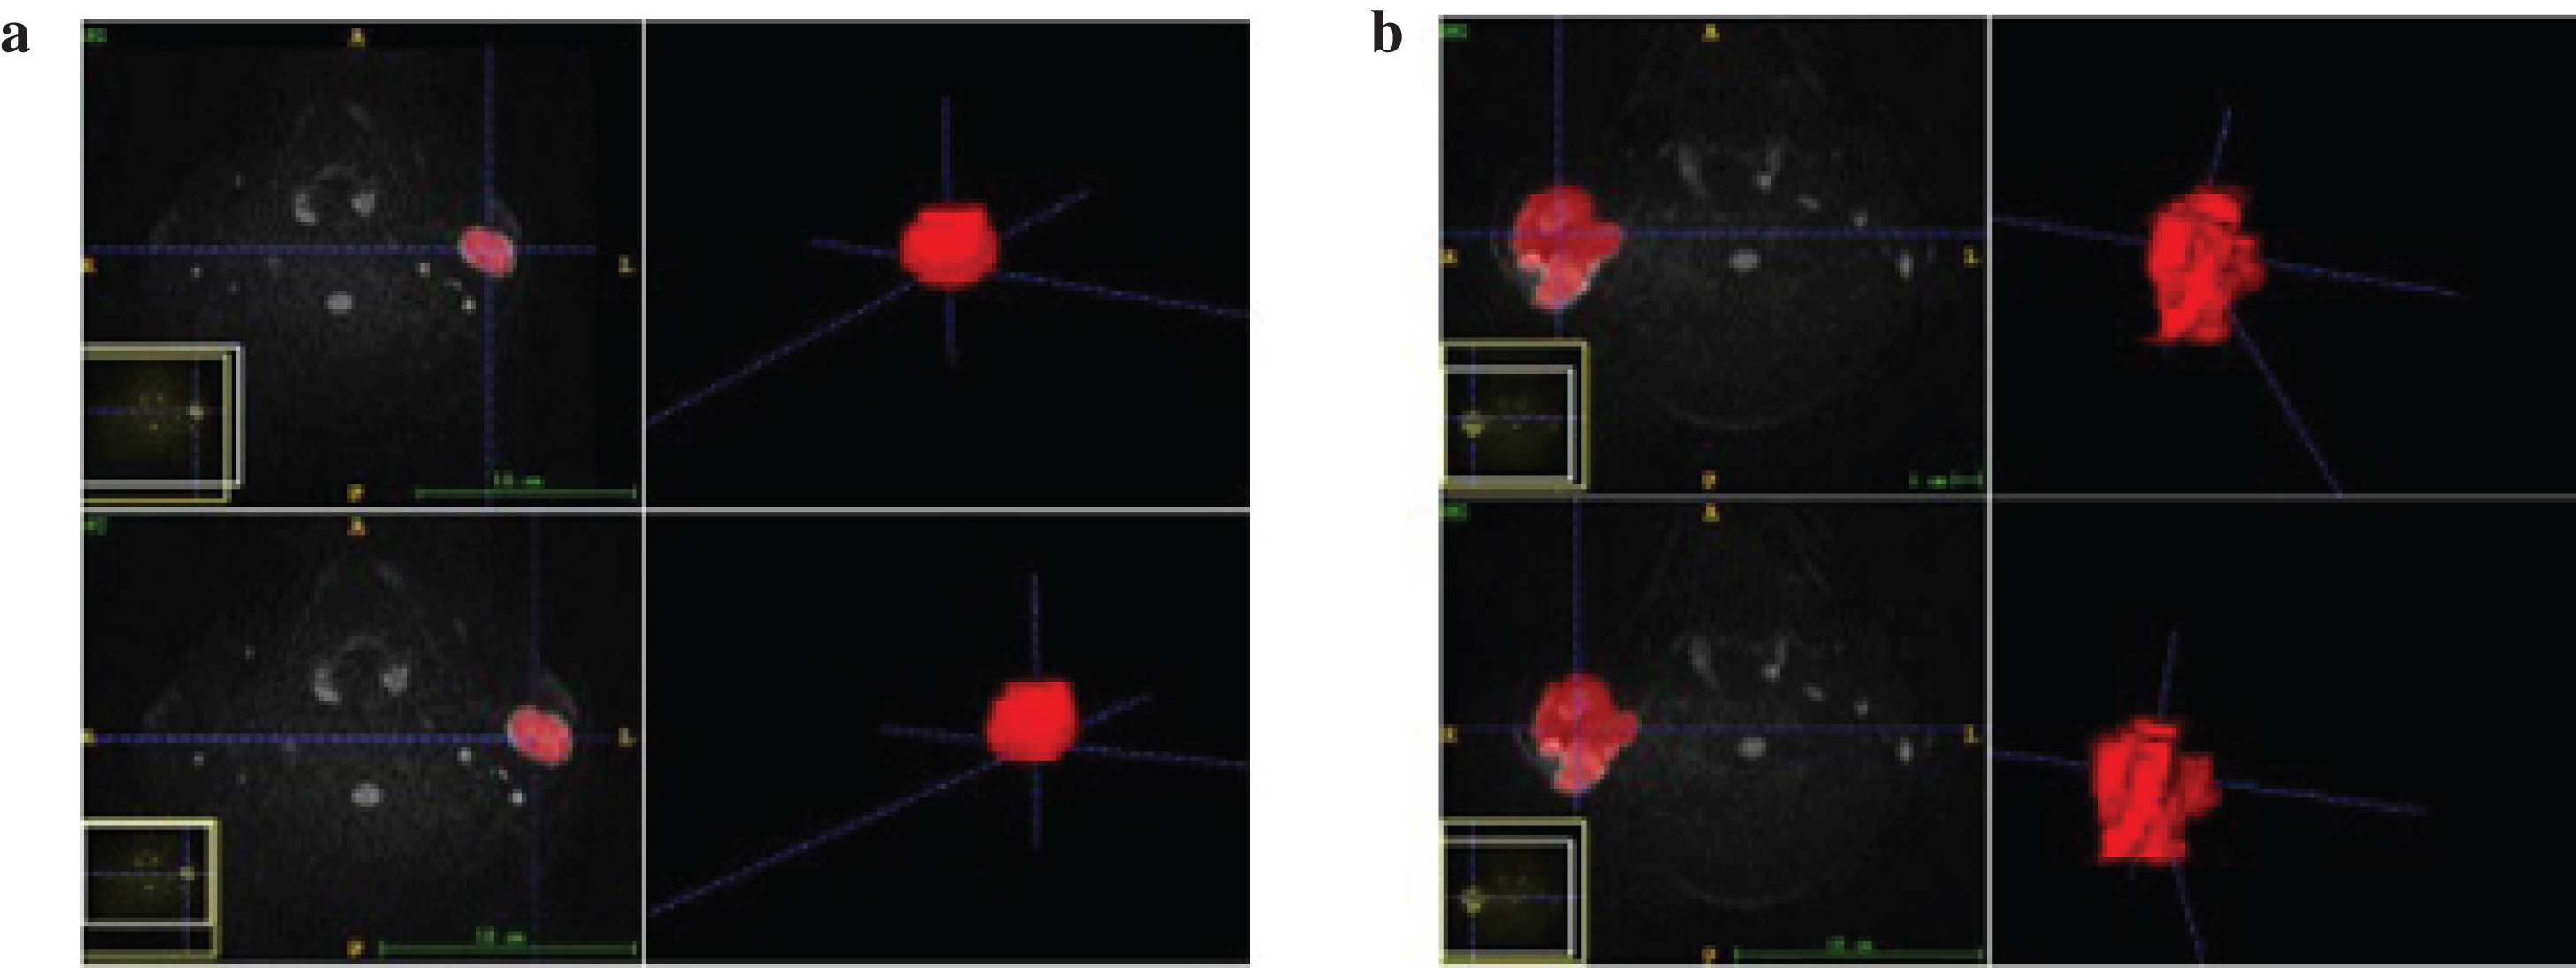
Schematic diagram of the manual segmentation for benign and malignant tumors. (a) Benign tumor boundary contours were segmented by two radiologists. (b) Malignant tumor boundary contours were segmented by two radiologists.
A total of 396 quantitative radiomic features were calculated from each patient based on A.K. software (Artificial Intelligence Kit; GE Healthcare, Shanghai, China). The radiomic features were divided into six groups: 42 histogram, 9 form factor, 10 Haralick, 11 gray-level size zone matrix (GLSZM), 144 gray-level co-occurrence matrix (GLCM) with an offset of 1/4/7, and 180 run length matrix (RLM) with an offset of 1/4/7. ICC analysis was conducted in radiomic features to assess the stability and reproducibility of each feature. Stable features were defined by ICC greater than 0.75.
Feature selection, model building, and statistical computations were performed using Python (https://www.python.org/) in Anaconda 3 platform (https://www.anaconda.com) with Scikit-learn package (https://scikit-learn.org). Analysis of variance (ANOVA) and least absolute shrinkage and selection operator (LASSO) regression were used to explore significant features to reduce redundant features and avoid over-fitting on the training data set. LASSO regression is a commonly applied and efficient method for analysis of high-dimensional data and is appropriate for a relatively small sample size [22–25]. In the LASSO process, we used fivefold validation to determine the best parameters with 3000 iterations.
Three supervised machine learning algorithms, namely, logistic regression (LR), support vector machine (SVM), and K-nearest neighbor (KNN), were used. To verify the reliability of the diagnostic model, we applied five-fold cross-validation for machine learning classifiers on the training data set. The diagnostic performance of the radiomics model was quantified by the receiver operating characteristic (ROC) curve and the area under the ROC curve (AUC) in the training and validation data sets.
Clinical characteristics were compared using Mann-Whitney U test for continuous variables and Chi-square or Fisher’s exact test for categorical variables. These statistical analyses were performed using SPSS 22.0 (IBM Corp., USA). A test with P < 0.05 was considered statistically significant.
Results
Clinical characteristics
A total of 269 patients with epithelial salivary tumors were included in this study. Benign tumors included one hundred and three pleomorphic adenomas, seventy Warthin tumors, forty-one base cell adenomas, three oncocytic adenomas, and one myoepithelioma. Malignant tumors included sixteen mucoepidermoid carcinomas, ten acinic cell carcinomas, eight adenoid cystic carcinomas, five base cell adenocarcinomas, three carcinomas in pleomorphic adenomas, one ductal carcinoma, two myoepithelial carcinomas, two squamous cell carcinomas, two adenocarcinomas, one sebaceous gland carcinoma, and one secretory carcinoma. Gender distribution, shape, margin, size and location of tumor significantly differed between benign and malignant groups. However, the difference in age distribution was not statistically significant. The clinical features are listed in Table 2.
Clinical characteristics of salivary gland tumors
Clinical characteristics of salivary gland tumors
Unless otherwise specified, data are the numbers of patients. *Data are Mean±SD.
ICCs among intraobservers ranged from 0.882 to 0.970, and ICCs among interobservers ranged from 0.829 to 0.947, indicating good agreement for radiomic features. Based on ANOVA, 89 significant features were screened with p value <0.05. The 8 most valuable features selected through LASSO regression were as follows (Fig. 3): SurfaceArea, VoxelValueSum, Maximum3DDiameter, LongRunHighGreyLevelEmphasis_angle45_offset7, RunLengthNonuniformity_angle0_offset4, Compactness2, SizeZoneVariability, LongRunHighGreyLevelEmphasis_angle90_offset1.
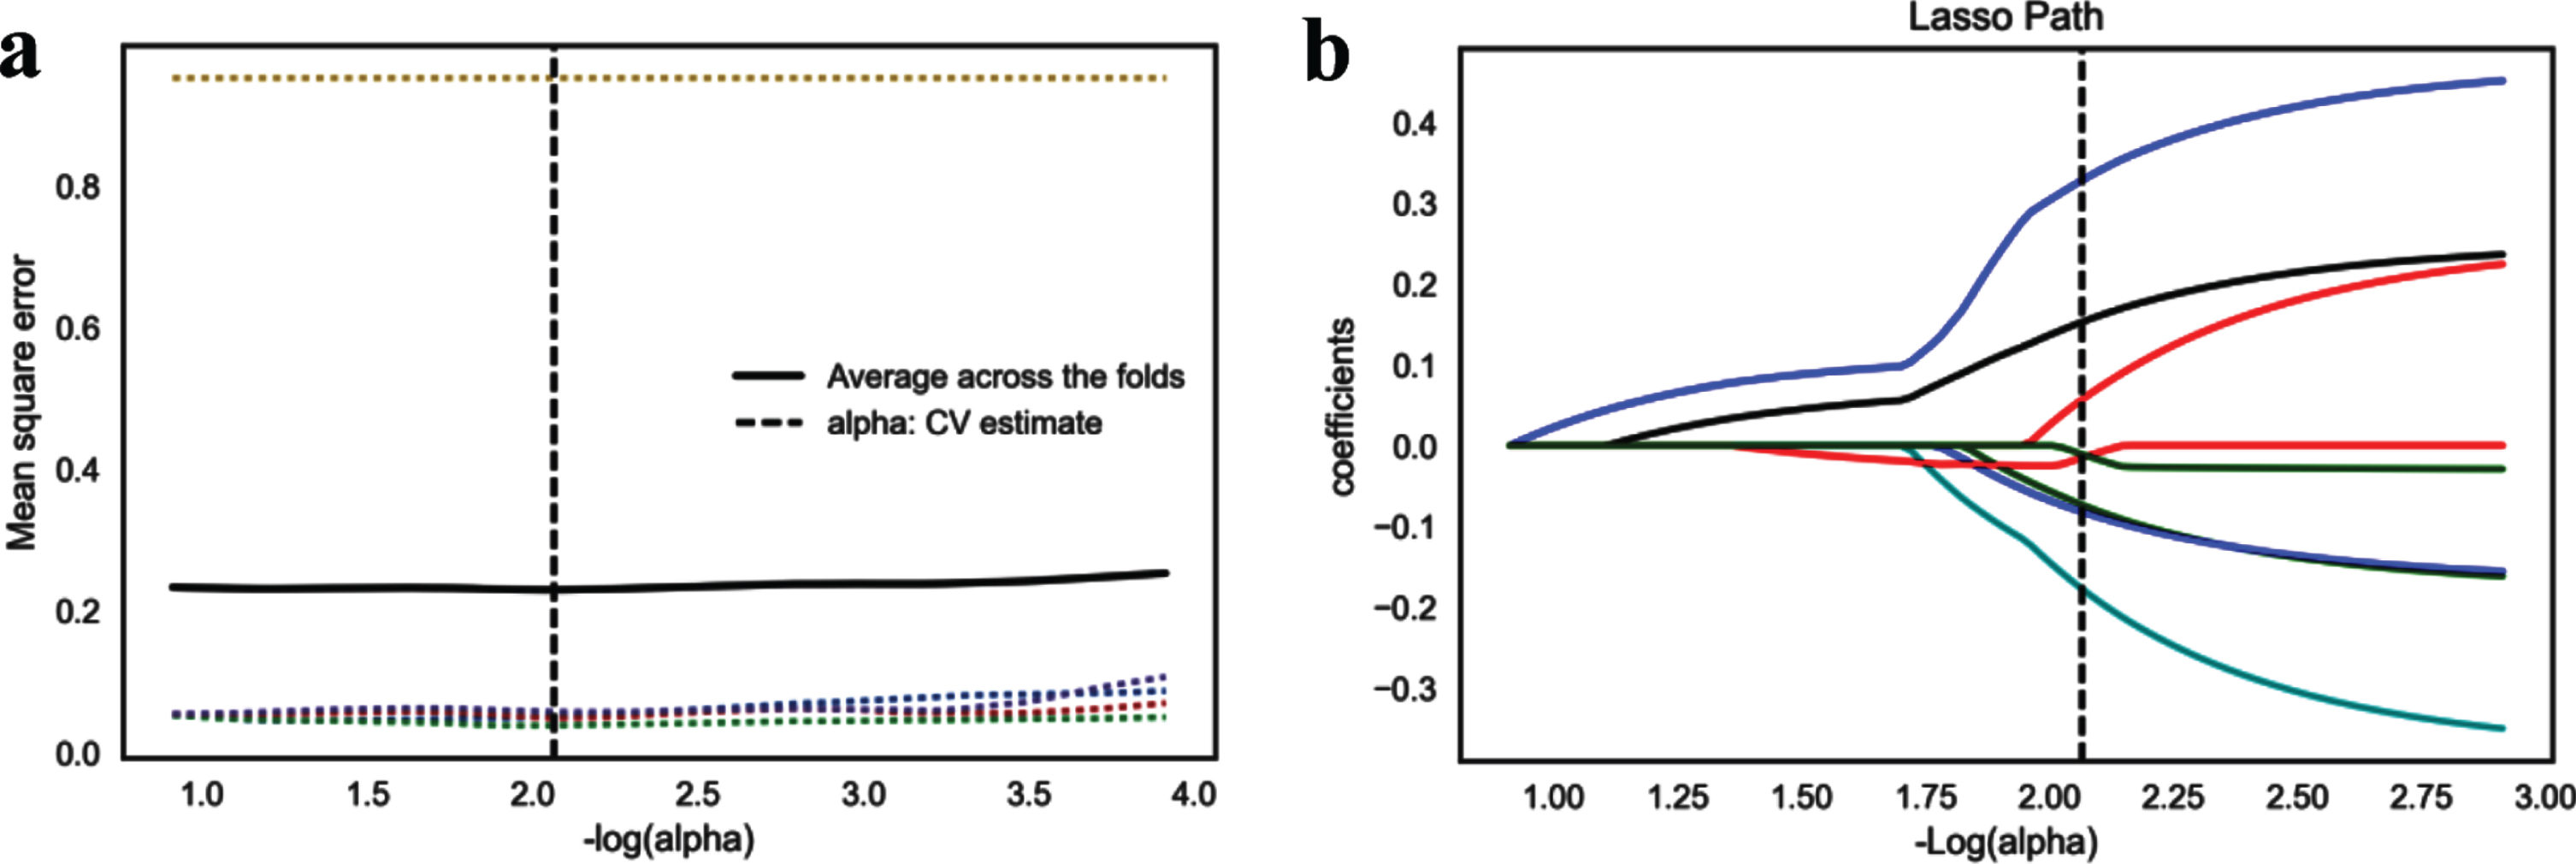
Selection of radiomics features of DWI based on LASSO. (a) Mean square error path diagram. The abscissa is log (alpha), and the dashed lines of 5 different colors indicate that via five-fold cross validation, different features correspond to alphas with different mean square errors. (b) LASSO path map. 8 color solid lines represent 8 texture parameters, and different texture parameters correspond to different lasso coefficients with the change of alphas.
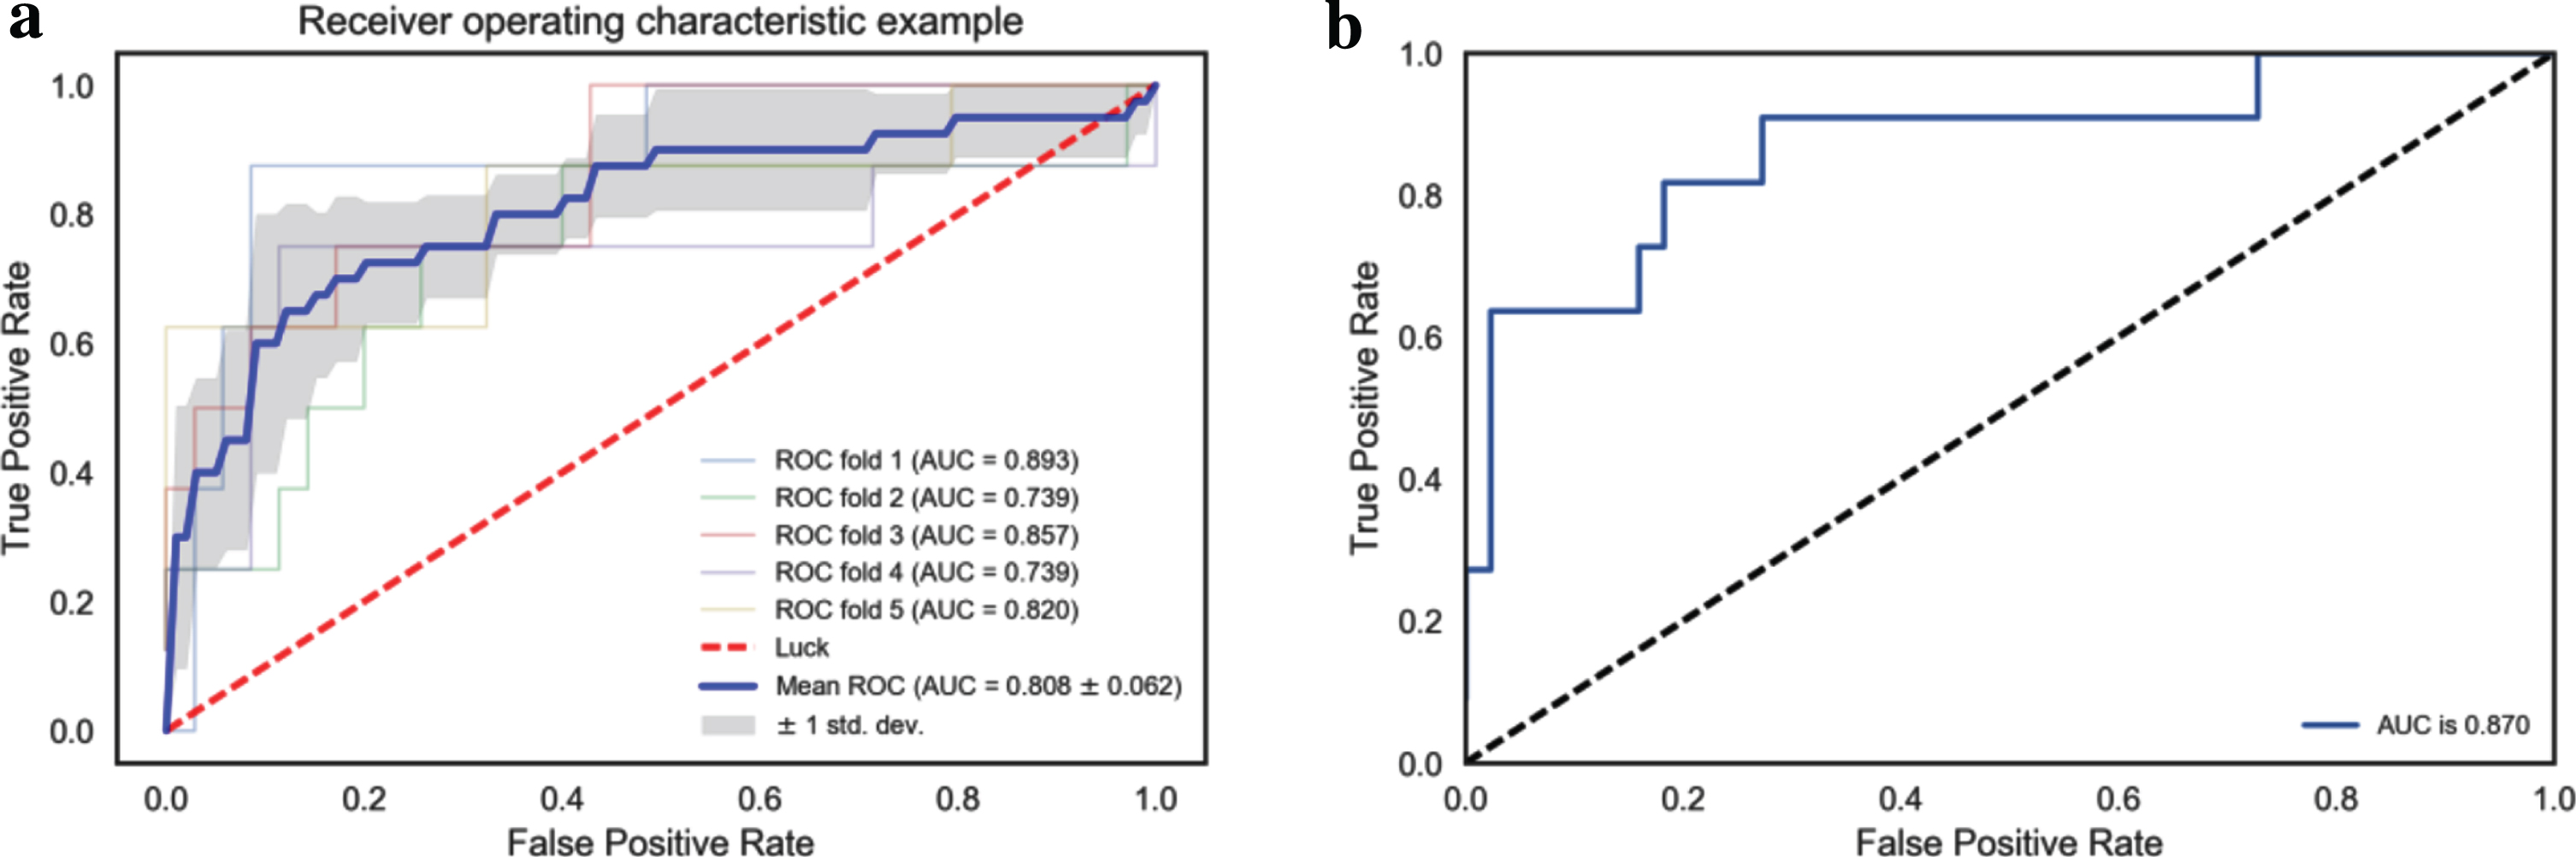
Three modeling algorithms were tested. LR and SVM exhibited good diagnostic ability. In the training data set, LR and SVM yielded optimal AUC values of 0.886 and 0.893, respectively. However, KNN showed relatively lower AUC (0.796) than LR and SVM. In the testing data set, a similar result was found, that is, the AUC value for LR was 0.876, followed by SVM at 0.870 and KNN at 0.791. The ROC curves of LR and SVM algorithms are shown in Figs. 4 and 5, respectively. The accuracy, precision, recall and F1score of LR and SVM model on the training and testing data set in Table 3. LR and SVM algorithms presented better lesion classification performance.
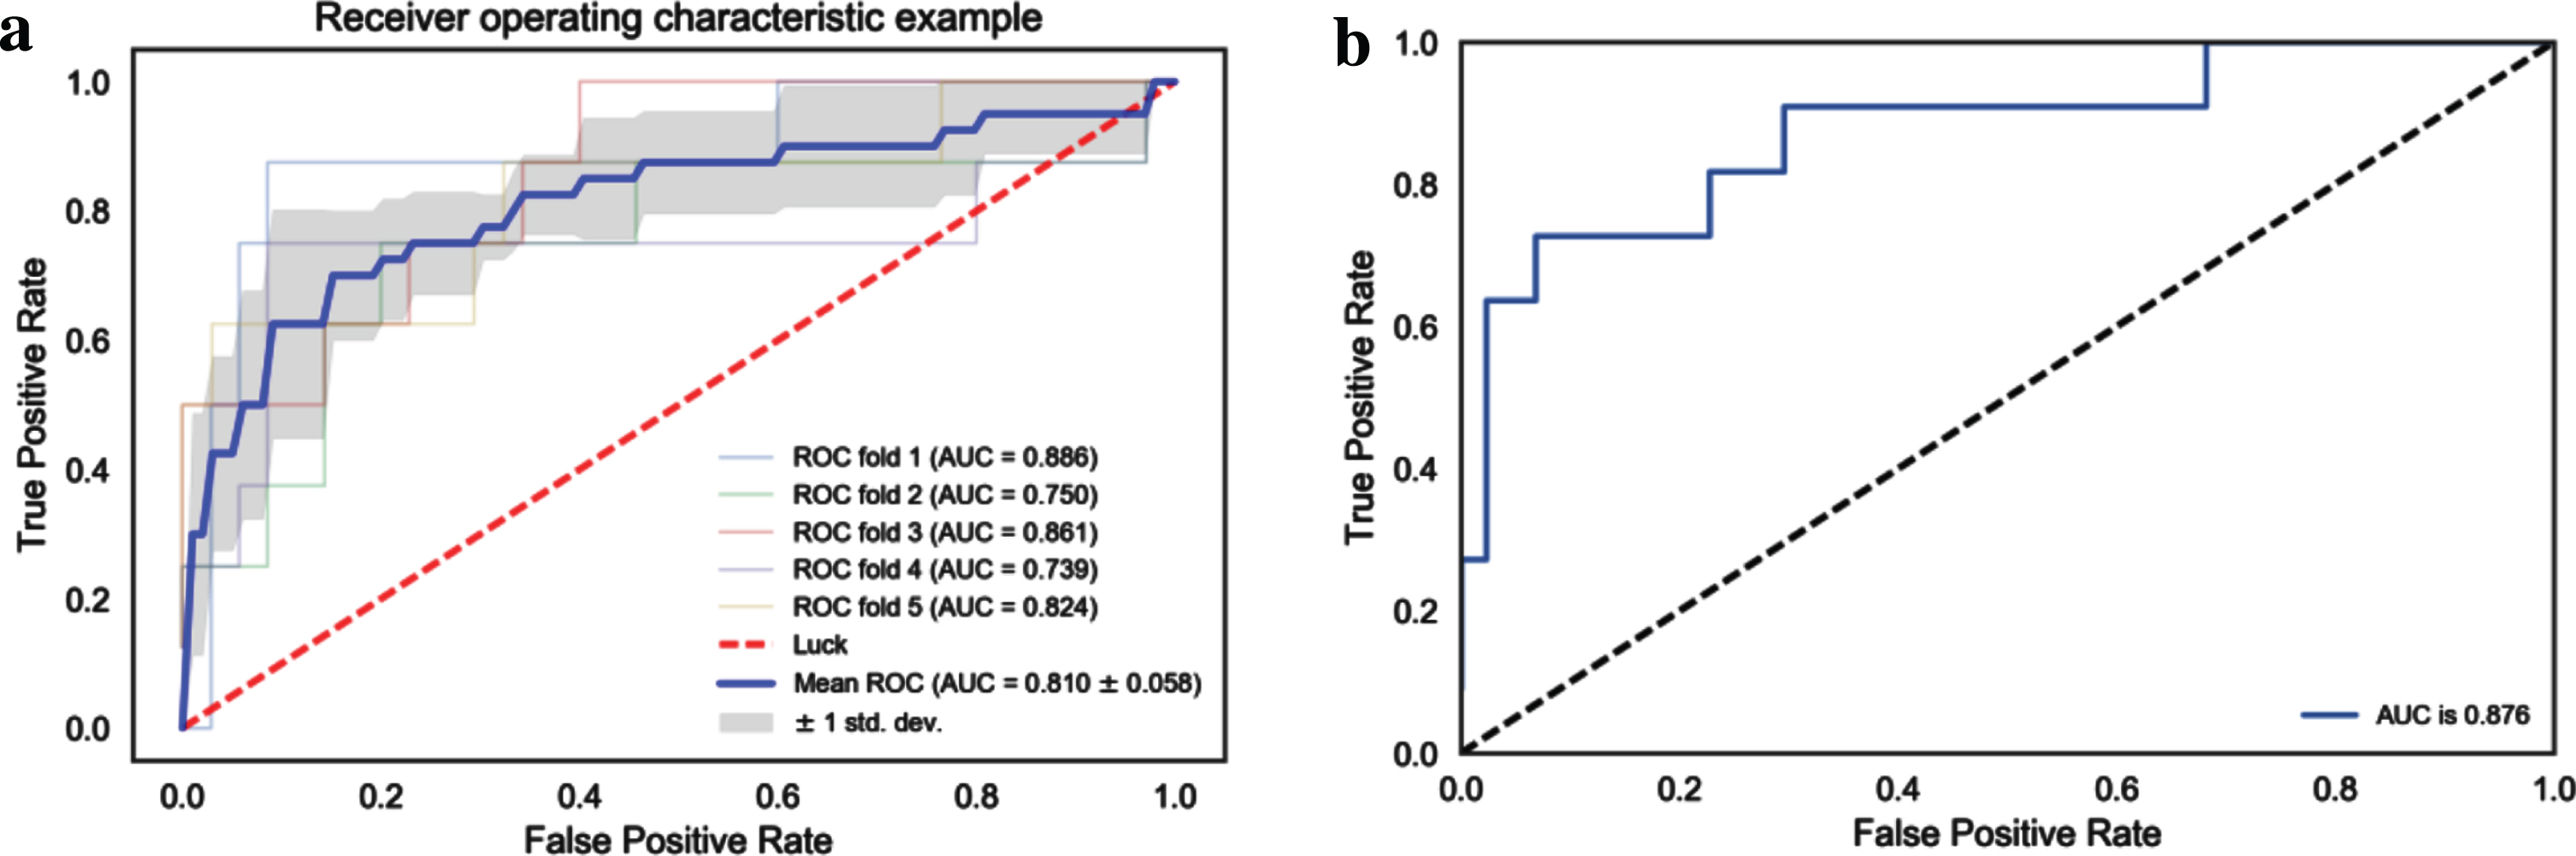
Receiver operating characteristic curve for LR algorithm. (a) Fivefold cross-validation of LR classifier in the training set. (b) ROC curve of the LR classifier in the testing set.
Receiver operating characteristic curve for SVM algorithm. (a) Fivefold cross-validation of SVM classifier in the training set. (b) ROC curve of SVM classifier in the testing set.
Performance evaluation of LR and SVM model on the training and testing dataset
Epithelial salivary gland tumors contain a large variety of benign and malignant subtypes. In this study, we developed and validated radiomics analysis based on DW images as a novel approach to differentiate benign and malignant epithelial salivary gland tumors. Three modeling algorithms, namely, LR, SVM, and KNN, were used. LR (AUC, 0.886; AUC, 0.876) and SVM (AUC, 0.893; AUC, 0.870) models exhibited better diagnostic ability than KNN (AUC, 0.796; AUC, 0.791) in distinguishing between benignity and malignancy of tumors in the training and validation data sets respectively. The classification performances of LR and SVM model were both good with accuracy (0.83–0.85), precision (0.86–0.86), recall (0.78–0.84), and F1-score (0.80–0.85).
In clinical practice, several observable conventional MRI features, such as shape, margin, and signal intensity, are used in the assistant diagnosis of salivary gland tumors. A previous research [6] suggested that benign tumors displayed mostly round or oval shape, homogeneous mass with well-defined margin, whereas malignant tumors showed irregular, ill-defined margin, heterogeneity, and infiltration into adjacent structures; these findings are consistent with the present results. However, Freling, et al. [7] reported that approximately 50% of malignant parotid tumors showed clear boundaries, and only 29% of all tumors with heterogeneity on T2-weighed images were malignant. Thus, these morphological parameters are nonspecific and controversial to be solely used in differentiating between low-grade malignant and benign diseases. The mean ADC values of benign salivary gland tumors were significantly higher than those of malignant tumors, considering rich cellular density in malignant lesions [10, 12]. However, in another study benign and malignant tumors had no significant difference in ADC values possibly because of the considerable overlap within benign and malignant tumor subtypes [13]. The diagnostic value of DWI-ADC mapping in the characterization of salivary gland tumors might not be sufficient.
Radiomics analysis is an effective tool for extracting high-dimension quantitative features to describe the attributes of tumors, which can be divided into first-, second-, or higher-order statistical outputs [14, 27]. In this rapidly evolving field of investigations, MRI provides a large number of features suitable for diagnosis and prognosis of head and neck cancer [15]. Ma et al. found that first-order parameters based on ADC histogram showed no significant differences between malignant and benign parotid gland tumors, despite significant differences in ADC histograms within the subgroup analyses [16]. Fruehwald-Pallamar et al. [17] demonstrated that texture analysis based on unenhanced and contrast-enhanced T1-weighted images can differentiate benign from malignant parotid gland lesions as well as pleomorphic adenomas from Warthin tumors; these texture features included gray-level histogram, co-occurrence matrix, run-length matrix, absolute gradient, autoregressive model, and wavelet transform.
Radiomics is usually based on which images to choose. Magnetic resonance imaging sequences are varied, of which the most common sequences include T1-weighted, T2-weighted, DWI, and contrast-enhanced T1-weighted scans. Although combining multiple sequences can provide additional information, selection of fewer but more specific images may be more effective. Prior feasibility studies have proved that radiomic features from a single MRI sequence can obtain good diagnostic and prognostic values [20, 29]. DWI allows noninvasive evaluation of physiological and pathological information of tissues in vivo in a mature and easy way. Using DW images, we selected 8 optimal features by fivefold cross-validation LASSO regression. LASSO has two functions, namely, shrinkage and selection, for constructing a penalty function to obtain a more refined model; this model shrinks certain coefficients and reduces some regression coefficients to zero to eliminate variables during model fitting [30]. Many studies have proved that LASSO is a recognized and accurate method for feature selection and is applicable for analyzing large sets of radiomics features with a relatively small sample size [24, 25].
Over the past decade, a large number of machine-learning classifier models have been introduced. The application of appropriate machine-learning algorithm can improve the stability and prediction performance of the model. In the current work, LR and SVM algorithms could be successfully applied to construct a diagnostic model and presented better lesion classification performance. Furthermore, the performances of LR and SVM algorithm were comparable. Previous studies reported the advantage of SVM and LR algorithms in building optimal diagnostic/predictive classifiers for other clinical applications [31–33]. Accordingly, LR and SVM algorithms are applicable for computing small data sets and dichotomous variables. We simultaneously applied fivefold cross-validation to verify the reliability of these classifier models on the training data set, which is more suitable for small-sample model construction [34].
Segmentation is the most challenging and controversial method for radiomics model. Our VOI manual segmentation was based on recent feasibility study [18]. We intentionally included cystic, necrotic, and hemorrhagic regions of the tumor in addition to solid tumor components during VOI placement. Areas of tumour heterogeneity including cystic, necrotic, and hemorrhagic regions could potentially contribute to tumour classification and discrimination [35].
Our study has certain limitations. First, the study had small sample size and a single-center design. Further multicentric studies with larger study populations are needed to confirm our findings. Second, we only applied ANOVA and LASSO for feature selection and three classifier models in our study. The results of other machine-learning methods are unknown. Third, multiparametric approaches may reduce the risk of bias in extracting features from only one sequence. Multiparametric MRI-based radiomics models including DWI, ADC, T2WI, etc should be further investigated. Finally, we did not incorporate additional morphological characteristics of routine MRI, clinical and genetic features in the model. As such, further studies are still needed.
In summary, our results demonstrated that DW images can be quantified with radiomics for differentiation of benign and malignant epithelial salivary gland tumors. LASSO_LR and LASSO_SVM classifiers were preferred, and stable machine-learning methods and exhibited satisfactory performance. In future studies, prospectively capturing high-quality images and other data should reduce data attrition and improve process efficiency.
Footnotes
Acknowledgments
This work was supported by the Natural Foundation of Shandong Province, China (No. ZR2016HL40, ZR2017PH043).