






Abstract
BACKGROUND:
In view of the underlying health risks posed by X-ray radiation, the main goal of the present research is to achieve high-quality CT images at the same time as reducing x-ray radiation. In recent years, convolutional neural network (CNN) has shown excellent performance in removing low-dose CT noise. However, previous work mainly focused on deepening and feature extraction work on CNN without considering fusion of features from frequency domain and image domain.
OBJECTIVE:
To address this issue, we propose to develop and test a new LDCT image denoising method based on a dual-domain fusion deep convolutional neural network (DFCNN).
METHODS:
This method deals with two domains, namely, the DCT domain and the image domain. In the DCT domain, we design a new residual CBAM network to enhance the internal and external relations of different channels while reducing noise to promote richer image structure information. For the image domain, we propose a top-down multi-scale codec network as a denoising network to obtain more acceptable edges and textures while obtaining multi-scale information. Then, the feature images of the two domains are fused by a combination network.
RESULTS:
The proposed method was validated on the Mayo dataset and the Piglet dataset. The denoising algorithm is optimal in both subjective and objective evaluation indexes as compared to other state-of-the-art methods reported in previous studies.
CONCLUSIONS:
The study results demonstrate that by applying the new fusion model denoising, denoising results in both image domain and DCT domain are better than other models developed using features extracted in the single image domain.
Introduction
Computer tomography (CT) technology has become an essential aid in disease diagnosis, detection of lesions and routine detection [1]. However, although there is evidence that CT scans can be used for diagnosis and patient management, there is still the potential risk of radiation-induced malignant tumours [2]. Therefore, scholars have proposed low-dose CT (LDCT) imaging [3], the technology can be achieved using only a small amount of radiation that could satisfy the requirement of different diagnostic CT images. However, compared to normal dose CT (NDCT), due to the lower current or voltage of the tube to reduce radiation, LDCT images usually have a large number of electronic noise and streak artifacts pollution [4]. Using the scanning doses as low as possible to obtain similar NDCT image quality to CT images is a challenge.
Researchers have proposed a series of methods to improve CT image quality. These denoising methods are implemented in different stages, including projection domain processing before reconstruction [5–8], iterative reconstruction in reconstruction [9–14], and post-processing of reconstructed images [15, 16]. The first two methods require the original projection domain data, and it is difficult to obtain the original projection data from the medical image manufacturer in the actual research, which increases the difficulty of such methods. Compared to the other two algorithms, image post-processing directly deals with noisy images and can be easily integrated into existing clinical protocols. Therefore, many researchers have proposed many excellent post-processing algorithms to solve these problems. In the field of low-dose CT denoising, traditional image processing algorithms include the improved BM3D method [17–20], the non-local means method [21, 22], the partial differential equation (PDE) method [23–25], dictionary learning [16], wavelet transform [26], etc. Although these algorithms can reduce noise to varying degrees, they will lead to the loss of key local details and residual errors in LDCT images after denoising.
With the continuous development of deep learning technology, some excellent image post-processing methods are used for LDCT image processing. Compared to traditional denoising algorithms, which rely on prior knowledge and are only effective for specific types of noise, deep learning methods have better portability. Chen et al. [27] proposed a neural network with an encoder-decoder structure (REDCNN) for LDCT images, the neural network in the aspect of noise suppression, the structure and the detection of lesion obtained very good evaluation. Fan et al. [28] proposed a quadratic auto-encoder (Q-AE) network using quadratic neurons and an auto-encoder structure, which effectively improved the denoising effect of LDCT images. Kang et al. [29] designed a deeper neural network, which combines traditional wavelet transformation with deep learning. The direction vector of the artifact is extracted by the direction wavelet transform, and the wavelet transform coefficient of the LDCT image is obtained, which effectively suppresses the noise in the CT image. However, the ability to control edge detail and describe noise is still a problem to be solved. Liang et al. [30] proposed an edge-based densely connected convolutional neural network (EDCNN) and designed an edge enhancement module using the proposed new trainable Sobel convolution. Based on this module, a densely connected model is constructed to fuse the extracted edge information to achieve end-to-end image denoising. Jiang et al. [31] found the influence of noise on the low-frequency and high-frequency LDCT images and proposed a frequency separation network (FSNet) for LDCT image denoising.
The emergence of the Generative Adversarial Network (GAN) has also brought new feasible solutions to low-dose CT image processing. JM et al. [32] applied a simple convolutional neural network to a generative adversarial network to denoise low-dose CT images. The experimental results showed that the overall noise of the image was effectively suppressed. Yang et al. [33] added the Wasserstein distance to the generative adversarial network, and introduced the perceptual loss function to better preserve the feature information in the CT image. Geng et al. [34] applied the content-noise complementary learning strategy (CNCL) and combined it with the adversarial generative network to propose a new deep learning structure. The network has strong generalization ability and has good performance in CT, MR and PET images. Han et al. [35] proposed a GAN with a double-sided single decoding structure and designed a pyramid module of non-local attention on the main encoder, which effectively improved the quality of the generated image. Marcos et al. [36] proposed a GAN composed of a spatial attention module and a channel attention module. The enhanced attention module is used to preserve the structural details of LDCT images. Although the performance of these new networks has been greatly improved, existing CNN methods are mostly executed in the image domain and lack the constraint in the frequency domain. The restored image still has the problems of blurred appearance and lack of texture details. Lyu et al. [37] proposed a dual-domain network U-DuDoNet, which uses U-Net to add artifacts in the sinogram and image domains to directly model the artifact generation process to remove CT image noise. Wang et al. [38] proposed a pure transformer CTformer for low-dose CT denoising. This work is a pioneer in applying visual transformer to LDCT denoising problems and introduces expansion and cyclic displacement to capture longer-range interactions. Yin et al. [39] proposed a region-progressive three-dimensional residual convolution network DP-ResNet, which designs networks in the sinusoidal domain, filtered back projection domain and image domain to achieve denoising. However, these methods to forecast using a single scale do not deal well with multi-scale change problem, and these networks only use MSE or L1 norm as loss, which is not conducive to the preservation and restoration of texture details.
Inspired by the above work, in this work, we developed a low-dose CT denoising framework based on dual-domain fusion deep convolutional neural network to eliminate noise artifacts of LDCT images in multiple complementary domains, especially in image domain and frequency domain. The noise in low-dose CT images belongs to high-frequency information, so it is of certain significance to process noisy images in DCT domain. Combining image domain with DCT domain can obtain better denoising results. The proposed network consists of three subnets: image domain network, DCT domain network and combination network. Firstly, the image domain adopts a top-down self-guided framework, which can effectively fuse multi-scale information, extract good local features, and restore clean LDCT images. Second, inspired by the recent observation of LDCT noise, the use of a discrete cosine transform (DCT) can remove noise from medical images in the frequency domain. Finally, the output of the image domain network and the output of the DCT domain network are fused into the denoised LDCT image through the combination network. To overcome the above drawbacks caused by MSE or L1 norm, we construct a new loss function with the help of L1 loss, charbonnier loss and edge loss. The proposed method has achieved good noise reduction results on the 2016 NIH AAPM Mayo Clinic LDCT dataset and the Piglet dataset. The main contributions of this paper are as follows. We proposed a dual-domain fusion deep convolutional neural network framework for low-dose CT denoising. The network framework consists of three phases: image domain network, DCT domain network and combination network. The image domain adopts a top-down self-guided framework, which can effectively fuse multi-scale information, extract good local features and restore clean LDCT images. In the DCT domain, we design a new convolution block attention module (CBAM) residual network to enhance the internal and external relations of different channels while reducing noise, to promote richer image structure information. We further combine the composite loss function designed by LI loss, charbonnier loss and edge loss to train DFCNN to further prevent the image from being smooth in the past and losing the corresponding detail information. The experimental results show that our proposed DFCNN has good noise suppression and edge detail protection ability. The contrast experiment and the ablation experiment show that the improved design of each module of our network is of positive significance.
Related work
CT image noise model
The low-dose CT image denoising model can be summarized as follows: Assuming that X is an LDCT image and Y is an NDCT image, the relationship between the low-dose CT image and the normal-dose CT image is as follows:
The recovery process from the LDCT image X to NDCT image Y can be considered a reflection projection of the equation. T represents the process of degrading the NDCT image Y into the LDCT image X that corresponds to the threshold in a non-linear way. The denoising process can be transformed into the function f:
where, f represents the best approximation function T-1 obtained by deep learning.
LDCT images contain large-scale information such as structural features, organs, and pathology of various parts of the human body. However, when training the network model, it is impossible to effectively extract accurate semantic information for some small textures. Therefore, to obtain multiscale semantic information from LDCT images, we applied the Convolutional Block Attention Module [40], as shown in Fig. 1(a), so that the designed network can pay more attention to the details of CT images. Attention is a technology that enables the network to better focus on the more important parts of the input data for prediction. CBAM can be seamlessly integrated into any CNN framework, with little overhead, and can be trained end-to-end with basic CNN networks. When combined with an existing CNN structure, it improves the performance of the entire task. Suppose that we have an intermediate feature F(H×W×C) as the output of the convolutional layer. Depending on the depth of the layer, each feature layer captures useful information, such as simple edges, shapes, etc., to obtain more complex input semantic representations. We hope that the network pays more attention to the important parts of these feature maps. To this end, the author proposes channel and spatial attention modules (two components of CBAM).
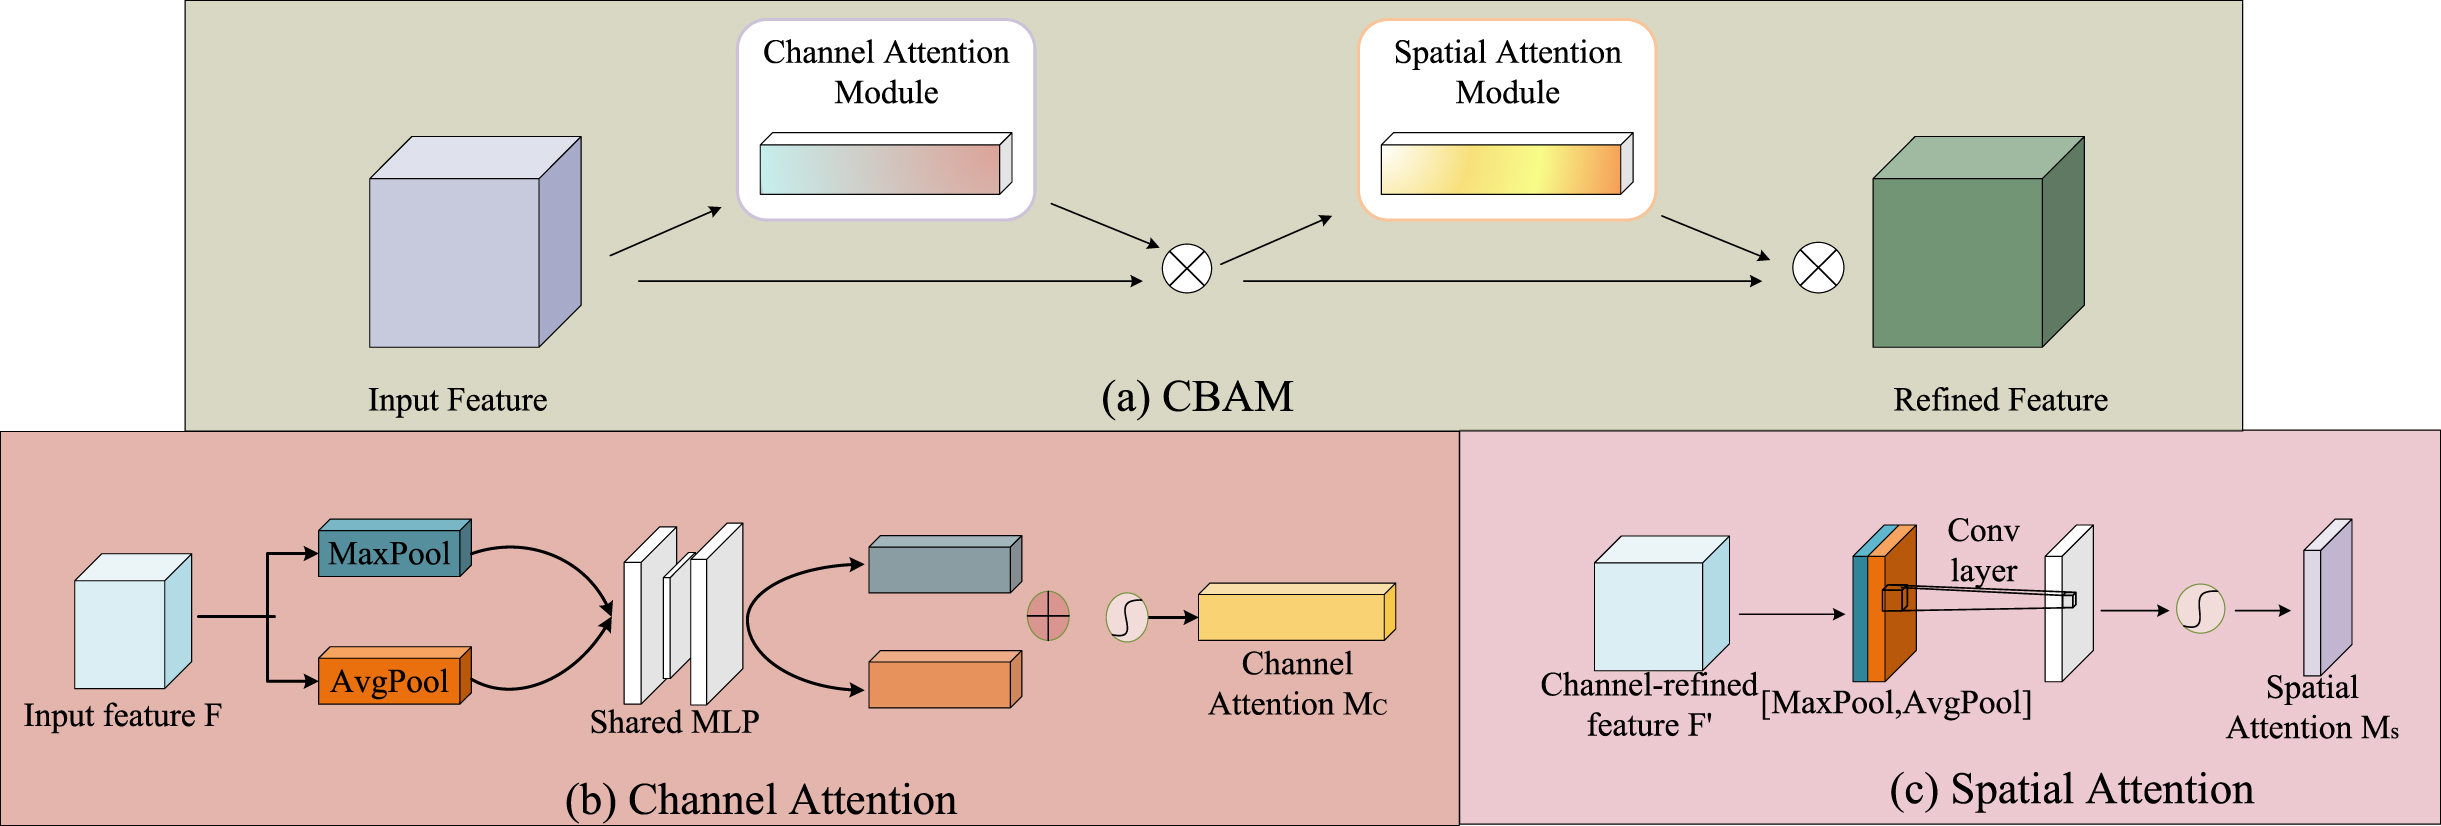
CBAM architecture (a) The block diagram of CBAM, (b) Channel Attention, (c) Spatial Attention.
The channel attention module identifies important parts of each channel in the feature map by using maximum-pooling and average-pooling operations. This generates two spatial context descriptors F _ c _ avg (C × 1 ×1) and F _ c _ max(C × 1 ×1). The descriptors are then fed into a two-layer perceptron network (MLP) to generate a single-channel attention map. The attention map M _ c (C × 1 ×1) is multiplied by the original feature element by element to generate an intermediate feature map with attention. These operations are shown in the following formula and in Fig. 1(b):
In this paper, an additional attention mechanism is added after the channel attention module, called the spatial attention module. As a supplement to the previous method, maximum-pooling and average-pooling operations are applied along the channel dimension to generate F _ s _ avg (1 × H × W) and F _ s _ max(1 × H × W). Both spatial maps are input into a single convolutional layer, which generates the final feature map M _ s (1 × H × W). The plot is then multiplied by the feature map we obtained after applying element by element channel attention. This spatial attention helps the network to better understand the ‘location’ of important information. These operations are shown in the following formula and Fig. 1(c):
The overall network structure
The DFCNN framework proposed for denoising the LDCT image is shown in Fig. 2. This network takes an LDCT image as output and reconstructs the denoised clean image. Specifically, the whole framework consists of three parts: image domain network, DCT domain network and combination network. First, we estimate the image domain and the DCT domain network to generate a single structure. The combination network then uses these results to generate clean CT images by applying the learning to designs such as convolution. DFCNN can be expressed as:
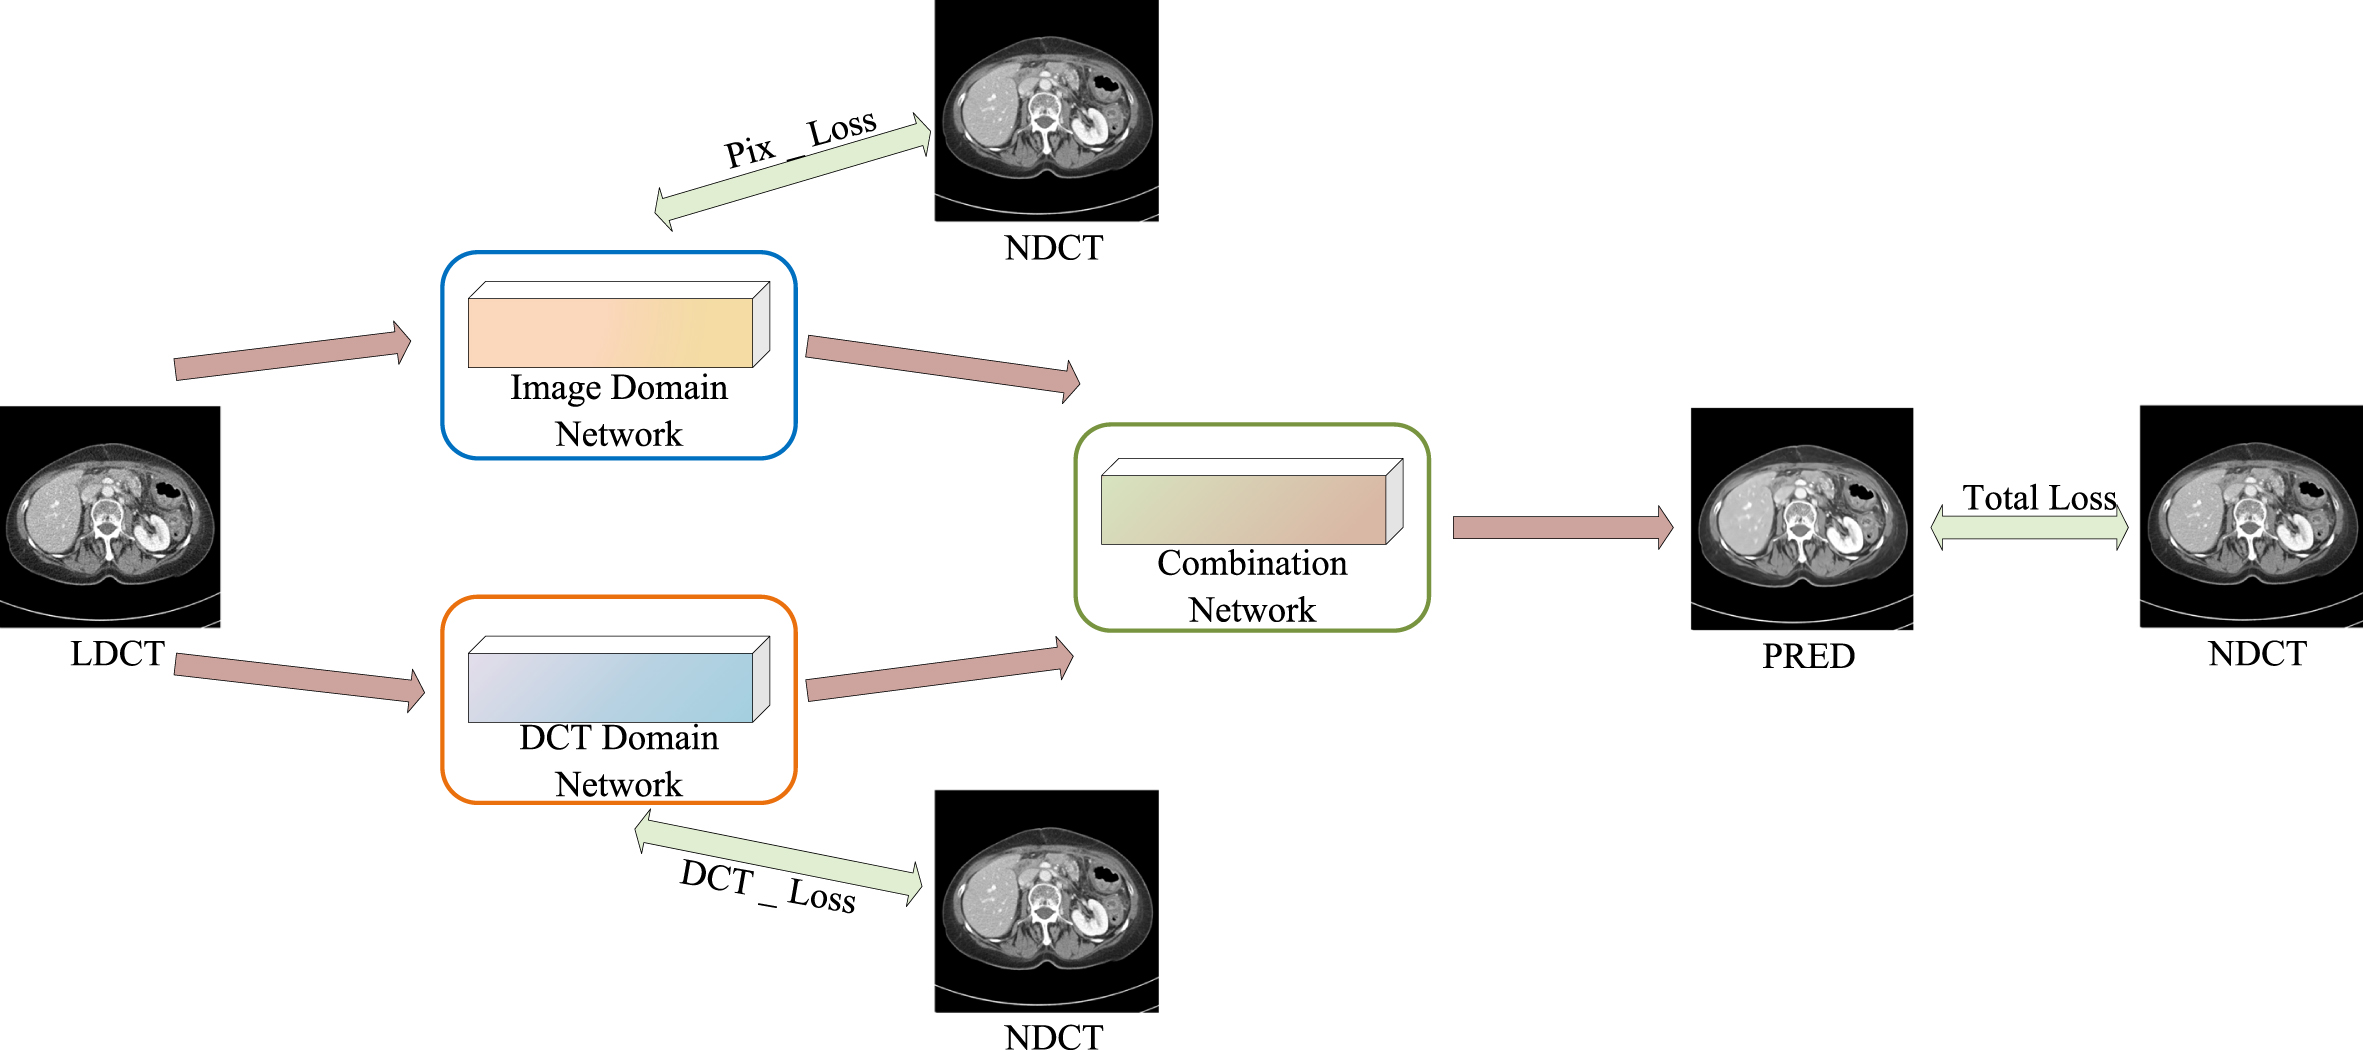
Network architecture of DFCNN.
Among them, Com (•) is the combination network, IMG (•) is the image domain network, and DCT (•) is the DCT domain network.
The image domain network in the pixel domain to deal with the input LDCT image. In this part, we propose a top-down self-guided framework, which can effectively fuse multi-scale information and extract good local features. While removing noise, it retains detailed texture information and improves the quality of reconstructed images. As shown in Fig. 3(a), the network consists of the following parts: First, given the input image L0. Since the maximum pooling can preserve the texture features well, the input image L0 is down-sampled by the maximum pooling to obtain the input feature maps at three scales: L1, L2, and L3. The input characteristic figure L3 first uses 3×3 convolution and the Tanh activation function segmentation scale features information to increase the figure of the channel number, and then the DCR module (as shown in Fig. 3(d)) is used to get the context of the diversity of information. Therefore, the resolution of the feature map is very small, and only the residual structure composed of the 3×3 convolution and the Tanh activation function can obtain enough feature information. This is followed by U-Net [41], a network of deep encoding-decoding and skip connections because studies have shown that continuous up-sampling and down-sampling contribute to denoising tasks.
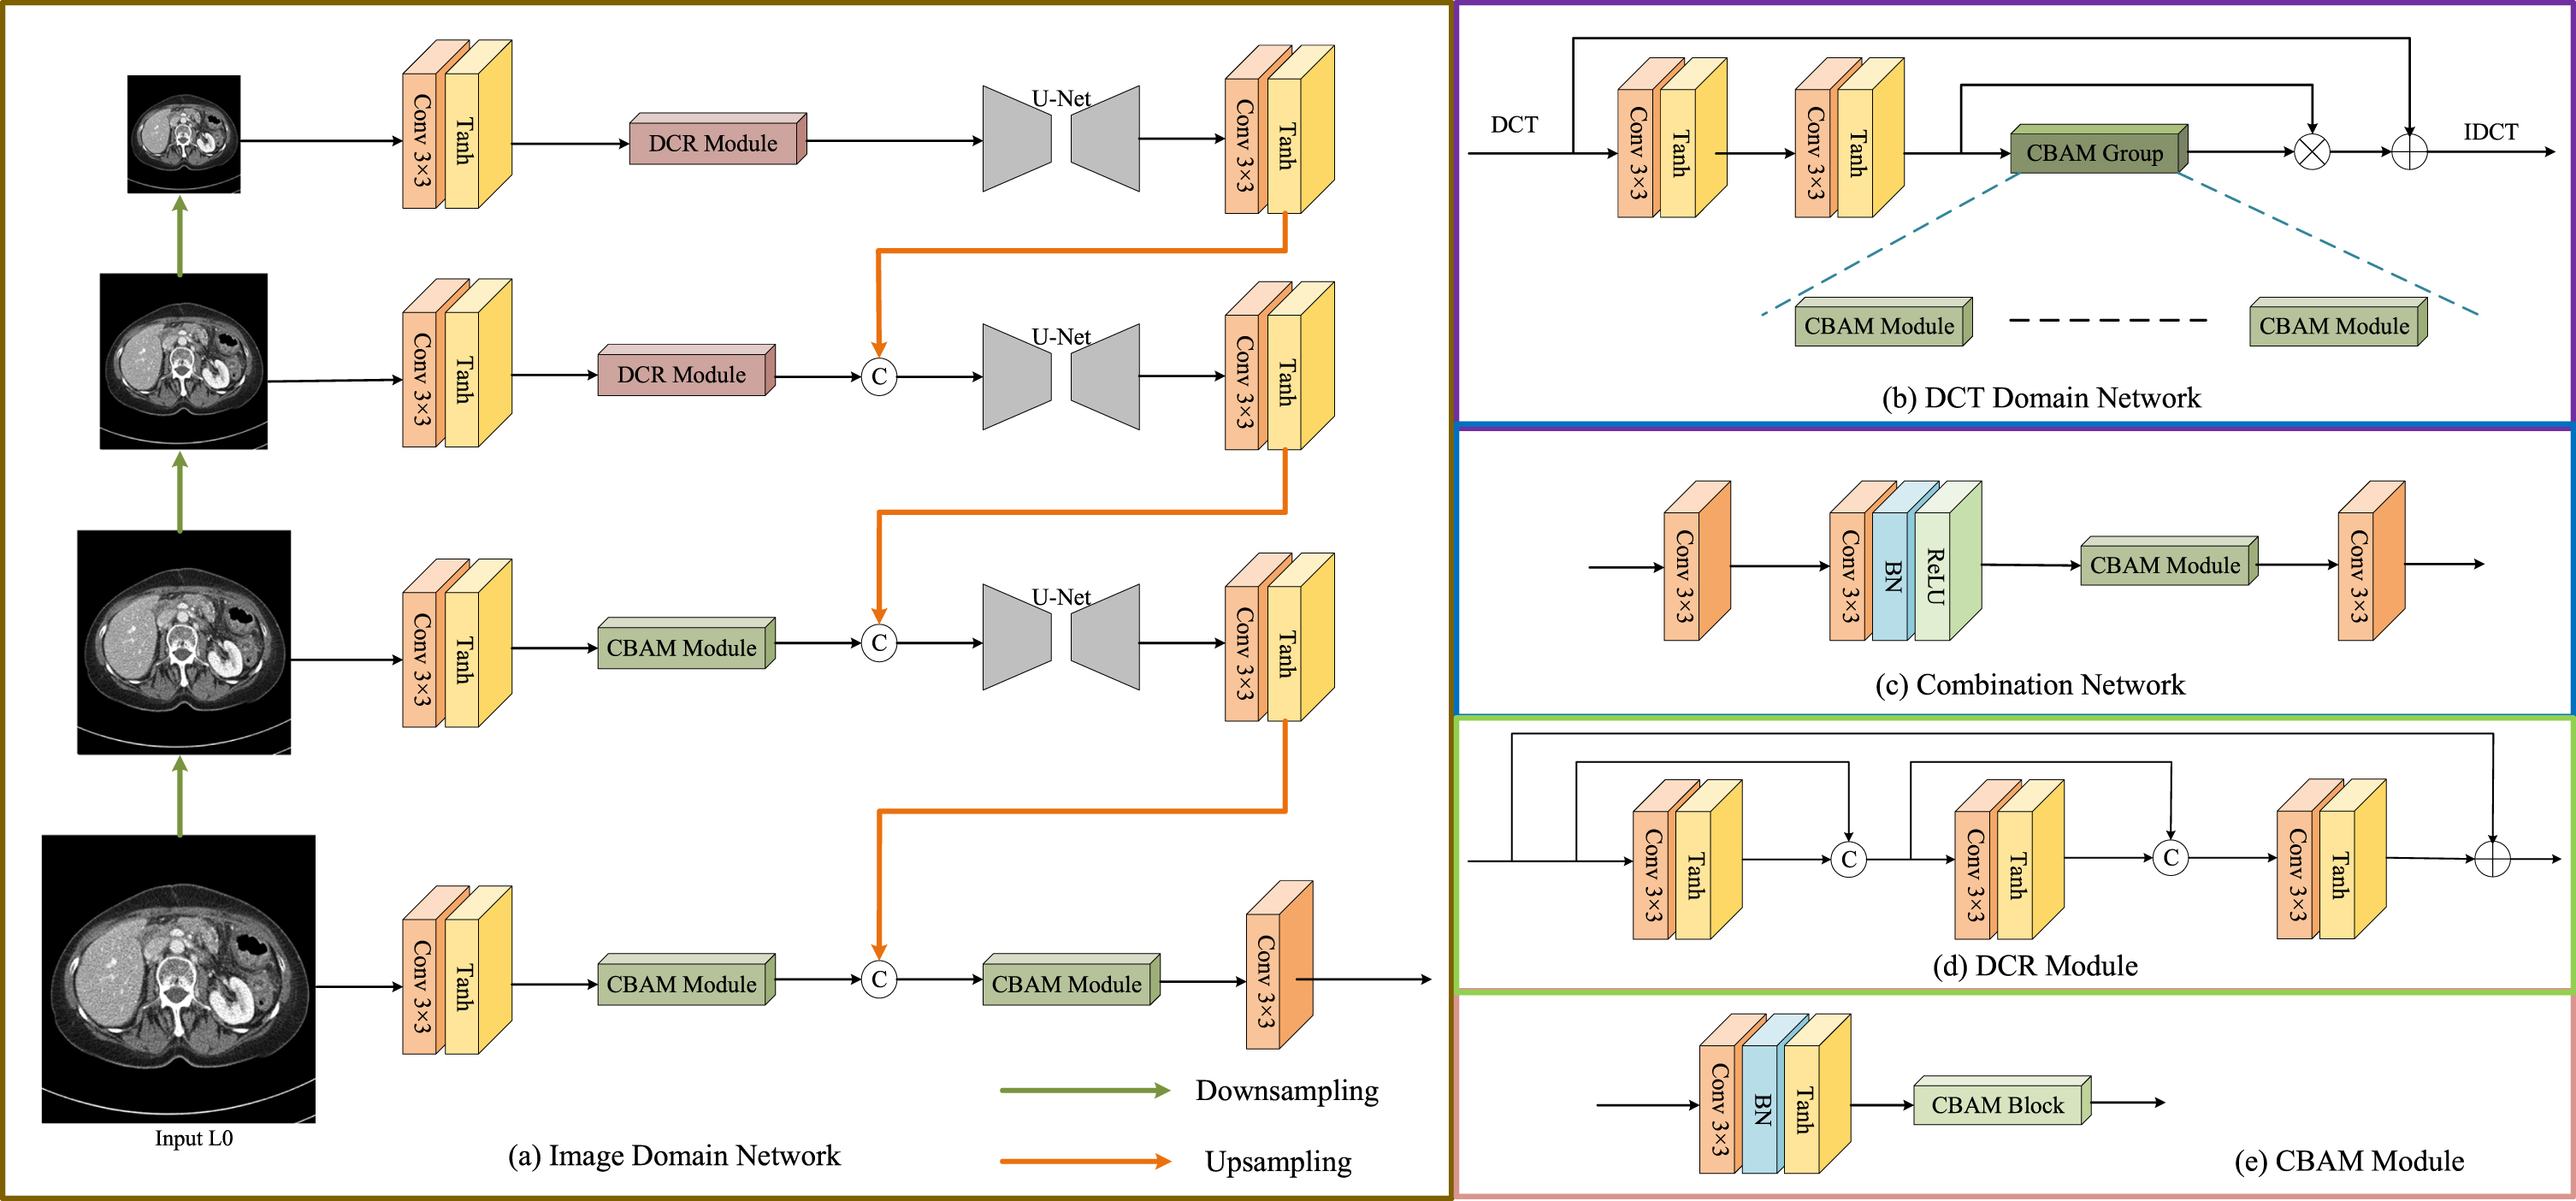
Diagram of each module in Fig. 2.
We designed U-Net with four down-sampling and four up-sampling. Finally, the 3×3 convolution and Tanh activation function are used to obtain information on the characteristic of the branch whose input is L3. The operation of the L2 input branch is the same as that of the L3 branch. The feature information obtained by the L3 branch is up-sampled and incorporated into the L2 branch with higher resolution to guide the higher-scale feature extraction process. In the branch with input L1, the 3×3 convolution and Tanh activation function are used to refine the feature information of this scale, and then the CBAM module (shown in Fig. 3(e)) is used to capture richer feature representations. After that, the input of the L2 branch is up-sampled and merged into the L1 branch, and the multi-feature fusion of the two branches is performed with U-Net. Finally, the 3×3 convolution and Tanh activation functions are used to obtain the branch feature information with input L1. The branch with the input of L0 also uses 3×3 convolution and Tanh activation function and then uses the CBAM module. After that, the input of the L1 branch is upsampled and merged into the L0 branch, and the information is fused with the CBAM module. The CBAM module can effectively extract accurate semantic information for small textures. Finally, at the end of the underlying branch, the final output image is generated using a convolutional layer. The overall process consists of the simplest convolution, activation function, and CBAM, but the improved image quality after reconstruction is positive.
The distribution of LDCT images in the frequency domain is complex, and noisy CT images cannot be distinguished from clean CT images. Hence, it is necessary to explore the characteristics of noise in the frequency domain to effectively remove the noise of CT images. Therefore, we developed an additional DCT domain network to process the DCT coefficients of the input LDCT image to eliminate noise in the frequency domain. The DCT domain network is shown in Fig. 3(b). We adopt a structure composed of residual learning and CBAM. First, the discrete change in cosine is used to obtain the information in the input DCT domain, and sufficient information on the characteristics is obtained through two modules composed of 3×3 convolution and Tanh activation function. Then, the CBAM group composed of the CBAM Module further captures the fine texture information, and then uses the attention mechanism to obtain the feature weight and uses the residual method to obtain the input in the frequency domain. Finally, the discrete cosine inverse transform (IDCT) is used to obtain the final output image.
Combination network
By combining two images from the image domain and the DCT domain network, we get the final denoised CT image. As shown in Fig. 3(c), the structure of the combination network is also very simple and clear. First, the feature map from the two parts of the image is extracted using 3×3 convolution, and then a set of modules composed of 3×3 convolution, batchnormal and ReLU are used to obtain sufficient feature information, and then CBAM module is used to further capture small texture information. Finally, the convolution layer is used to generate the final output image.
Tanh and ReLU
In the whole process, we use two activation functions, one is the Tanh activation function and another is the ReLU activation function. The Tanh activation function solves the problem that the output is not centered on 0, which slows down the convergence, and also has a certain effect on the preservation of edge details. Therefore, the Tanh activation function is frequently used in feature extraction in the image domain and the DCT domain. The ReLU activation function can be saturated without gradient in the non-zero interval, to solve the problem of gradient disappearance, and can effectively propagate the gradient to be updated. There is also a point that the ReLu function is sparse, and the operation of changing the negative number to 0 makes the data sparse, which makes the network robust and alleviates the occurrence of overfitting problems, and the ReLU calculation is very convenient and efficient. Therefore, the ReLu function is used in the combination network to obtain the final output image.
Loss function
To improve the denoising performance of the proposed network, we use different loss functions to restrain the channels of different sub-networks. The mean absolute error (L1 Loss) is widely used in low-level image processing tasks, such as image de-noising and image enhancement. L1 calculates the output intensity difference between the pixel point and the ground truth value, which is also used by many low-dose CT noise reduction algorithms. We started our research by optimizing L1 loss, and the loss of image domain and DCT domain is completed by L1 loss. In the final result of the fusion, the L1 loss cannot achieve better results. We use a compound loss function consisting of L1 loss, Charbonnier loss [42] and edge loss [43] for the final constraint.
where ɛ= 10–3 is the offset value and Δ (•) is the Laplace operator, N represents the number of images, H and W represent the height and width of the image, respectively.
Combining L1 loss, Charbonnier loss and edge loss, we propose the compound loss function.
where λ is used to control the contribution of edge loss, and λ= 0.05.
To demonstrate the ability of our proposed DFCNN to remove LDCT image noise, we used the 2016 NIH AAPM-Mayo Clinic Low-dose CT Grand Challenge dataset [44] and the Piglet dataset [45]. The AAPM dataset contains paired 3 mm normal-dose CT (NDCT) images and synthetic quarter-dose CT (LDCT) images with a size of 512×512, collected from 10 patients. Therefore, the model has an LDCT image as input and an NDCT image as target, which can support the supervised training process. In our experiment, we segmented the dataset before training, using CT images of 9 patients (812 pairs) as the training set and images of the remaining patient (35 pairs) as the test set. The Piglet CT data set was 512×512. The GE scanner (Discovery CT750 HD) was used to obtain different dose ranges (50 %, 25 %, 10 % and 5 %) with the radiation dose of 300 mAs as normal dose. 400 pairs of piglet images (150 Ma and 300 mAs tube current) were selected as training input. We tested the trained model on four different dose data set, and each test data set had 40 pairs. In the training process, we adopted a data enhancement strategy of randomly cutting patches. Specifically, the patch size is set to 160 * 160, the sliding interval is 80 pixels, and so is the target batch NDCT image. In our experiment, we evaluated several combinations of parameters and finally determined the following parameter settings. During training, we used Adam to optimize the network weights. The initial interest rate α is set at 10–3, two exponential decay factors β1 = 0.5 and β2 = 0.999, and 300 trainings are performed to converge the model. Our DFCNN is built in the PyTorch framework and implemented on an Intel (R) Core (TM) i9-10900X CPU workstation equipped with a GPU card with 24GB memory (NVIDIA RTX A5000) to speed up the training process. Although training is performed on patches, the proposed network can handle images of any size. All test images are simply entered into the network without being decomposed.
In terms of visual effect and quantitative evaluation, seven different advanced methods are compared with our DFCNN, including the traditional method BM3D, the residual structure REDCNN, the edge-based EDCNN, the Transformer-based CTformer [38], the GAN-based QAE, the physical model-based CNCL and the dual-path Ed_DuCNN [46]. The parameters of these comparison methods are set according to the recommendations of the original paper.
In order to quantitatively evaluate the denoised CT image, structural similarity based on structural difference (SSIM) [47], peak signal-to-noise ratio (PSNR) based on pixel gray difference, gradient similarity deviation based on gradient change (GMSD) [48], feature similarity index measurement based on feature difference (FSIM) [49], and multi-scale pixel domain implementation based on visual perception (VIFS) [50]. SSIM calculates the product of brightness similarity, contrast similarity and structural similarity, and then predicts the local image quality at a certain position. Higher SSIM means better similarity between the denoised image and the reference image. FSIM combines the similarity of phase congruency maps and gradient magnitude maps between the reference image and the processed image. VIF is based to quantify the ideally can be brain extract information, its score represents the reference image and processing image between the shared information. As with SSIM, the higher the values of FSIM and VIF, the better the image quality. The GMSD represents the similarity of the gradient magnitude map between the reference image and the processed image on the pixels, and the GMSD score with good processing results is low. The implementation of these comparison procedures is based on their official code, and their parameters are set according to the document’s recommendations.
Comparative experiments and analysis
Mayo experiments
(1) Qualitative assessment
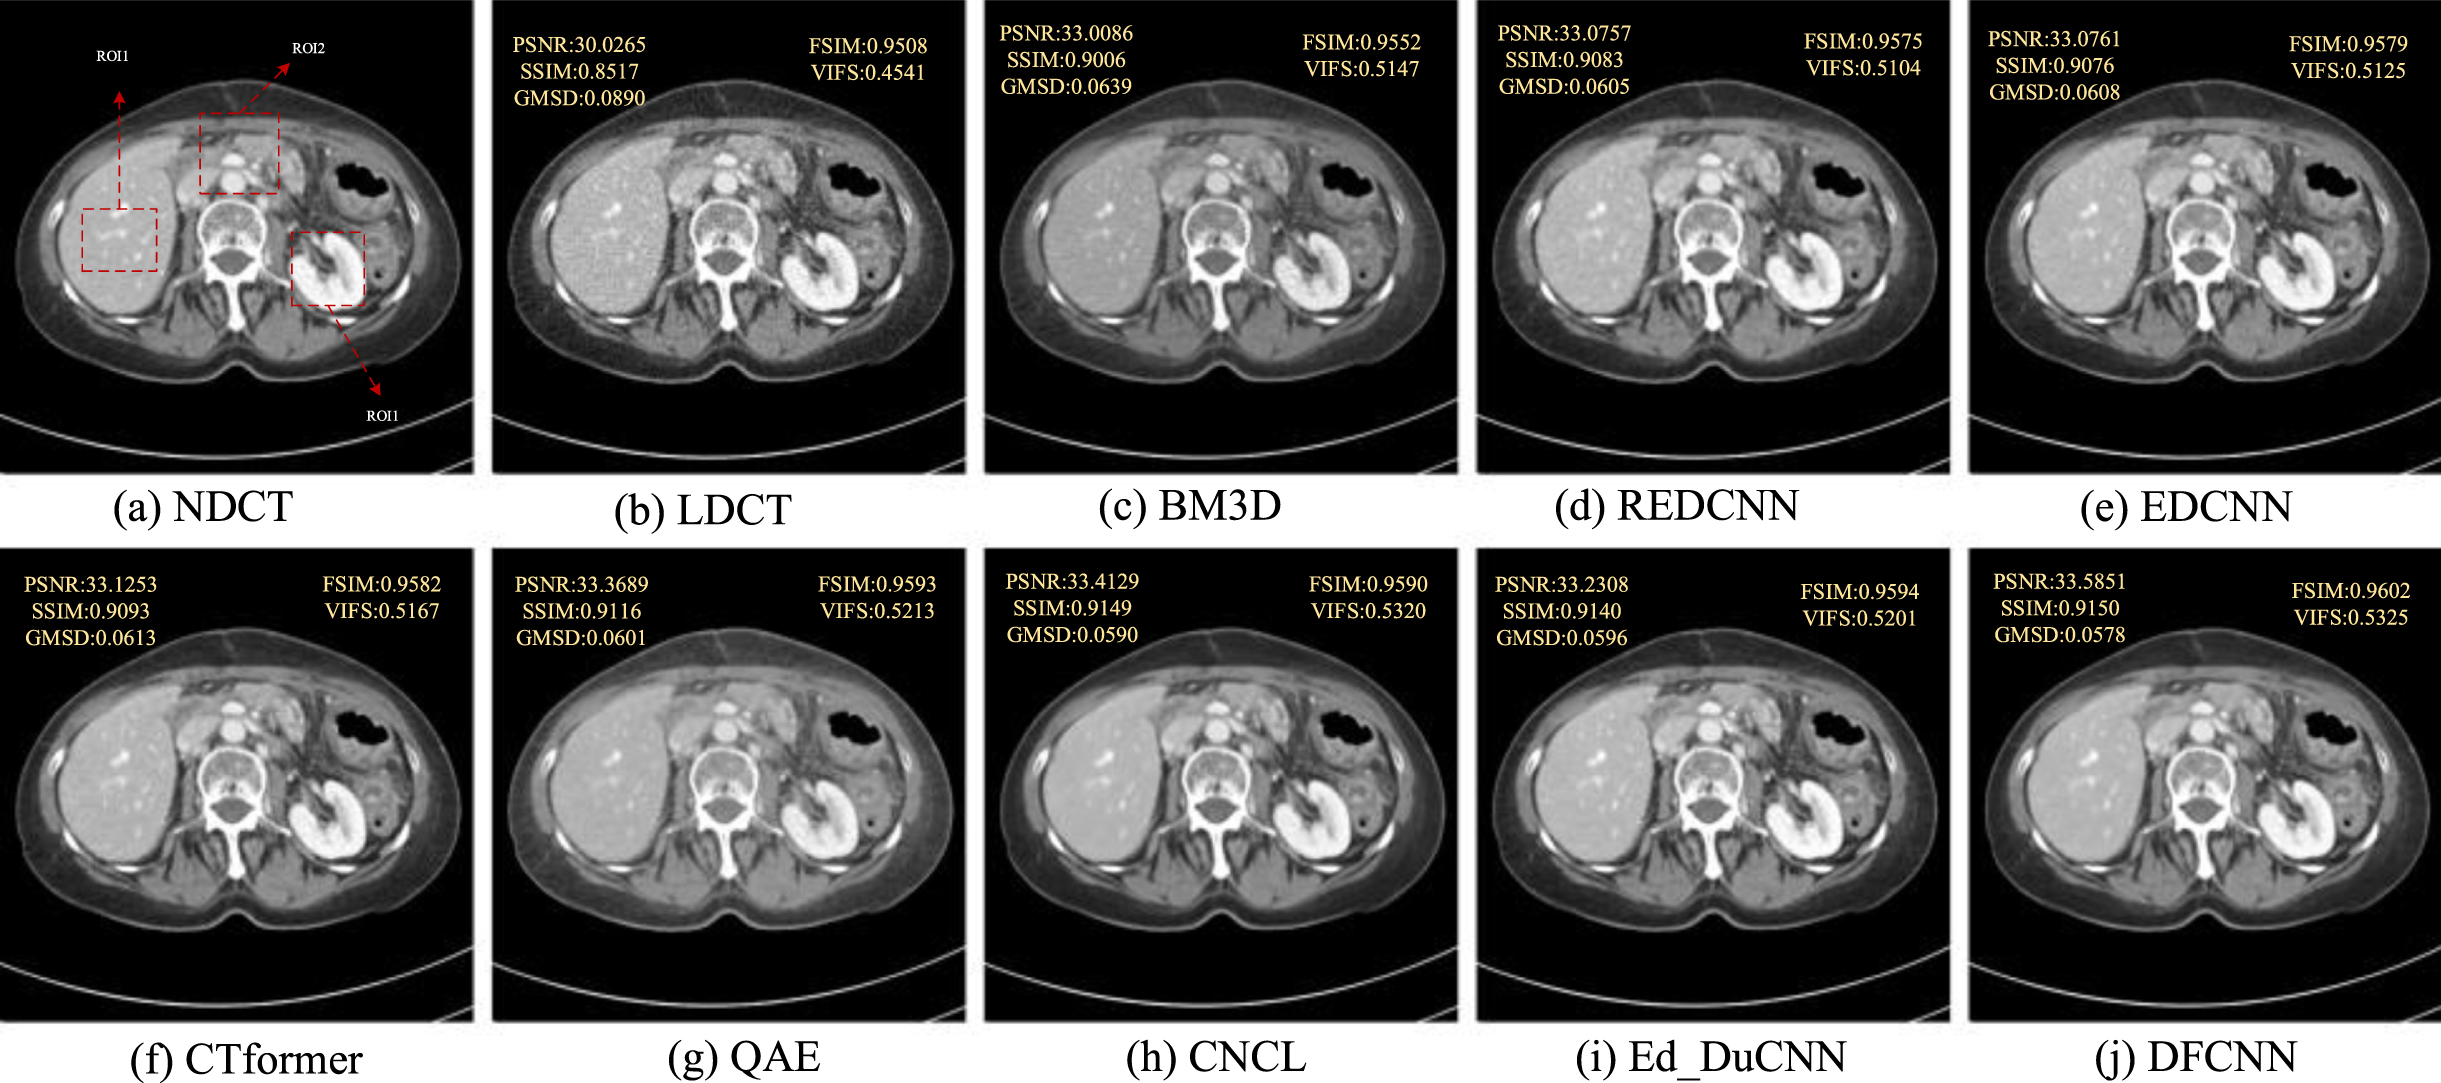
In this part, according to the characteristics of the LDCT images, we selected two representative LDCT images from the test set to visually analyze several representative denoising results. As shown in Figs. 4 and 5, all axial CT images are displayed in the [– 160, 240] HU window. From artifacts, noise and edge retention and contrast of image denoising effect for subjective evaluation. As shown in Figs. 4(b) and 5(b), the large amount of speckle noise and fringe artifacts present in the LDCT image makes it difficult for doctors to determine clinically significant lesion information due to insufficient photons from incident X-rays. Overall, the six methods can achieve a certain degree of denoising effect, and different denoising methods have different degrees of suppression of noise and artifacts in LDCT images. To clearly show the noise reduction effect, we enlarged some regions of interest (ROI) in Figs. 6 and 7. We can observe the structure of the human body in NDCT images. However, LDCT images are contaminated by obvious edge artifacts and speckle noise.
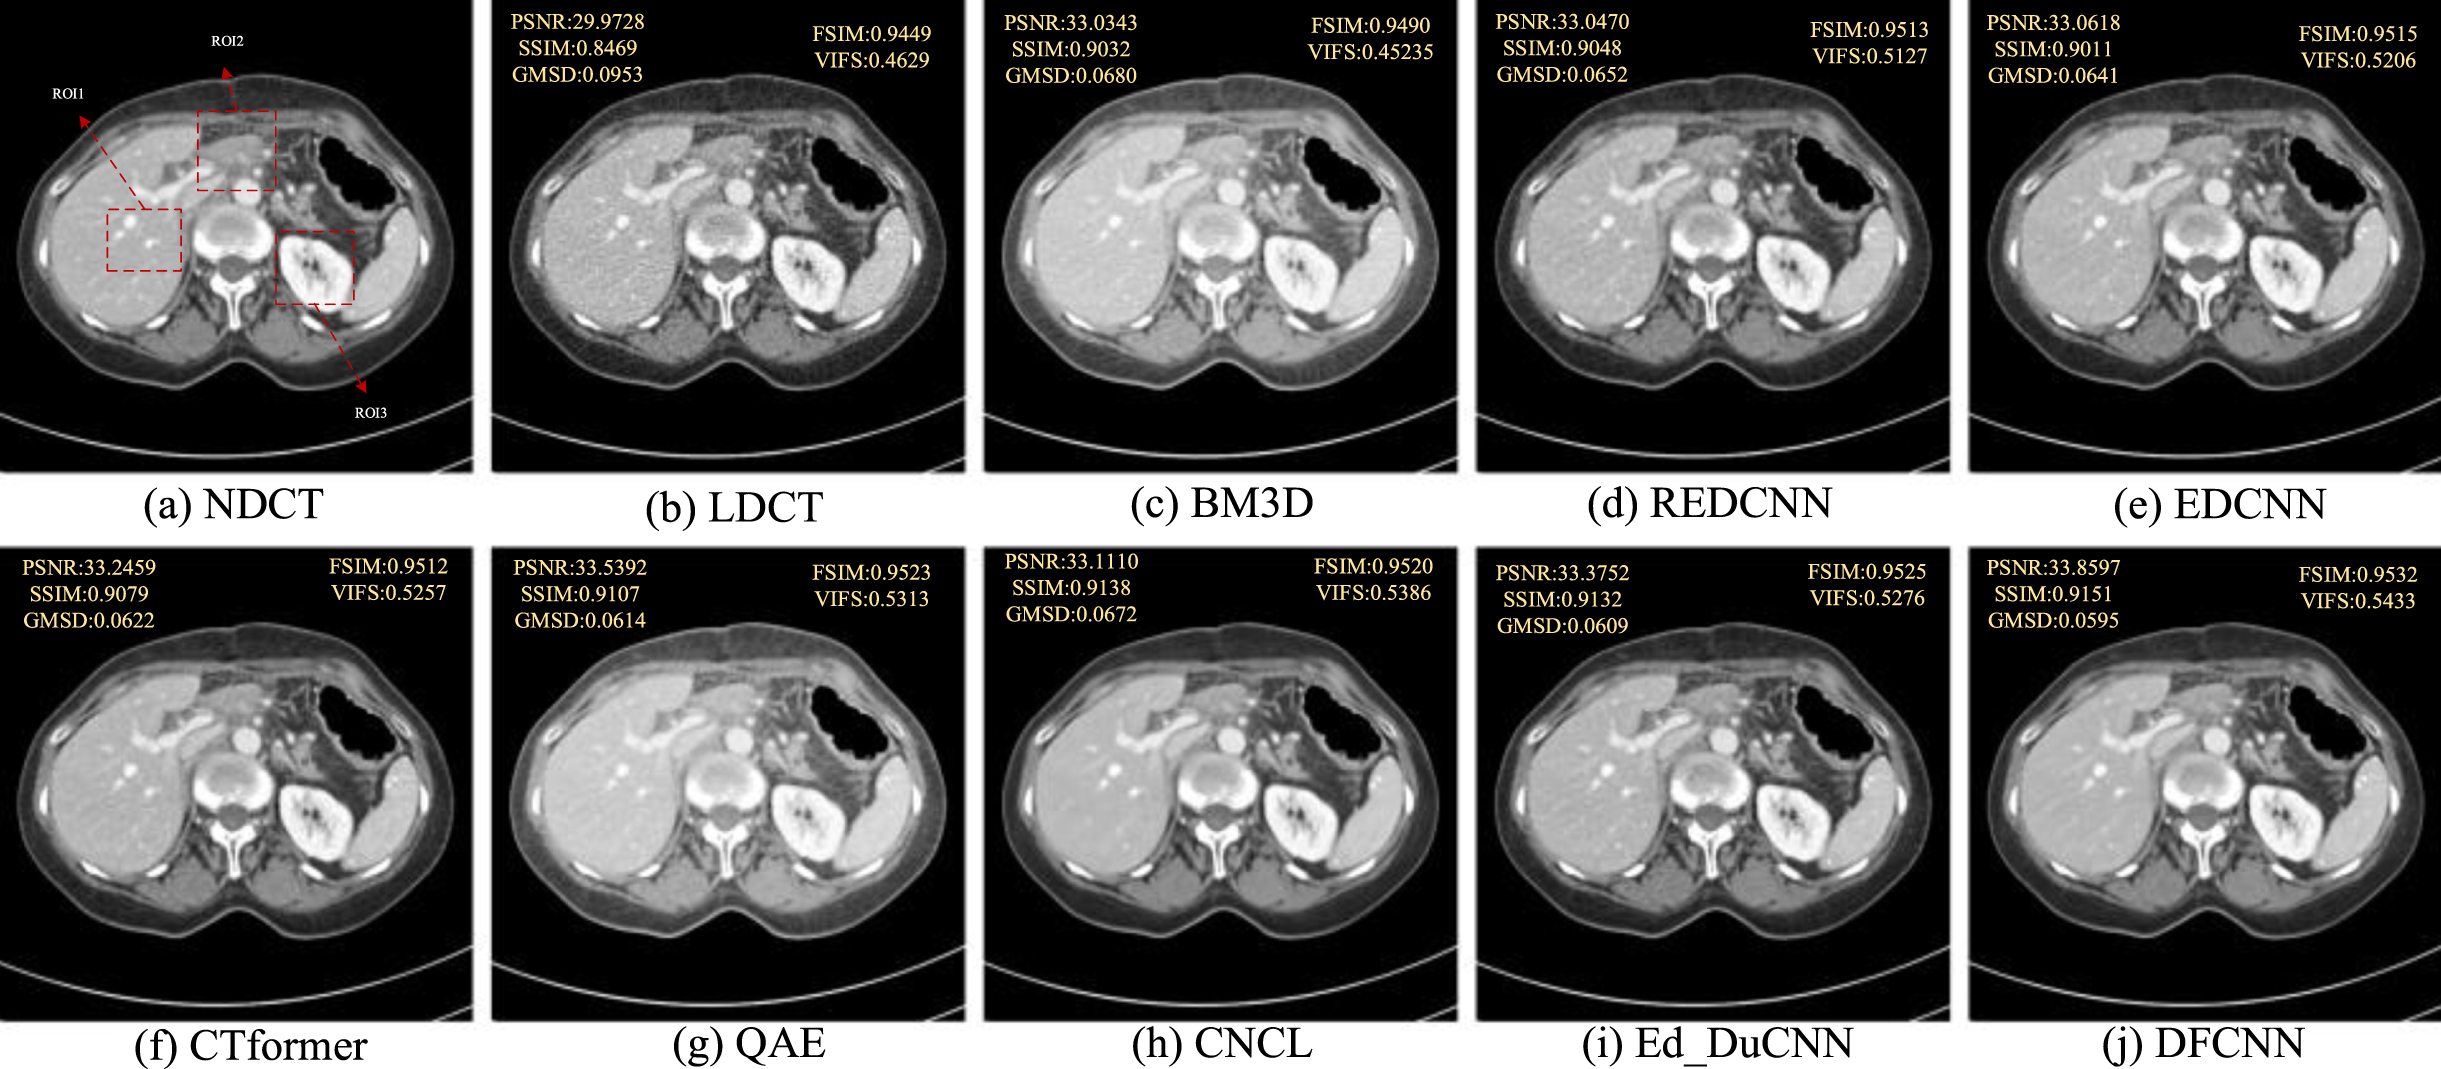
Comparison of denoising results for sample 1 (a) NDCT, (b) LDCT, (c) BM3D, (d) REDCNN, (e) EDCNN, (f) CTformer, (g) QAE, (h) CNCL, (i) Ed_DuCNN, and (j)DFCNN.
Comparison of denoising results for sample 2 (a) NDCT, (b) LDCT, (c) BM3D, (d) REDCNN, (e) EDCNN, (f) CTformer, (g) QAE, (h) CNCL, (i) Ed_DuCNN, and (j) DFCNN.
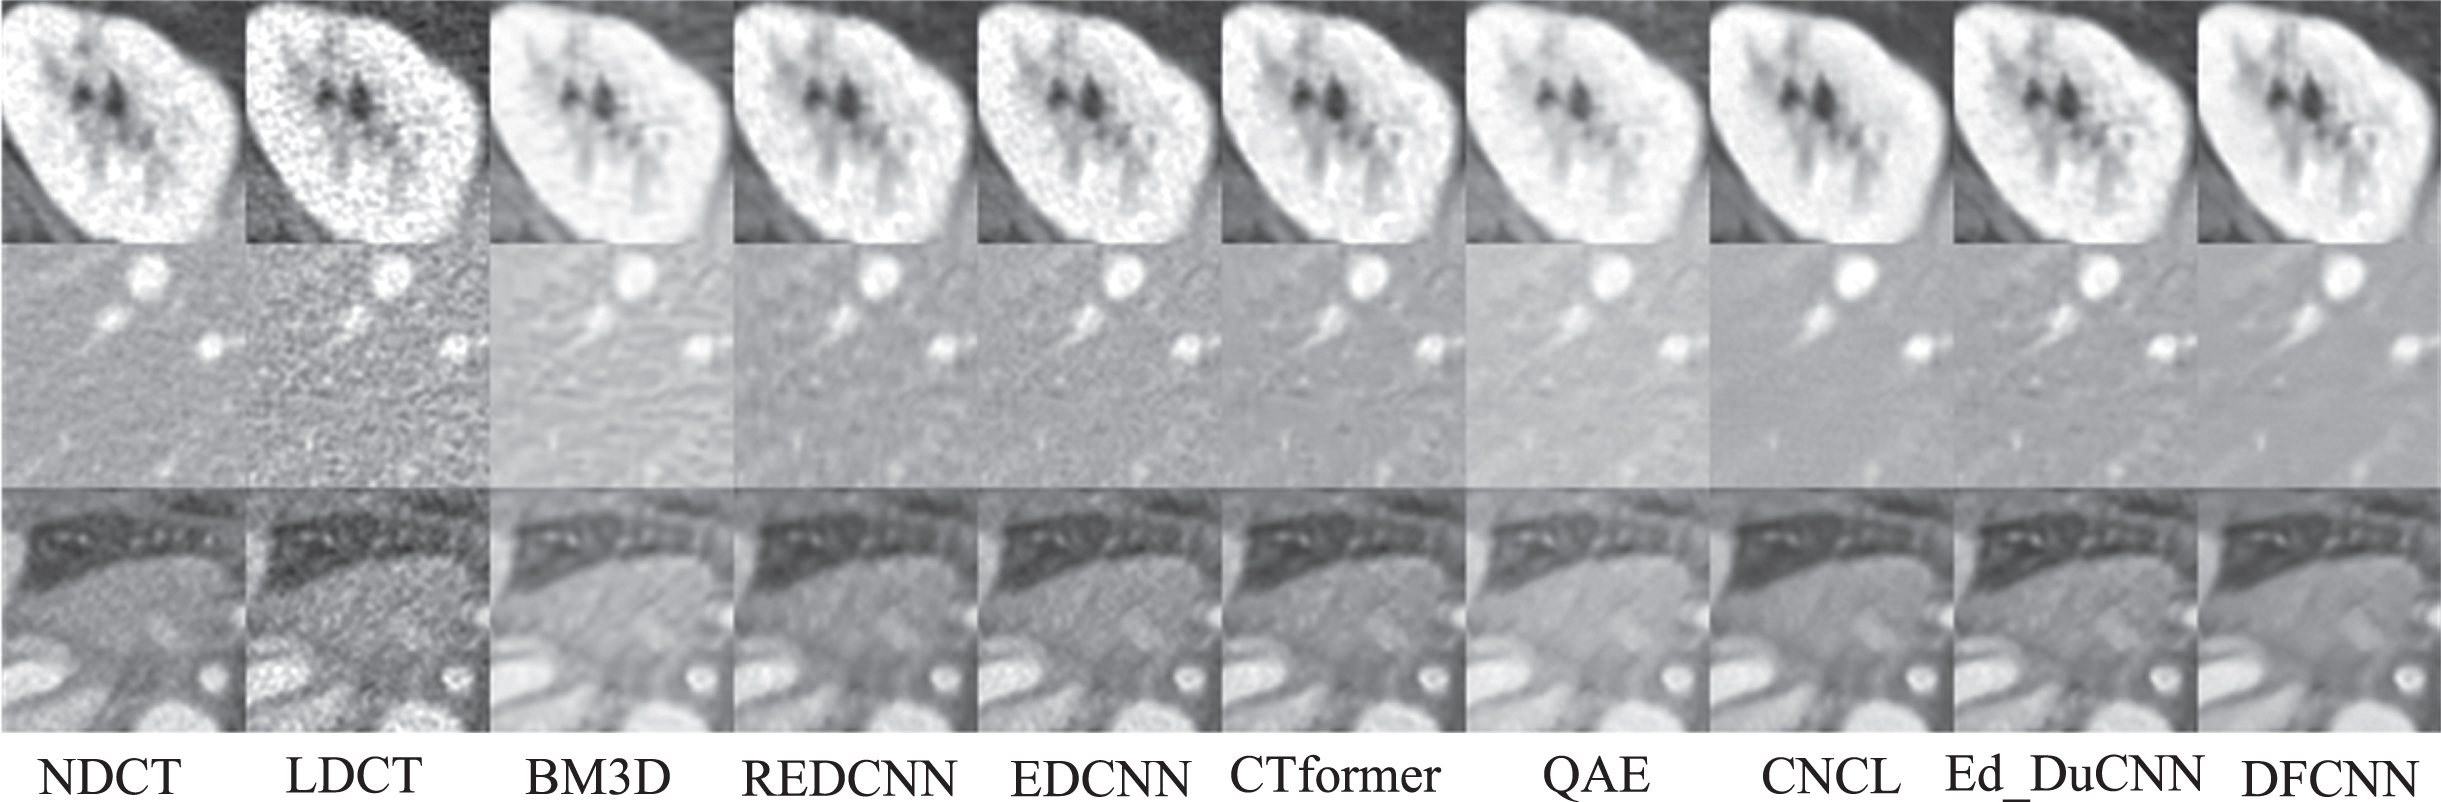
Magnification ROIs in Fig. 4.
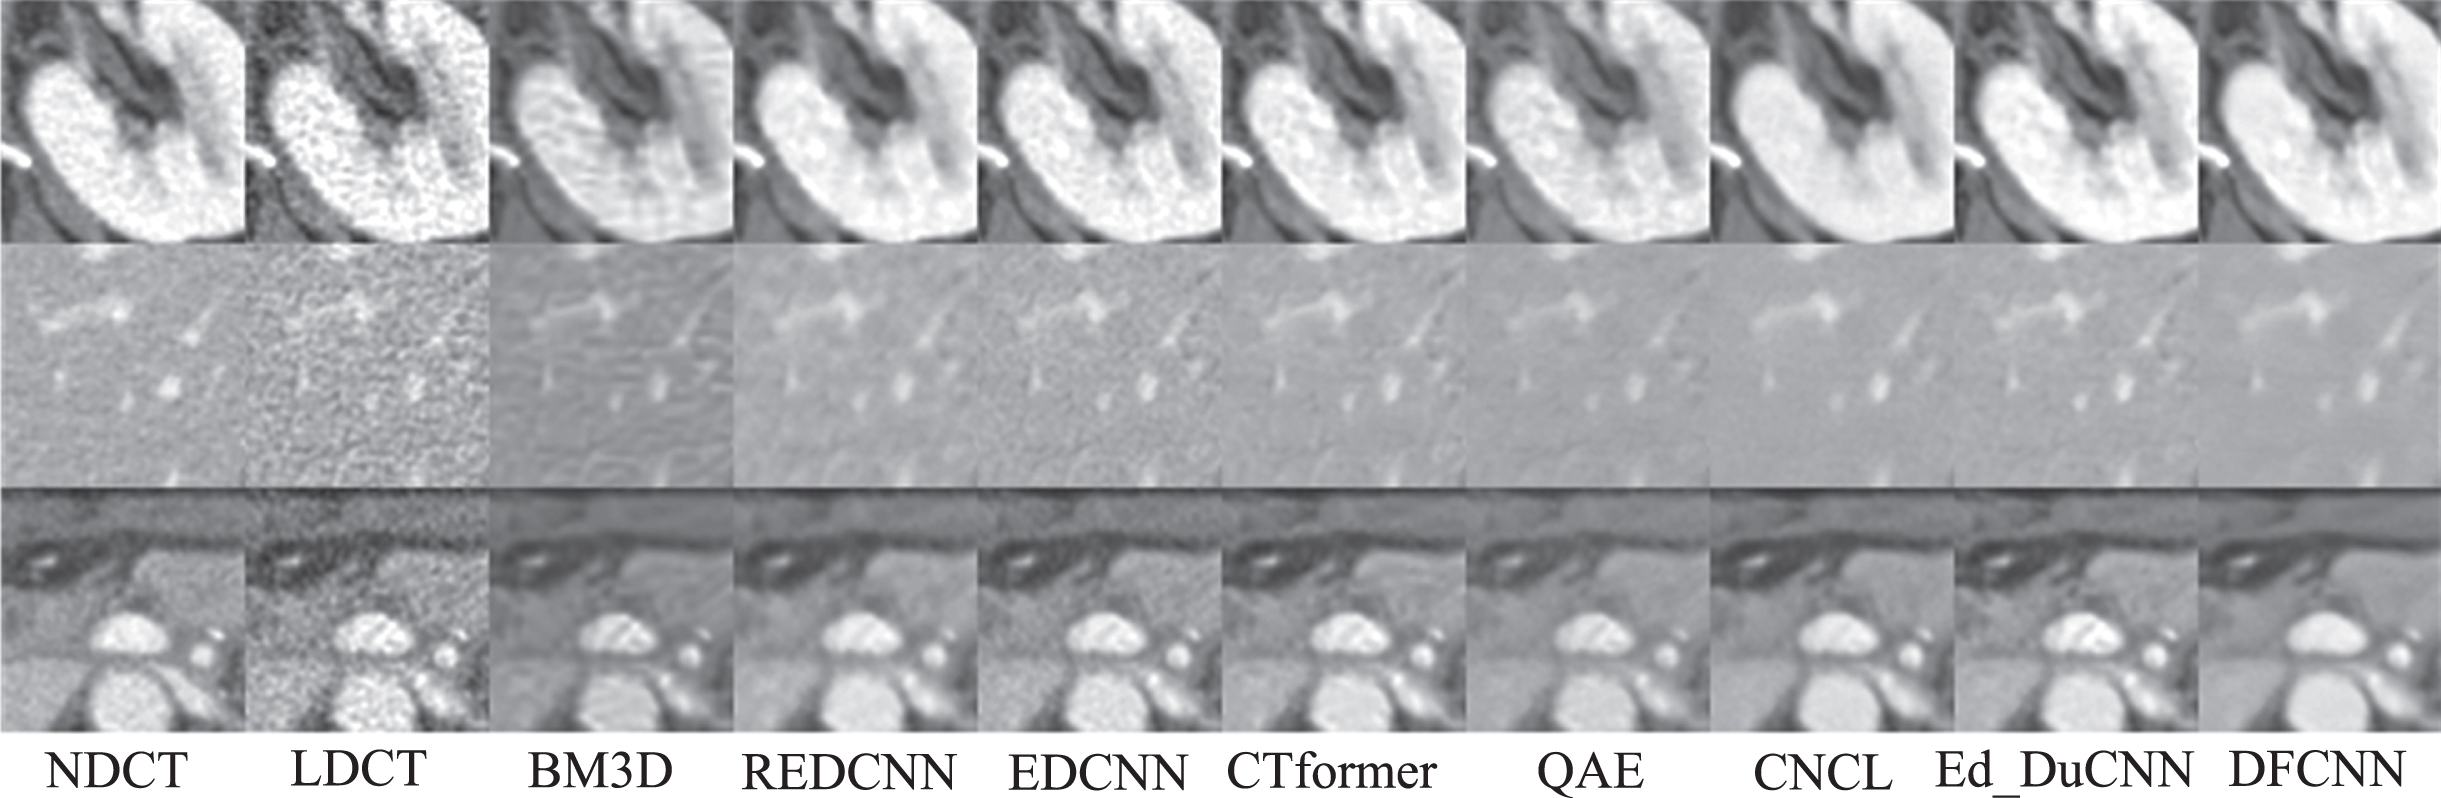
Magnification ROIs in Fig. 5.
As shown in Figs. 4(c–j) and 5(c–j), the denoising performance of BM3D is not significant, and BM3D introduces new artifacts in the denoising result image. Although REDCNN can significantly eliminate noise, it does have the problems of too bright images and loss of texture details. It can be seen from the image that EDCNN’s results are more satisfactory in terms of edge retention, but subtle fringe artifacts are still visible. QAE and CTformer remove most of the speckle noise in LDCT images, but still cannot effectively remove artifacts. Ed_DuCNN also removes a lot of noise to some extent, but the image is relatively rough. On the contrary, CNCL and our DFCNN achieved better results in effectively removing noise/artifacts and protecting tissue/structure. However, the texture of DFCNN is the clearest. These results show that our proposed DFCNN has good texture retention and noise/artifact suppression capabilities.
It is well known that texture information of CT images has a great influence on the diagnosis of radiologists. This method can effectively suppress artifacts, and restore texture and detail, closer to NDCT. LDCT minus the different denoising results of difference image as shown in Fig. 8. Obviously, the detailed residuals of different images can reflect the results of different denoising methods. The more details in the different images, the more details are suppressed in the noise reduction process. Analysis shows that the proposed network structure has a strong ability to suppress noise.
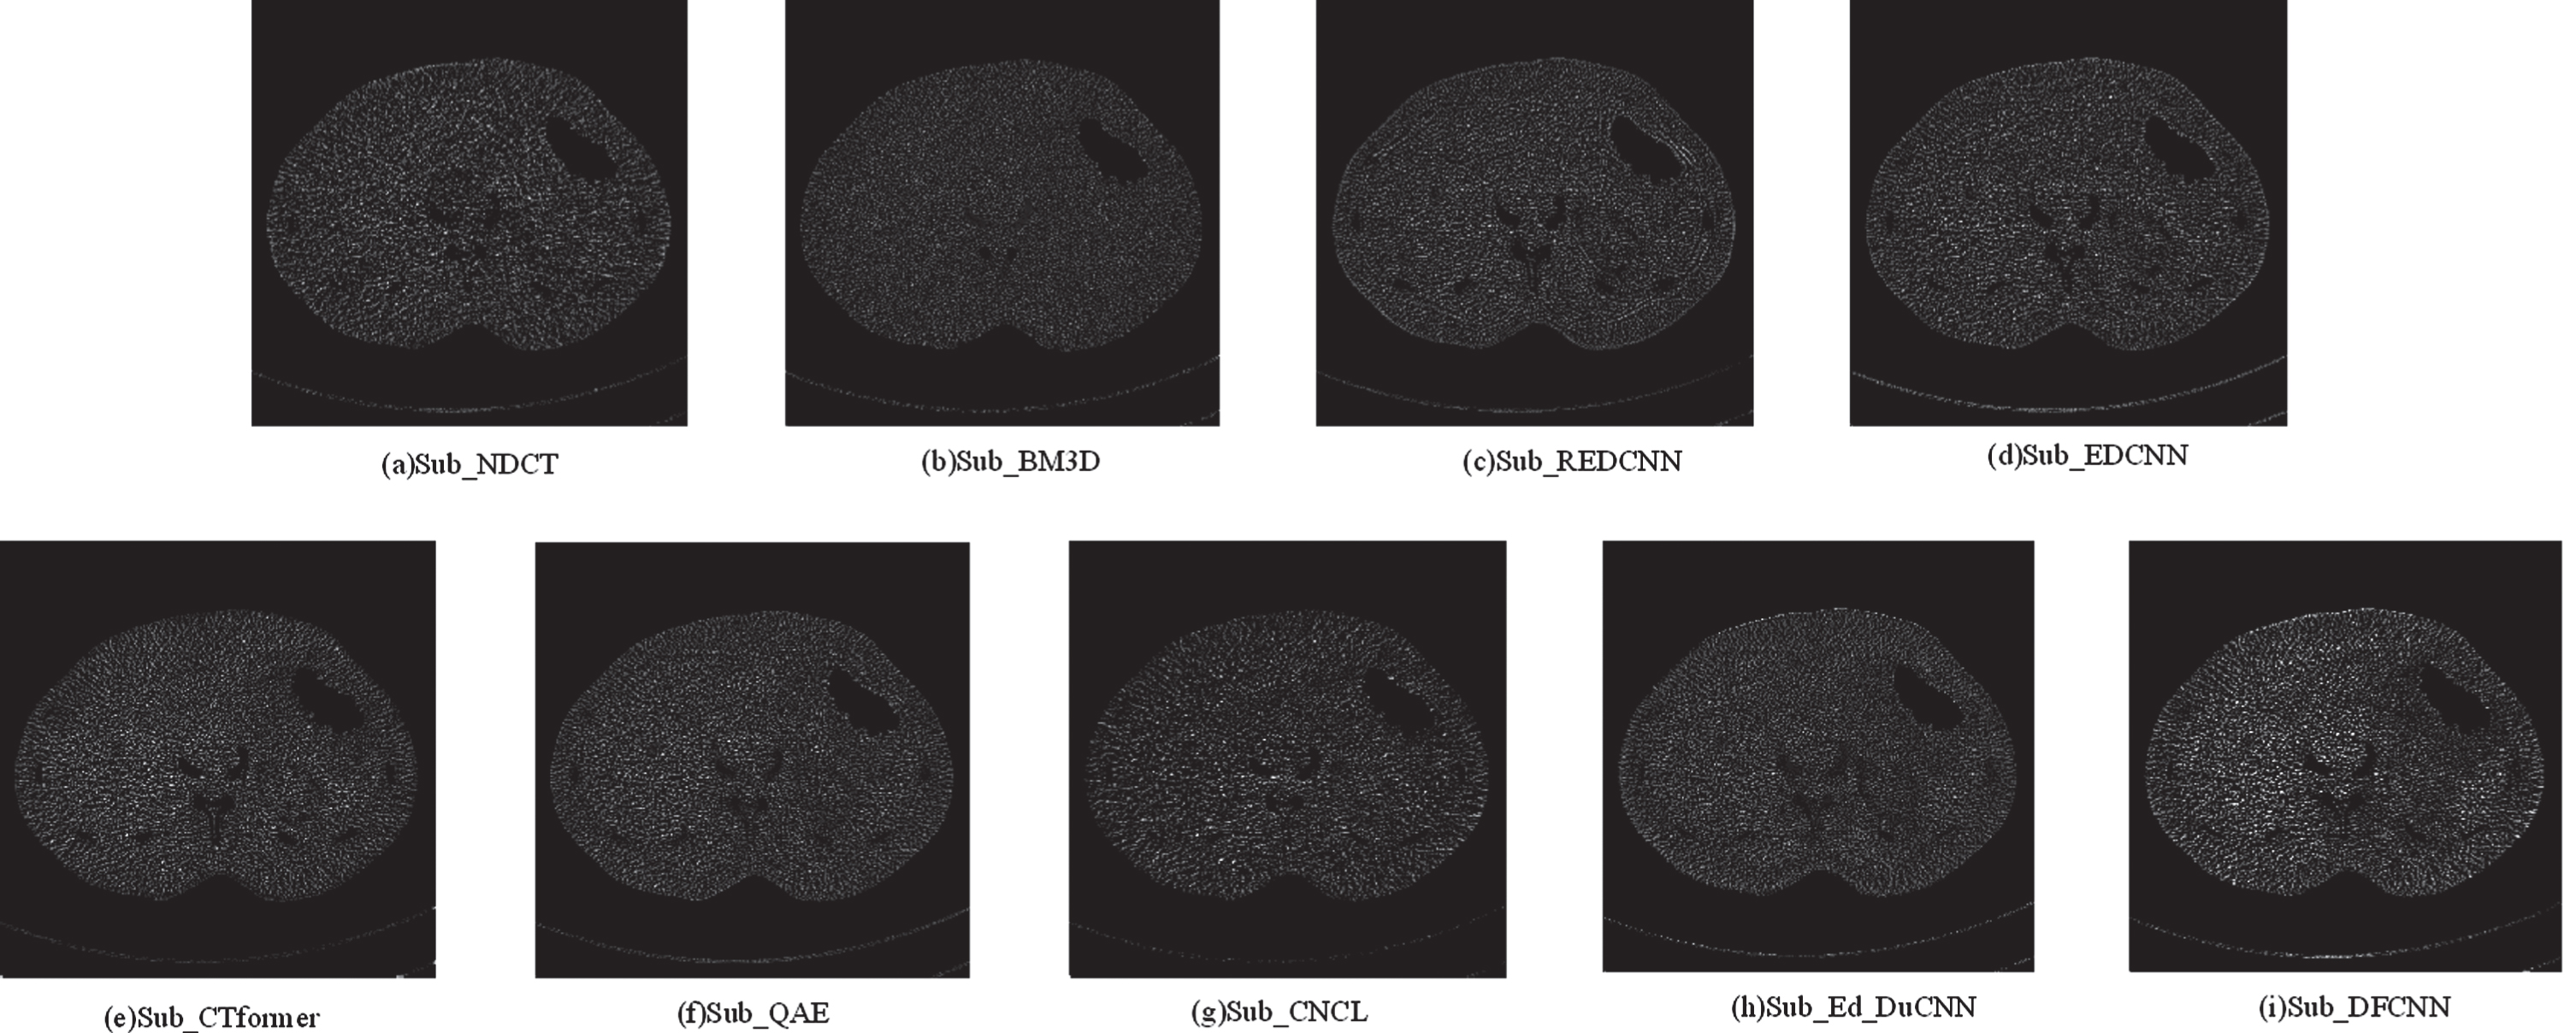
Difference images obtained by subtracting different denoised results from LDCT.
To quantitatively analyze the denoising effects of different methods, Table 1 shows the average values of PSNR, SSIM, GMSD, FSIM, and VIFS for all test results for different algorithms. The best value is represented in red, and the second-best value is represented in blue. Obviously, our method has good quantitative performance on all objective indicators, and the improvements in PSNR and SSIM are also obvious. From Table 1, BM3D and CNCL have poor a peak signal-to-noise ratio. For VIFS, REDCNN has the lowest score, which is consistent with the visual judgment of excessive image smoothing and low contrast. Although CNCL is at a disadvantage in PSNR, its SSIM and VIFS values are second best. QAE and CTform are superior to the above two typical CNN-based methods. DFCNN has an optimal value for each metric, which indicates that DFCNN has good noise/artifact suppression (PSNR) and feature information retention (FSIMS), and the results are close to the corresponding NDCT images (GMSD and SSIM).
Average quantitative results for the testing set utilizing different methods
Average quantitative results for the testing set utilizing different methods
Since doctors tend to focus on ROI related to medical diagnosis, we also quantified the performance of each method in ROI using PSNR and SSIM, as shown in Fig. 9. By comparing the peak signal-to-noise ratio of various methods in the same region of interest, the proposed DFCNN is always in a leading position in quantization performance.
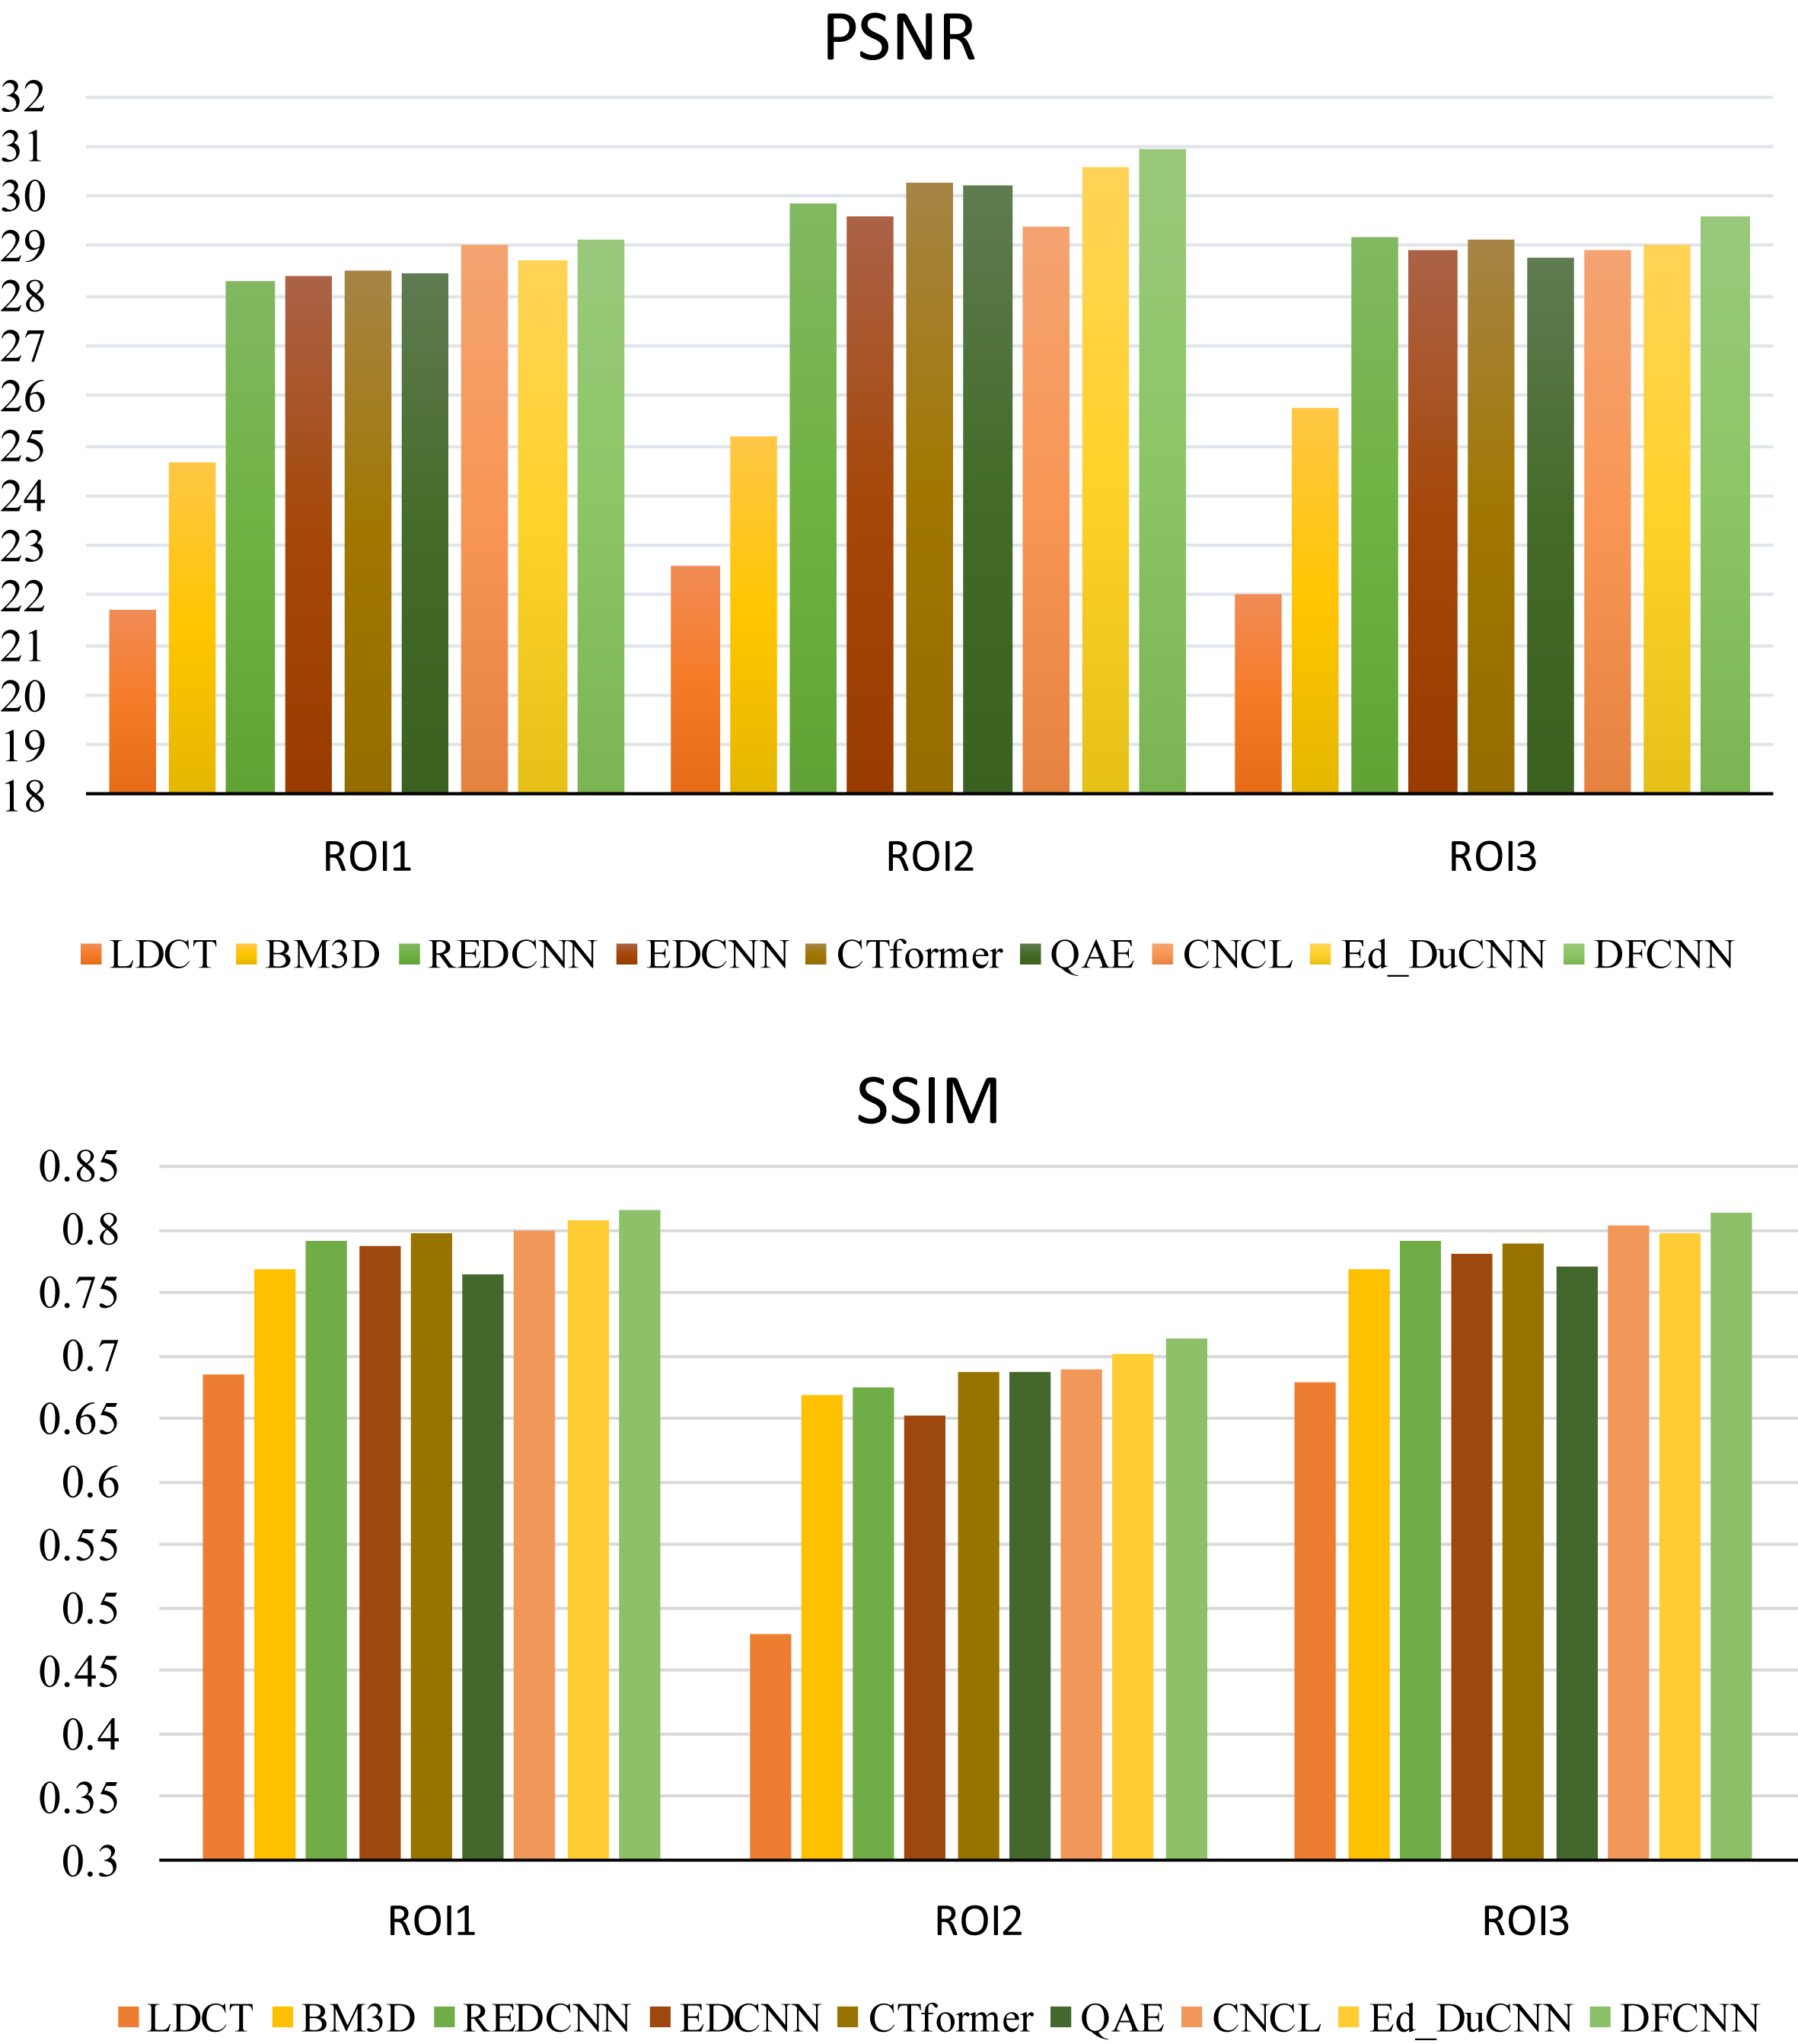
The quantitative evaluations on different ROIs are in Fig. 6.
In the blind reader study, we recruited two experienced radiologists to rate the 35 images of the test set in terms of noise reduction, detail recovery, diagnostic acceptance, and overall quality. The evaluation score range is 1 point, 5 points, 1 point represents ‘poor’, and 5 points represents ‘excellent’. Table 2 shows the final quantitative results of the assessment. Our results scored the highest in noise reduction and diagnostic acceptability.
Image quality scores of results obtained by using different methods on Mayo dataset
(1) Qualitative assessment
Figure 10 shows the results of representative piglet sections treated with different methods at different doses (50%, 25%, 10% and 5%). All CT images are displayed in the window [40, 400]. It shows that BM3D obtains over-smoothed results and shows additional artifacts. Since we have trained the data set of 150 mAs LDCT images, when the test images are from the data set of 75 mAs LDCT images and 30 mAs LDCT images, the CNN-based method can maintain a certain denoising performance. Specifically, REDCNN, CTform and QAE have blurred details. EDCNN retains edges and details but is poor at noise suppression. When the tube current is 150 mA and 75 m, the results of CNCL and the proposed DFCNN network are close to the corresponding NDCT images. However, when the image is heavily polluted (30mAs and 15mAs), all methods cannot achieve satisfactory results.
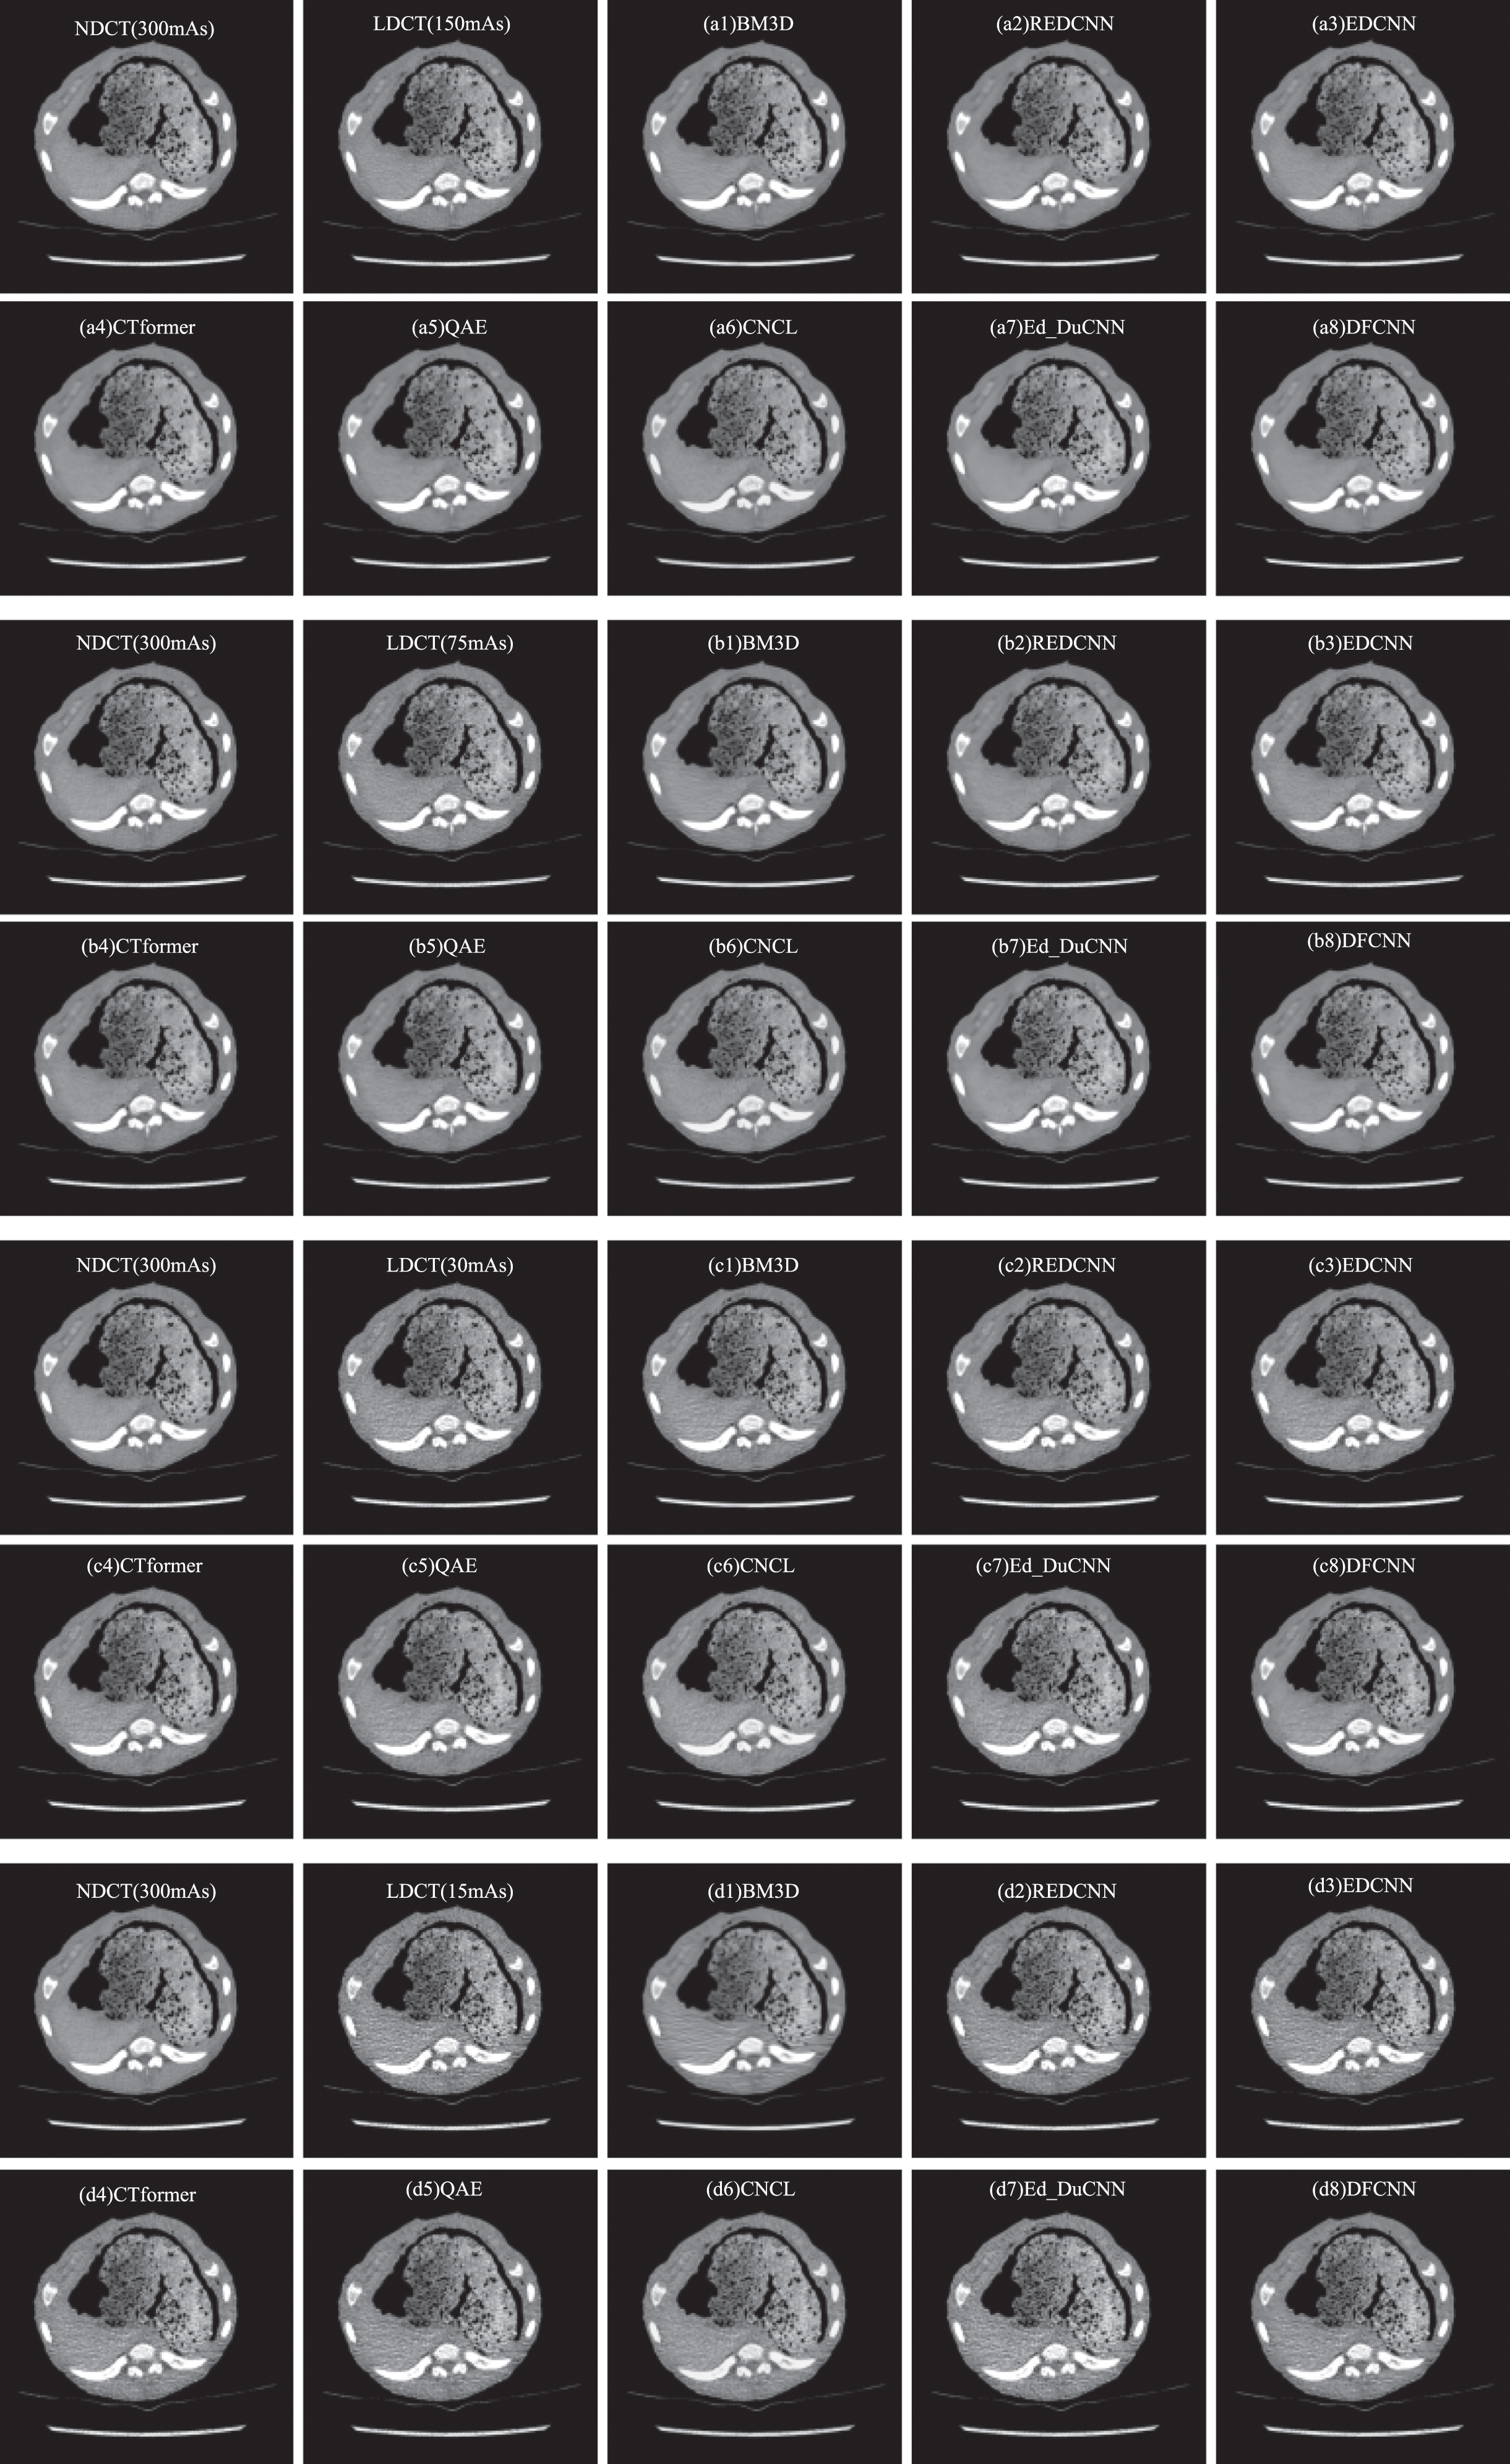
Comparison of images with different processing methods on Piglet dataset.
(2) Quantitative assessment
Table 3 shows the average quantization performance obtained by performing robustness verification experiments on the entire Piglet dataset. The values of the best and the best stimulus are shown in red and blue, respectively. At a dose of 50%, our proposed DFCNN is leading in all indicators. At a dose of 25%, CNCL and Ed_DuCNN have good results on GMSD and PSNR. At 10% and 5% doses, although our method also has a certain effect, the traditional BM3D denoising method reflects its advantages by adjusting the hyperparameters and not limited by the training data set, which is better than the method based on deep learning.
Quantitative results of the different algorithm on piglet dataset
In this section, we conducted ablation experiments on the AAPM dataset and analyzed the effects of all contributions in the DFCNN. In short, this paper presents an LDCT image denoising method in dual-domain. The method in this paper involves the processing of two domains. Finally, the feature maps of the two domains are fused, and a composite loss function is proposed to further improve the image quality. Therefore, to study the hardness of different sub-modules to network performance, the following set of ablation experiments were carried out. ‘w/o DCT domain (whether there is a DCT domain, since most of the denoising networks are performed in the image domain, so we only do ablation experiments on whether there is a DCT domain) ’, ’ w/o combination operation (whether the fusion operation is performed, the general fusion is simply adding the results) ’, ’ w/o compound losses (using the proposed composite loss function instead of L1 loss)’. These three networks are evaluated on the Mayo dataset and compared with the proposed network in terms of quantitative indicators and visual effects. After ablation network to denoising image visual effects and quantitative performance as shown in Fig. 10 and shown in Table 4. Although the overall index is not greatly improved, there is still a certain gap in some minor details. In summary, the proposed improvement strategy has a positive effect on improving the image quality after denoising.
Influence of network structure adjustment on noise reduction performance
Influence of network structure adjustment on noise reduction performance
The complexity of the model is the main problem of LDCT denoising. We compared the trainable parameter number and test time of all methods, which are shown in Table 5. Trainable parameters are those that are updated during backpropagation.
Numbers of trainable parameters, inference times used in the compared models (M: million, s: second)
Numbers of trainable parameters, inference times used in the compared models (M: million, s: second)
Among the model parameters, CNCL occupies the most memory, requiring more than 40 million parameters. This is because CNCL uses two deep learning predictors to learn its own content, while EDCNN has the fewest parameters. Although DFCNN’s memory usage is not minimal, there are several attention modules in the model, which is generally acceptable.

Noise reduction efect of diferent ablation networks on LDCT images.
In terms of test time, EDCNN also has the fastest image processing speed. The velocity of our model is 0.104 s. In general, combined with denoising performance and model efficiency, DFCNN has a certain competitiveness compared with other denoising algorithms.
To suppress the noise and artifacts on CT images caused by reduced radiation dose and few methods consider this problem from the perspective of dual-domain, we propose a method for LDCT image denoising in dual-domain, based on dual-domain fusion Deep Convolutional Neural Network (DFCNN). This method involves two domains: the DCT domain and the image domain. In addition, we use a compound loss function consisting of L1 loss, charbonnier loss and edge loss to achieve good results, while retaining a lot of details and less artifacts, so as to obtain better visual image quality. We conducted comparative experiments on the Mayo dataset and the public Piglet dataset. The results show that the proposed DFCNN achieves an encouraging noise removal while preserving detailed details. In addition, we conducted ablation experiments and verified every improvement of the proposed structure. Although our proposed DFCNN has good noise suppression and detail preservation capabilities, our approach requires participation in pairs of CT images, which are not readily available in practice. We will also try to design the network structure in an unsupervised way and explore the scene of small samples.
Footnotes
Funding
Science and Technology Innovation Project of Colleges and Universities of Shanxi Province (2020L0282). the Open Fund Project of Key Laboratory of Computer Network and Information Integration, Ministry of Education(K93-9-2022-02); the Postgraduate Education Innovation Project of Shanxi Province (2022Y582).
Disclosures
The authors declare no conflicts of interest.
Data availability
Data underlying the results presented in this paper are available in the AAPM Dataset, Ref [44], Piglet Dataset Ref [ ].
].
Acknowledgments
We would like to thank the editors and reviewers for their reviews that improved the content of this paper.