
Abstract
Background
How and where to initiate dialysis are policy challenges with enormous economic and health consequences. Initiating with home hemodialysis (HD) or peritoneal dialysis (PD) may reduce costs and improve outcomes but evidence is conflicting.
Methods
We conducted a population-based study in patients aged ≥ 18 years who initiated chronic dialysis in the province of Ontario, Canada from 2006 to 2014 (N = 12,691) using linked administrative data. Patients were grouped by initial modality: facility HD, facility short daily or slow nocturnal (SD/SN) HD, PD, home HD. We estimated publicly-paid healthcare costs (2015 Canadian dollars; 1 = 0.947 US dollar) and survival, from dialysis initiation to March 2015.
Results
By 5 years after dialysis initiation, mean 30-day costs (as-treated) for patients receiving PD and home HD were 50% and 64% lower, respectively, than for facility HD patients ($11,011). Approximately 50% of costs were unrelated to dialysis, reflecting high comorbidity in these patients. With covariate adjustment, mean 5-year cumulative costs were similar for initiators of home HD and PD ($304,178 and $349,338) and higher for facility HD initiators ($410,981). The highest 5-year unadjusted survival was for home HD patients (80%), followed by PD (52%), SD/SN HD (50%), and facility HD (42%).
Conclusions
This study in a large cohort over 9 years provides new population-based evidence suggesting that initiating dialysis at home is cost-effective, with lower costs and better survival, than starting with facility HD. Survival differences persisted after adjustment for baseline characteristics but we could not adjust for functional status or severity of comorbidities.
Costing studies, however, can be difficult to interpret and compare. Many studies report dialysis-related costs, not the total healthcare costs for this population with complex health needs. Furthermore, most studies include only 1 or 2 modalities (5,10–13) and have short follow-up periods (8,11–14). The aim of this study was to improve the evidence comparing home and facility dialysis modalities. Using a retrospective population-based cohort design, we evaluated costs and survival for up to 9 years in patients initiating chronic dialysis in the Canadian province of Ontario (population 14.2 million).
Methods
This study was approved by the Research Ethics Boards of the University of Toronto and Sunnybrook Health Sciences Centre, Toronto, Canada.
Patients
We selected patients who initiated chronic dialysis at ages 18 to 105 years between 1 April 2006 and 31 March 2014 from the Canadian Organ Replacement Register (CORR) (N = 15,240). The CORR, a pan-Canadian information system for organ failure, collects data from dialysis programs in hospitals and independent health facilities, regional transplant programs, and organ procurement organizations. Patients are tracked from their first treatment to death or loss to follow-up. We excluded patients who had evidence of previous dialysis (N = 2,101), were not Ontario residents or had missing age, invalid sex, or invalid provincial health insurance number (N = 102), or who died within 30 days after dialysis initiation (N = 346). Thus, the study cohort numbered 12,691 patients.
Based on clinical judgement concerning patient and modality characteristics, we classified patients by their initial modality into: 1) facility conventional HD, referred to as ‘facility HD'; 2) facility short daily HD (SD, performed 6 to 7 times per week, for 2 to 3 hours during awake time), or slow nocturnal HD (SN, performed 5 to 7 times per week, for 6 to 9 hours while sleeping), referred to as ‘SD/SN HD'; 3) home HD, including conventional and SD/SN HD; 4) PD, (both continuous ambulatory [57% of PD patients] and automated [43% of PD patients]).
Data and Costs
We conducted our analysis from the perspective of the public payer, the Ontario Ministry of Health and Long-Term Care, which insures all permanent residents of Ontario for medically-necessary care under the publicly-funded Ontario Health Insurance Plan (OHIP). In addition, we included costs paid by chronic kidney disease programs in Ontario, which receive funding from and/or have management agreements with the Ontario Renal Network through the publicly-funded agency Cancer Care Ontario. We were unable to include costs for patients’ travel to dialysis clinics for dialysis or other medical care, because these are not readily available in the administrative data.
Healthcare resources included inpatient hospitalizations, including mental health facility stays, emergency department visits, outpatient laboratory and diagnostic tests, imaging tests, day surgery, hospital ambulatory clinics (including dialysis and cancer clinics), physician services (including those paid under capitation) (15), home care, outpatient prescription drugs (for those older than 65 years or on social assistance, and including drugs funded under special programs or with limited use), and medical devices and supplies (including diabetic monitoring equipment). We also included stays in facilities for rehabilitation, complex continuing care, and long-term care. All databases were linked using unique encoded patient identifiers and analyzed at the Institute for Clinical Evaluative Sciences in London, Ontario. We followed economic guidelines (16) and used standard methods to estimate patient-level costs in administrative data (17–19) (Supplemental Table 1).
Baseline Characteristics of Patients Who Initiated Chronic Dialysis 1 from April 2006 to 31 March 2014
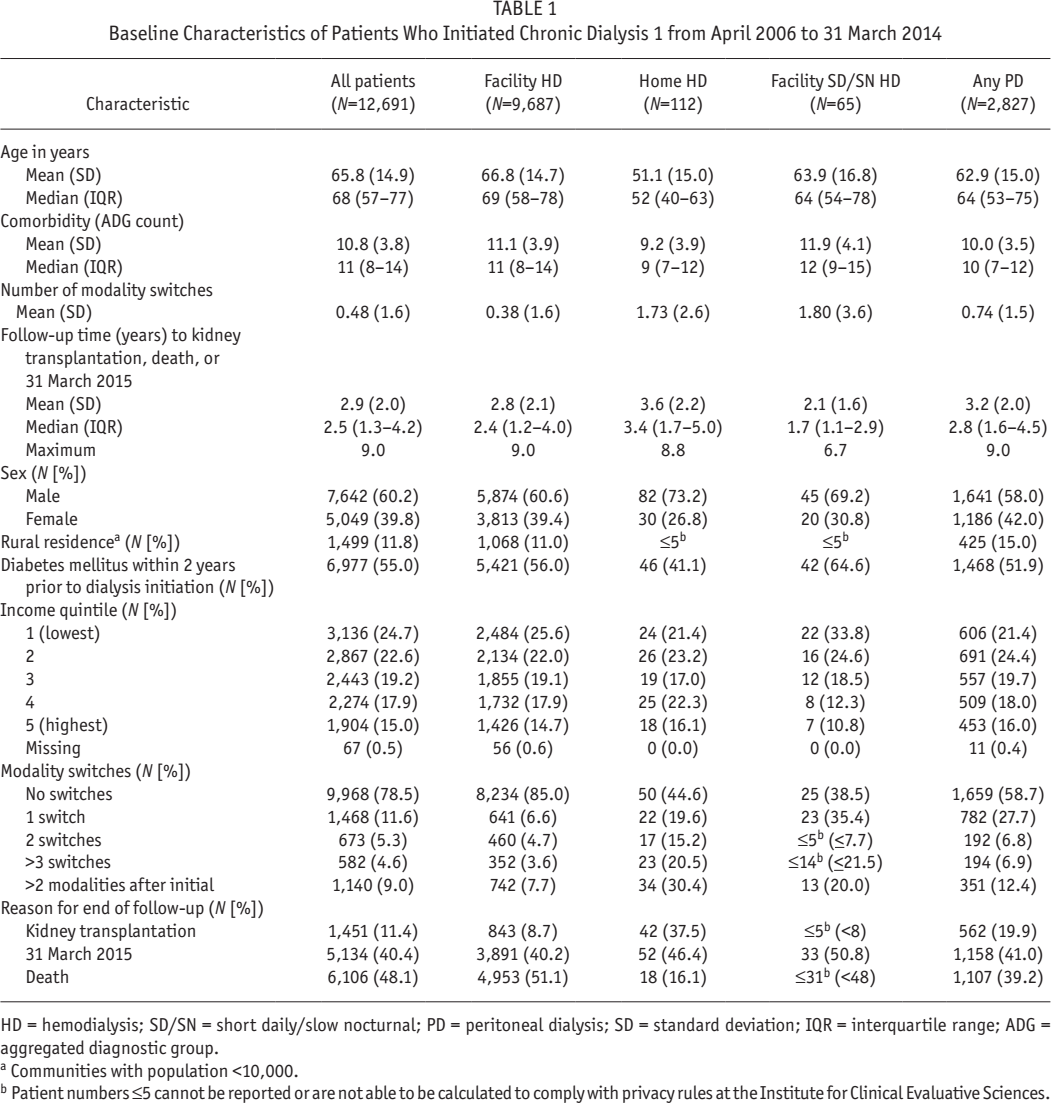
HD = hemodialysis; SD/SN = short daily/slow nocturnal; PD = peritoneal dialysis; SD = standard deviation; IQR = interquartile range; ADG = aggregated diagnostic group.
Communities with population <10,000.
Patient numbers ≤5 cannot be reported or are not able to be calculated to comply with privacy rules at the Institute for Clinical Evaluative Sciences.
We included costs related to dialysis and other health problems. However, the costs of dialysis machines and equipment, and maintenance in patients’ homes, are not included in the administrative data. They are not funded through OHIP but are publicly-funded through the Ontario Renal Network. We estimated that a conventional HD machine costs $30,000 and lasts approximately 8 years, and added $3,750 annually to the costs of each patient on home HD. In dialysis centers, 1 machine is used by an average of 5 patients (personal communication PB); thus, we estimated the annual cost to be $750 per patient on facility HD. We estimated costs for home HD installation and maintenance, including electrical and plumbing requirements, water tests, and filters to be $2,115 1-time initially, and $3,114 annually thereafter, based on the Ontario Renal Network funding guide (20). The Ontario Renal Network also funds machines and solutions for PD. We added these costs to patients using automated PD ($37,281 per year) and continuous ambulatory PD ($28,232 per year) (20). Training for home dialysis, and follow-up visits for all patients, took place in dialysis clinics and are captured in the National Ambulatory Care Reporting System data (Supplemental Table 1).
All costs were adjusted to 2015 Canadian dollars (CAD) using the Statistics Canada Consumer Price Index for healthcare in Ontario (21). Canadian dollars can be converted to US dollars using the 2015 Purchasing Power Parity for health (0.947) (22).
Patient Characteristics
We described comorbidity using the Adjusted Clinical Group population/patient case-mix adjustment system (23). We categorized all ICD-9/ICD-9CM and ICD10 diagnostic codes in hospital records and physicians’ billing data in the 2 years prior to dialysis initiation into 1 of 32 Aggregated Diagnostic Groups (ADGs) on the basis of clinical similarity, chronicity, likelihood of requiring specialty care, and disability, and summed them to obtain a quantitative measure of comorbidity for each patient (24).
We used the Statistics Canada Postal Code Conversion file and data from the 2001 Canadian Census to determine neighborhood-level median household income, measured in quintiles, and rurality of residence. Communities with a population below 10,000 were defined as rural.
Statistical Analysis
Costs per 30 days by initial dialysis modality
We investigated cost trajectories by estimating mean healthcare costs for each modality group in each 30-day period from dialysis initiation to death, kidney transplantation, or end of follow-up (31 March 2015). This intent-to-treat analysis was based on initial dialysis modality, and the costs associated with it and with any subsequent modalities were assigned to the initial modality to determine the overall cost implications of starting dialysis with that modality. In a second analysis, we censored patients at their first modality switch to observe costs for the time on the initial modality. Only patients who were alive and incurred a cost in each 30-day period were included in the calculations of crude mean costs. Therefore, the number of patients contributing to mean cost estimates decreased over time due to death and censoring.
Costs per unit time by dialysis modality (as-treated)
We also estimated the rate of cost accumulation for each dialysis modality, whether initial or subsequent. Analyses in patients who died before 31 March 2015 indicated that the high costs of end-of-life care became apparent 90 days before death (data not shown). Because we wanted to estimate dialysis costs exclusive of end-of-life care, even renal-related, patients who died were censored 90 days before death.
We followed a linear mixed effects regression approach where monthly costs were the longitudinal dependent variable and different combinations and transformations of the covariates age, sex, comorbidity, modality group, and modality switch were employed. Interactions between time and modality switch were introduced to capture the effect of switches on the pattern of cost accumulation. A random intercept was used to capture the correlation across observations within patients. We explored 14 different fixed and random effects regressions to determine the most appropriate model structure (25,26). Model 1 did not include time, Models 2 to 4 explored different functional forms of the effect of time on the rate of costs (linear, second order polynomial, and logarithmic), and models 5 – 7 explored the interaction between time and modality based on transformations in models 3 and 4. Models 8 – 14 were random effects models specified with similar parameters to models 1 – 7. Diagnostic tests were performed to inform model selection. Histograms of the residuals and Kolmogorov-Smirnov tests were used to assess the assumption of normality. Goodness-of-fit was assessed with the Akaike information criterion (AIC) (27), where a smaller AIC indicates a better fit. Models were fitted using the lmer function from the lme4 R package (28).
Cumulative costs
We estimated cumulative costs for 1 year, 2, 5, and up to 7 years after dialysis initiation for each patient, by initial dialysis modality. We used inverse probability weighting to account for censoring (29) and censored patients at kidney transplantation or end of follow-up. After death, patients incurred no costs. In this analysis, modality switches were disregarded and the costs associated with the initial modality, and with any subsequent modalities, were assigned to the initial modality because we were interested in differences in cumulative costs between strategies of dialysis initiation.
We also estimated adjusted cumulative costs using propensity scores (30). In this approach, the outcome variable is regressed on an indicator variable denoting treatment status and the estimated propensity score. The propensity score included sex, age, and ADG count at baseline. Reference values were male sex, median age (68 years), and median number of ADGs (n = 11) of the full cohort.
Survival
We estimated survival by initial dialysis modality with death as the event of interest. We disregarded modality switches, and censored patients at kidney transplant and end of follow-up. We generated unadjusted Kaplan-Meier survival curves, and also used a Cox proportional hazards model adjusting for age, sex, and comorbidity (ADG count). The assumption that the proportional hazards were constant over time was assessed visually through the survival curves and found to be satisfied (31). A survival estimate was calculated for each patient based on his/her observed covariates. Analyses were conducted using SAS version 9.4.
Results
Patients
Table 1 describes the baseline characteristics of the patients. Most patients initiated facility HD (N = 9,687; 76%) or PD (N = 2,827; 22%); 112 (0.9%) initiated home HD; and 65 (0.5%) initiated short daily or slow nocturnal (SD/SN) HD. Overall, 78.5% did not switch from their initial modality group. By the end of follow-up, 1,451 patients (11.4%) received a kidney transplant and 6,106 (48.1%) died. The mean follow-up time for all patients was 2.9 years.
Costs per 30 Days from Dialysis Initiation Onwards by Initial Modality
Unadjusted mean 30-day costs for all healthcare, from dialysis initiation to death, kidney transplantation, or end of follow-up, were higher for patients who initiated facility HD than for those who initiated home HD or PD over the entire time period. The mean costs for facility HD patients were $24,546 in the first 30-day period, and gradually decreased to approximately $10,200 per 30 days by 1 year. Mean costs for patients who initiated home HD were $15,273 in the first 30-day period, $9,633 in the second, and approximately $6,000 to $7,000 per 30 days thereafter. Mean costs for patients who initiated PD ranged from approximately $6,500 to $8,500 per 30 days over all periods. A few patients who initiated facility SD/SN HD had very high costs, and the mean 30-day costs were $34,728 in the first 30-day period, decreasing to approximately $12,000 by 12 months.
Supplemental Table 2 shows the mean costs per resource for patients who initiated home HD, facility HD, or PD. We estimated that in the first 30-day period only 20% of the total cost for facility HD was for dialysis equipment and dialysis clinic visits, compared with 77% for home HD and 50% for PD (Supplemental Table 2). After the first 60 days of dialysis, approximately 50% to 60% of total healthcare costs were for dialysis equipment and dialysis clinic visits for all 4 modality groups.
Cumulative Costs by Initial Modality Group, Disregarding Modality Switches, Unadjusted and Adjusted for Covariates
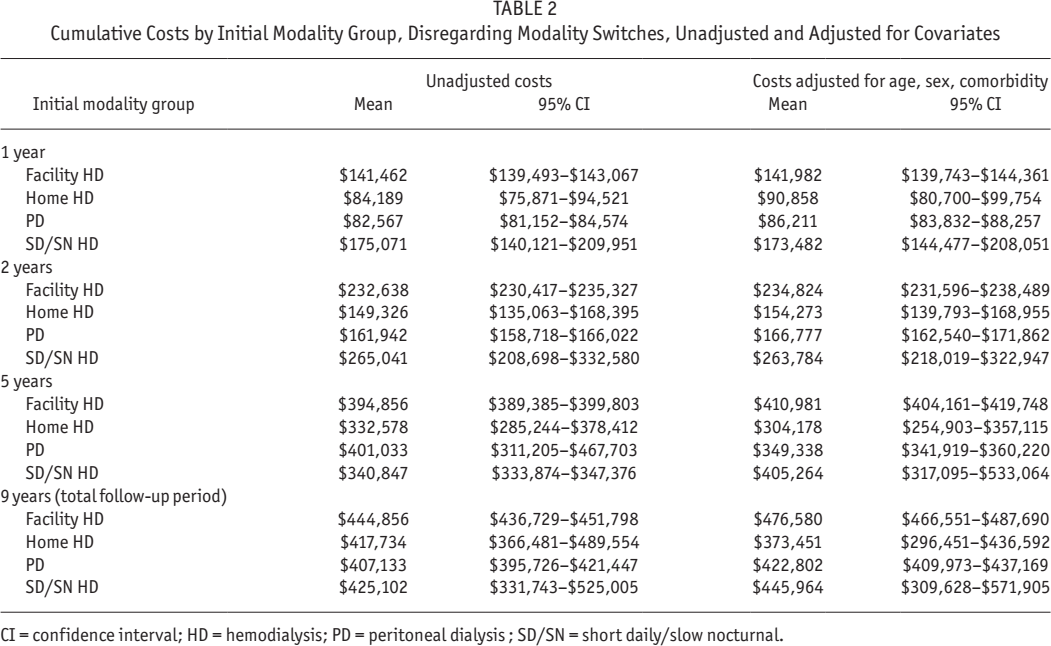
CI = confidence interval; HD = hemodialysis; PD = peritoneal dialysis; SD/SN = short daily/slow nocturnal.
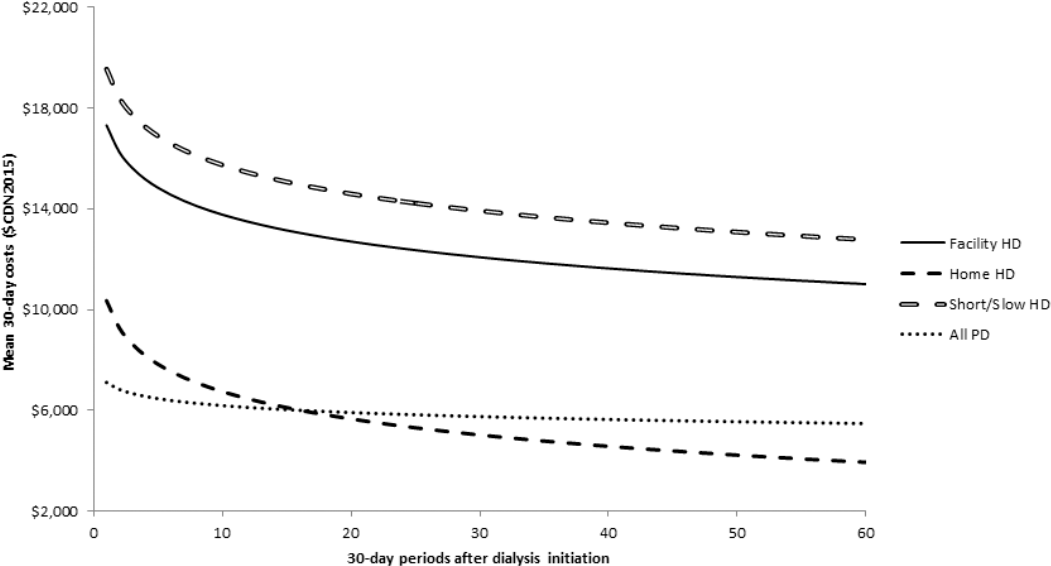
Figure 1 shows the mean unadjusted costs per 30-day period for the first 5 years after dialysis initiation, with censoring at modality switch, kidney transplantation, end of follow-up, or death. The trends described above were more apparent when only time on initial dialysis modality was included. High startup costs were particularly evident for patients who initiated facility HD, perhaps due to some unplanned starts which we were unable to identify, but high start-up costs were also seen for the home modalities. The pattern of costs over time suggests that the high costs associated with facility HD endured long after any effects of unplanned starts. After the first 360 days, costs for patients who initiated facility HD stabilized at approximately $10,000 to $11,000 per 30 days, whereas ongoing costs for patients who initiated home HD (approximately $4,000 to $5,000) and PD (approximately $6,000 to $7,000) were lower.

Mean 30-day costs of chronic dialysis from initiation to modality group switch, death, kidney transplantation, or maximum follow-up (31 March 2015) in patients who initiated dialysis 1 April 2006 to 31 March 2014. The first 5 years (60 30-day intervals) are graphed. HD = hemodialysis; SD/SN = short daily/slow nocturnal; PD = peritoneal dialysis.
Cost per Unit Time by Modality (As-Treated)
We examined the goodness of fit of 7 fixed effects and 7 random effects models for 30-day costs (see statistical analysis). Based on the AIC (27), the random effects models provided better fits than the fixed effect models. The best fit was with the random effects model that used the modality by log-time interaction as a covariate (Model 14, in Supplemental Appendix 1). In this model, the effect of log-time on the cost accumulation rate was assumed to be different across all 4 modalities.
Figure 2 shows the results of this model. Mean costs for home HD and PD (as-treated) were approximately $10,350 and $7,100, respectively, during the first 30 days, decreasing to less than $7,000 at month 12, compared with $17,300 (month 1) and $13,500 (month 12) for facility HD. By month 60, mean 30-day costs were $3,936 for home HD and $5,475 for PD, compared with $11,011 for facility HD. Our best estimate of the rate of cost accumulation suggests that adjusted total healthcare costs for PD and home HD, for all patients receiving that dialysis modality, adjusting for modality switches and excluding costs associated with death, are approximately 40% – 45% of the costs for facility HD.
Model 14 showing rate of change of 30-day cost accumulation for each modality group. HD = hemodialysis; PD = peritoneal dialysis.
Cumulative Costs
Mean cumulative total direct medical cost estimates were generated based on the fitted models, unadjusted and adjusted for demographic and clinical variables as described in the statistical analysis section. Consistent with the results of the 30-day costs, patients initiating home HD and PD had much lower costs than patients initiating facility HD. Unadjusted first-year costs were $82,567 for PD, $84,189 for home HD, and $141,462 for facility HD (Table 2). By 5 years, the mean unadjusted costs ranged from $332,578 for home HD to $401,033 for SD/SN HD.
The same trends were apparent with adjustments for age, sex, and comorbidity (Table 2). The cumulative cost difference between facility HD and home dialysis modalities increased with time ($51,000 to $56,000 difference at 1 year, $62,000 to $107,000 difference at 5 years). Marginal cost differences across modalities were attenuated over time because higher survival rates among patients who initiated PD and home HD increased cumulative costs.
Survival
Survival differed substantially across modality groups. The home HD patients had the highest unadjusted survival, with 80% surviving 5 years after dialysis initiation (Figure 3). Approximately 52% of the PD patients survived 5 years after initiation. The 5-year survival rates were 50% and 42% for patients who initiated facility SD/SN HD and facility HD, respectively.
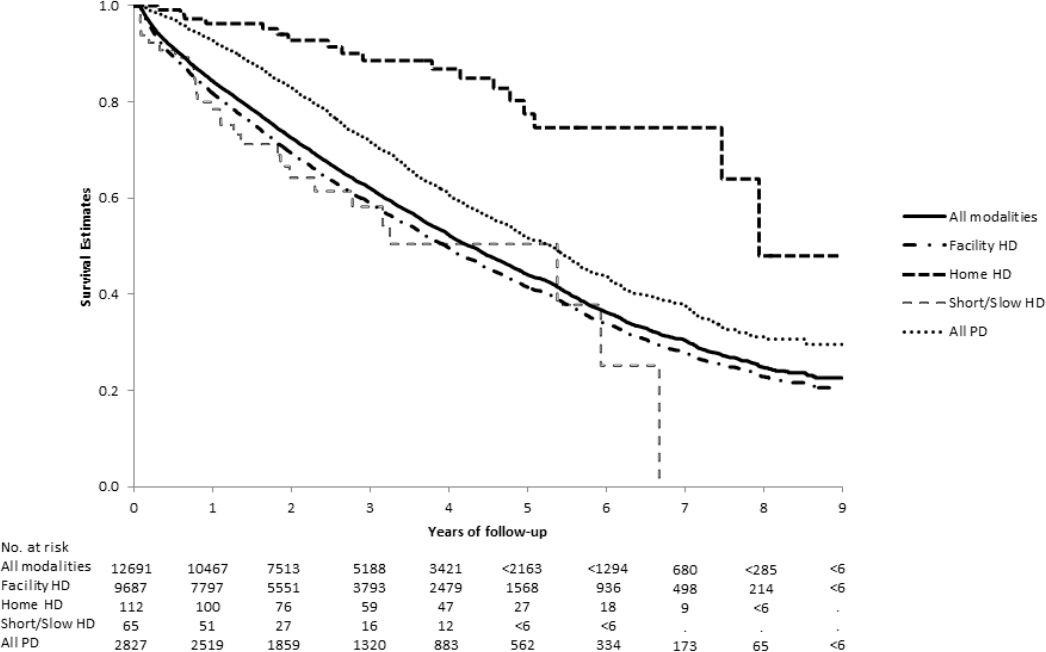
Unadjusted Kaplan-Meier survival curves for all patients by initial modality, censoring at kidney transplantation or end of follow-up, but including modality switches. HD = hemodialysis; PD = peritoneal dialysis.
The Cox proportional hazards model showed that increased age and comorbidity (ADG count) statistically significantly increased the risk of death. The parameter estimates were 0.039 for age and 0.66 for comorbidity (both p < 0.0001). Female sex significantly reduced the risk of death (parameter estimate -0.064, p = 0.015). The adjusted 5-year survival rates were 65% and 46% for patients who initiated home HD and facility HD, respectively. The hazard ratios (versus facility HD) were 0.44 (95% profile likelihood confidence interval [CI] = 0.27 – 0.68) for home HD, and 0.80 (95% profile likelihood CI = 0.75 – 0.85) for PD.
Discussion
Many jurisdictions are attempting to increase the use of home dialysis. However, the evidence for its advantages is complex and often controversial. Our population-based analysis suggests that initiating home dialysis may represent the most cost-effective strategy.
Our primary analysis compared the strategies of initiating dialysis with each modality rather than comparing modalities. Critically, the primary analysis was not censored at modality switches. This design, analogous to an ‘intent to treat’ study, is relevant to payers, healthcare providers, and other stakeholders because initial modality can be selected. Therefore, our study addresses the important question of which modality for dialysis initiation is associated with the lowest costs and longest patient survival. However, our analysis of the rate of cost accumulation for each dialysis modality, as-treated and whether initial or subsequent, also found that the costs of PD and home HD were much lower than other modalities.
Our study shows that initiating dialysis with home modalities not only costs less but appears to improve survival. Previous studies reported conflicting results and used various designs and patients (32 33 34 35-36). This raises the question of whether reported survival differences reflect underlying selective case mix advantages for those initiating home modalities. We found that survival differences persisted after adjustment for baseline demographics and comorbidity but we were unable to adjust for functional status or severity of comorbidities.
Our results indicate that the total costs of dialysis care are high. The mean direct healthcare costs to the public payer were approximately $140,000 in the first year after initiating facility HD. This is more than 30 times the average Ontario per capita public health expenditure ($4,362) (37) and places dialysis patients above the 1% threshold ($44,900) for high-cost users (38). The mean first-year cost of care for dialysis patients is substantially higher than for adults with cancer ($26,000) (18), heart failure ($28,000) (39), or late-stage liver disease ($11,000) (40).
Previous studies often included only dialysis-related costs, reported costs in a variety of currencies, and rarely compared all modalities. Two Canadian studies reported mean annual costs (2012 CAD) for facility HD of approximately $78,000 (8) and $89,000 (14). Studies from the US estimated annual costs for facility HD ranging from approximately $109,000 to $147,000 (2012 CAD; adjusted for inflation and purchasing power parity) (5,10,11).
Our adjusted analysis of the rate of cost accumulation indicated that cumulative costs over up to 5 years were substantially lower among patients receiving home HD or PD than among patients who received facility HD. This is consonant with previous work which showed that PD (3,8) and home HD (3,5,7,9) cost less than facility HD. Interestingly, our study also suggests that because patients receiving home HD and PD have longer survival than those receiving facility HD, cumulative cost savings from a system perspective may be smaller than expected.
Our study has several strengths. It provides comprehensive estimates of the costs for all care provided in hospitals, outpatient clinics, and at home borne by a public health system for a population-based cohort of patients initiating dialysis over a period of 8 years. We included the high costs of initial dialysis care and followed patients for up to 9 years. We believe that our findings are generalizable to other Canadian provinces, the US, and many developed countries with similar options for dialysis (1). We were unable to include costs for patient travel, or other out-of-pocket costs for patients, as these are not readily available in administrative data.
We applied rigorous statistical methods in the survival and costs analyses. Two modality groups, facility SD/SN HD and home HD, had very few patients. The covariate adjustments, in both the survival and costs analyses, may not have been sufficient to control for the dissimilarities among the 4 modality groups. Also, administrative data provide large numbers of patients and long follow-up periods but have little information regarding functional status, patient preferences, or other factors that could determine choice of initial and subsequent dialysis modality (41 42-43), costs, and outcomes, including survival. Our study lacked quality-of-life data so it does not provide health utility values for cost-utility analyses. Also, we were unable to define dialysis starts as sub-optimal, unplanned, or late using administrative data, and these terms and their criteria differ in the literature (44,45). The type of start and the choice of initial and subsequent modes of dialysis may depend on observed and unobserved variables and covariates not accounted for in our analyses of costs and survival. However, our unadjusted results provide real-world estimates of costs and survival for patients receiving dialysis.
In conclusion, our study examined both costs and survival in a single large population-based cohort of patients followed over 9 years and found lower costs and better survival with home HD and PD than facility HD. Although our study was not a randomized controlled trial and we cannot account for unmeasured baseline differences between patients, it provides new real-world population-based economic and prognostic evidence in favor of initiating dialysis with home HD or PD.
Footnotes
Acknowledgments
This study was funded by the Ontario Renal Network, Ontario, Canada. Dr. Krahn was supported by the F. Norman Hughes Chair in Pharmaco-economics at the University of Toronto, and a Tier 1 Canada Research Chair in Health Technology Assessment. Dr. Garg was supported by the Dr. Adam Linton Chair in Kidney Health Analytics.
Infrastructure support was provided by a Canada Foundation for Innovation Grant (THETA), and the Toronto General Hospital Research Institute. Some analyses were conducted at the Institute for Clinical Evaluative Sciences (ICES) Western site. The ICES is funded by an annual grant from the Ontario Ministry of Health and Long-Term Care (MOHLTC). ICES Western is also supported by the Academic Medical Organization of Southwestern Ontario (AMOSO), the Schulich School of Medicine and Dentistry (SSMD), Western University, and the Lawson Health Research Institute (LHRI). The opinions, results and conclusions are those of the authors and are independent from the funding sources. No endorsement by funding bodies should be inferred.
Parts of this material are based on data and information compiled and provided by the Canadian Institute for Health Information (CIHI). However, the analyses, conclusions, opinions, and statements expressed herein are those of the authors, and not necessarily those of CIHI.
The results of a preliminary analysis of this study were presented as a poster at the Annual Meeting of The Canadian Association for Population Therapeutics, October 17 to 18, 2016, in Toronto. Ontario, Canada. An abstract is published in Journal of Population Therapeutics and Clinical Pharmacology; 23(![]() ):e204–e230 (Abstract 22 on page e215).
):e204–e230 (Abstract 22 on page e215).
Also, parts of this paper were presented as a poster at the ISPOR Asia Pacific conference in Tokyo, Japan, September 8–11, 2018. The abstract is published in Value in Health 2018; 21(Suppl 2):S115.
The authors have no financial conflicts of interest to declare.