
Abstract
Purpose
To evaluate the integrity of macular and temporomacular vasculature in nonproliferative diabetic retinopathy (NPDR) with noninvasive optical coherence tomography angiography (OCTA) and correlate perfusion indices with degree of NPDR.
Methods
In this prospective observational cross-sectional study, 102 eyes with newly diagnosed NPDR (mild NPDR, 36; moderate NPDR, 21; severe NPDR, 13; NPDR with diabetic macular edema [DME], 32) underwent OCTA. Sixty eyes of normal subjects served as control. Degree of NPDR (based on Early Treatment Diabetic Retinopathy Study criteria) was confirmed with fluorescein angiography. Automated OCTA/split-spectrum amplitude decorrelation angiography software generated perfusion indices (vessel density and flow index) from images of the retina. The perfusion index of superficial and deep retinal plexuses was obtained in both perifoveal (central 1-3 mm) and parafoveal (3-6 mm) areas.
Results
Deep plexus parafoveal vessel density was 25.23% (±6.1) in mild NPDR, 20.16% (±6.16) in moderate NPDR, 11.16% (±4.16) in severe NPDR, and 17.91% (±4.42) in NPDR + DME compared to normal subjects (36.93% [±8.1]; (p<0.01). Spearman correlation coefficient (rs) between vessel density and level of NPDR severity in the parafoveal region showed inverse correlation for both superficial (rs -0.87; p = 0.083) and deep (rs -0.96; p = 0.017) plexus. Similarly, when vessel density of the perifoveal region was compared with level of NPDR severity, inverse correlation was noted in both superficial (rs -0.85; p = 0.08) and deep (rs -0.98; p = 0.011) plexus.
Conclusions
Optical coherence tomography angiography clearly delineated the retinal microcirculation and allowed quantification of vascular perfusion of each layer. As diabetic retinopathy progressed, a decrease in perfusion index is more pronounced in the deep retinal plexus and precedes changes in superficial plexus.
Keywords
Introduction
Diabetic retinopathy (DR) is the most frequent microvascular complication of diabetes mellitus and the most common cause of blindness in the working-age population (1). Diabetic maculopathy and complications of proliferative DR (PDR) such as vitreous hemorrhage, tractional retinal detachment, and neovascular glaucoma are the leading causes of vision loss in DR. The clinical grading of nonproliferative DR (NPDR) is guided by Early Treatment Diabetic Retinopathy Study (ETDRS) grading scheme and consists of mild, moderate, and severe NPDR and non-high-risk and high-risk PDR (2, 3). The International Clinical Diabetic Retinopathy and Diabetic Macular Edema Severity Scale simplified grading by stratifying DR into 5 levels based on observed retinal changes (4).
Outer layers of retina and the foveal avascular zone (FAZ) are supplied by the choriocapillaries and the inner layers derive nutrition from the superficial and deep capillary network formed from the branches of central retinal artery and vein (5). Basement membrane thickening, a hallmark of DR, is the result of increased deposition of collagen type IV, laminin, and fibronectin in basement membrane (4). With the progress of the disease, vessel lumen narrows and leads to capillary dropout and retinal ischemia with edema. Microaneurysm and associated dot blot hemorrhage, noted in deeper retinal venular capillary plexus, is the earliest change of DR and precedes dysfunction of the superficial network (6).
Fundus fluorescein angiography (FFA) is commonly used to evaluate the integrity of major capillary networks in DR; however, the images of the superficial capillaries overlap deep capillary circulation and do not allow separate distinction between the 2 networks. Decrease in deeper capillary network perfusion may happen before it becomes evident on fluorescein angiography and precedes the development of DR.
Recently, optical coherence tomography (OCT)–based angiography has been developed to evaluate 3D noninvasive vascular mapping of retinal vasculature (6). The use of the split-spectrum amplitude decorrelation angiography (SSADA) algorithm (7) improves the signal-to- noise ratio of OCT angiography (OCTA) and facilitate objective distinct metric evaluation of both superficial and deep capillary plexus (8–9–10–11).
In this study, we evaluated the integrity of retinal vascular complex in NPDR with noninvasive SSADA-assisted OCT angiography and correlated perfusion indices with degree of NPDR.
Methods
This was a prospective, consecutive, cross-sectional observational study evaluating a new diagnostic tool for OCTA (RTVue XR Avanti; Optovue Inc., Fremont, CA, USA). The study adhered to the tenets of the declaration of Helsinki. The protocol was approved by the institutional review board and informed consent was obtained from all subjects participating in the study. Subjects were characterized based on retinopathy status and assigned to one of the NPDR groups. Patients with mild NPDR had ETDRS levels of 20-35, ETDRS levels 43-47 were classified as moderate NPDR, and patients with level 53 were classified as severe NPDR (4). A total of 102 eyes of 102 patients with newly diagnosed NPDR with or without diabetic macular edema (DME) with varying severity were included in the study. Of these, 36 eyes had mild NPDR, 21 eyes had moderate NPDR, 13 eyes had severe NPDR, and 32 had NPDR with DME. The initial evaluation included best-corrected visual acuity (BCVA) measurement, applanation tonometry, slit-lamp biomicroscopy, and fundus examination. Nonproliferative DR was diagnosed based on the standard clinical criteria described previously (2–3–4) and confirmed with FFA. Grading of NPDR was done by 2 blinded certified retina specialists using standard ETDRS guidelines (4). A flash-based fundus camera (FF 450 plus IR Fundus Camera with VISUPAC™ Digital Imaging System, Zeiss, Germany) was used to obtain standard ETDRS 7-field fundus photographs. Severity of DR was graded based on 7-field fundus photographs. Diagnosis of DME was based on clinical criteria described previously (4, 12) and confirmed with the use of OCT (Spetcralis® HRA-OCT, Heidelberg, Germany). Patients with uncontrolled glaucoma, vision loss due to other ocular causes, systemic diseases (such as hypertension) that might have bearing on the retinal/choroidal vasculature, or inability to fixate, and those with poor media clarity were excluded from inclusion in this study. Sixty eyes of 60 normal subjects (right eyes) served as controls. All the normal eyes had BCVA of 20/25 or better with no known evidence of ocular or systemic pathology that could have affected the retinal vasculature.
Optical coherence tomography angiography
RTVue® XR Avanti (Optovue Inc.) with A-scan rate of 70,000 scans per second, using a light source centered on 840 nm and a bandwidth of 50 nm, was used to obtain OCTA. The tissue resolution was 5 mm axially with a beam width of 15 mm.
Image acquisition
Two sets of imaging are performed at 1 assessment. Each image set comprised 2 raster volumetric patterns (1 vertical priority and 1 horizontal priority) covering 6 × 6 mm. An orthogonal registration algorithm (built-in software, which has the ability to correct some motion artifacts) is used to produce merged 3D OCT angiograms. Each volume was composed of 216 line scan locations, at which 5 consecutive B-scans were obtained. The results of 2 sets of images obtained were averaged using built-in software.
Split-spectrum amplitude decorrelation angiography
The SSADA algorithm compares the consecutive B-scans obtained at the same location to detect the blood flow in vessels using motion contrast (7–8–9–10). After processing of the volume scans, decorrelation of the images (1 – correlation) was calculated. The imaging characteristics of the scan, for stationary tissues, showed a high correlation from one frame to the next. However, imaging characteristics for blood flowing through vessels change reflectance over successive scans, causing a low correlation between frames (or a high decorrelation). The resultant correlated frames were evaluated and statistical outliers were removed to reduce the possibility of tissue-motion artifacts. Furthermore, the spectrum of the light source is split into 4 components to decrease the noise present in the image and each component is then used to perform the decorrelation step separately. Finally, the results of all 4 components are averaged and a block of information is generated that contains the levels of decorrelation (ranging from 0 to 1). This split-spectrum strategy traded some of the axial resolution for decreased noise for higher transverse resolution.
Segmentation and perfusion indexes of OCTA images
Segmentation of the retina in specific layers allowed en face visualization of the corresponding vascular supply for that layer. Built-in automated software processed the image information generating sets of perfusion indices (vessel density and flow index) for 4 en face sections of the retina. Vessel density was defined as percentage area occupied by vessels in the segmented area and flow index (FI) was defined as the average decorrelation values in the segmented area. Data were obtained for all 4 en face zones (superficial plexus [capillary network in ganglion cell layer]; deep plexus [network of capillaries between the outer boundary of the inner plexiform layer and the midpoint of the outer plexiform layer (total thickness about 55 μm)]; outer retina [photoreceptors]; and choriocapillaries [choroid] with offshoot of 30 μm). For each of the en face zones, the software acquired perfusion indices separately in parafoveal (central 3 mm) and perifoveal (between central 3 and 6 mm) areas (Fig. 1, A–B–C–D–E–F–G–H–I–J–K–L).
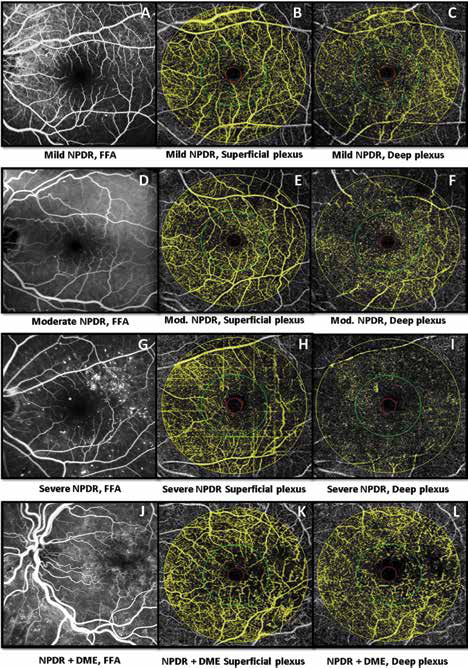
Fundus florescence angiography and corresponding optical coherence tomography angiography of superficial and deep plexus in various nonproliferative diabetic retinopathy (NPDR) subgroups. (
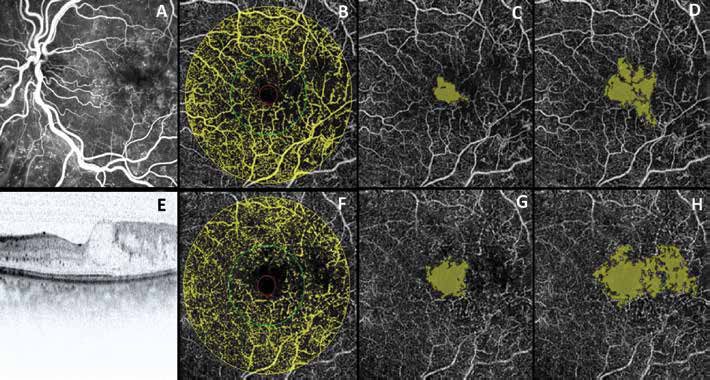
The central 1 mm area (also known as FAZ) was excluded from the analysis (Fig. 2, A–B–C–D–E–F–G–H). Values for FAZ area (mm2) were obtained in the central area using the built-in software. Out of the 4 en face zones, the perfusion indices of superficial and deep retinal plexus were included in this study and the scanning area captured in our study was 6 × 6 mm sections centered on the fovea (Fig. 3).
Conventional fundus fluorescein angiography (
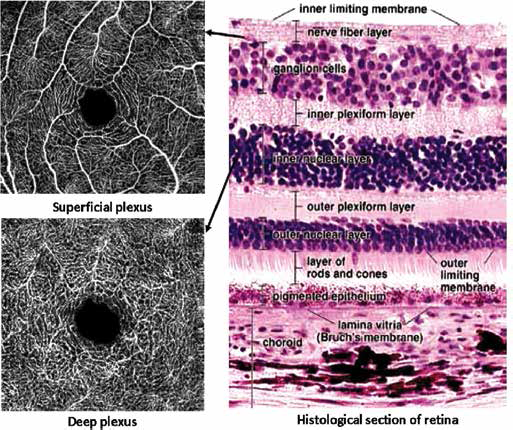
The location of superficial (right top image) and deep plexus (right bottom image) in relation to inner retinal layers on a histologic section of retina (left image). Optical coherence tomography angiography is capable of imaging the retinal capillary network in various retinal layers as shown.
Usually, images obtained by OCTA have minimal motion artifacts. In this study, patients with poor quality images (with a signal strength index ≤40) and registered image sets with residual motion artifacts (substantial discontinuous vessel pattern or hazy images) were excluded from the analysis. Images with compromised automated retinal segmentation were also excluded from the study.
Statistical Analysis
GraphPad InStat v.3 (San Diego, CA, USA) was used for statistical analysis. Mean, standard deviation (SD), and median were calculated for vessel density and FI in superficial and deep plexus. Before applying the respective statistical tests, data were evaluated for normal distribution (D'Agostino K2 test). Unpaired Student t test was used to compare perfusion indices (vessel density and FI) of the superficial and deep plexus. Additionally, the same test was used to compare perfusion indices for the parafoveal and perifoveal regions. One-way analysis of variance test was used to compare the mean values of vessel density and FI in the various zones of NPDR subjects. The NPDR subjects (graded according to their severity) were also compared to normal subjects. Linear correlation plots were drawn to measure the strength and the direction of a linear relationship between the levels of severity of DR and perfusion indices. Spearman rank correlation coefficient (rs) was used to assess the relationship between levels of severity of DR and perfusion indices.
Results
A total of 137 eyes of 137 diabetic patients with NPDR were assessed initially for image quality after they met inclusion and exclusion criteria described in Methods. Thirty-five of the total 137 eyes were excluded from this study due to residual motion artifact and/or compromised retinal segmentation. Baseline demographics of the entire cohort were comparable in all 3 groups and are summarized in Table I. Of the 102 patients, 40 (39.2%) were male and 62 (59.8%) were female. The patients were classified into 4 groups based on the severity of their NPDR. The age range for our NPDR cohorts was 22-81 years and controls ranged from 21 to 70 years of age. Most of the NPDR subjects (56.8%) were African American, followed by Caucasian (33.3%), and the remaining (9.9%) were Asian. The NPDR patients with DME had the lowest BCVA values (ranging from 20/25 to 20/80) (Tab. I).
Baseline demographics of the study subgroups
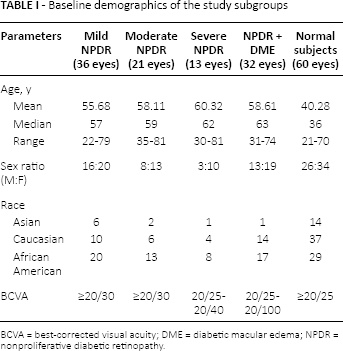
BCVA = best-corrected visual acuity; DME = diabetic macular edema; NPDR = nonproliferative diabetic retinopathy.
Patients with mild NPDR had ETDRS levels of 20-35, features of ETDRS levels 43-47 were classified as moderate NPDR, and patients with ETDRS level 53 were classified as severe NPDR (4). Normal subjects had ETDRS grading of 10. For statistical analysis, all mild NPDR subjects were graded as level 35, moderate NPDR patients were graded as level 42, subjects with NPDR + DME were labeled as level 47, and those with severe NPDR were labeled as level 53. The interrater agreement between 2 blinded graders for DR was excellent (0.86).
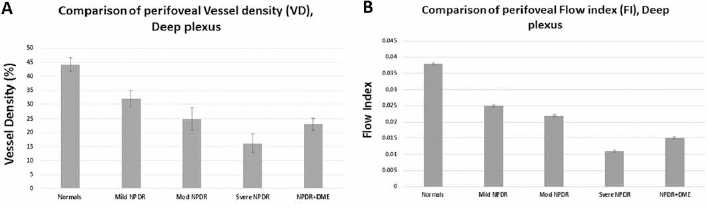
We noted a decreased perfusion index with increase in the severity of DR and this was predominant in the deep perifoveal plexus region (Tab. II, Fig. 4). The data in this study were found to have normal distribution. It is possible that one layer is affected differently from the other and the deeper capillary compromise may be more profound or selective depending on the stage of DR.
Means of the vessel density and the flow index of the deep perifoveal zone among the normal and the NPDR subgroups, showing the decreasing trend with increase in severity
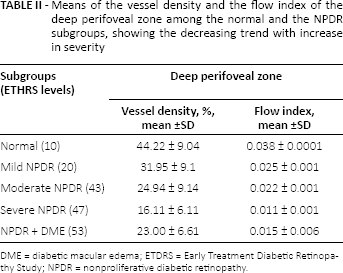
DME = diabetic macular edema; ETDRS = Early Treatment Diabetic Retinopathy Study; NPDR = nonproliferative diabetic retinopathy.
Flow chart depicts vessel density (
Perfusion index and severity of retinopathy
Vessel density (mean [±SD]) and FI (mean [±SD]) and mean FAZ area (mm2) in various subgroups were determined as shown in Table III. There was a significant decrease in perfusion indices with increase in severity of retinopathy.
Mean value of perfusion indices and FAZ area in study subgroups
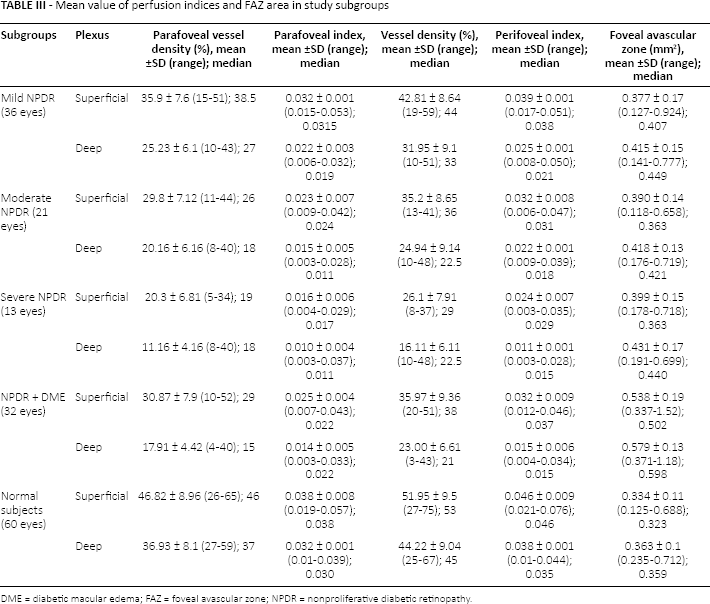
DME = diabetic macular edema; FAZ = foveal avascular zone; NPDR = nonproliferative diabetic retinopathy.
Comparison between perfusion index of superficial and deep plexus in NPDR subjects
Comparison of perfusion indices in diabetic subgroups (Student t test) of various plexus demonstrated that decrease in perfusion indices is more pronounced in deeper plexus (vs normal) compared to superficial plexus (vs normal) and the difference was significant (p<0.05). There was also a significant difference comparing perfusion indices of perifoveal and parafoveal regions (p<0.05). When FAZ of superficial plexus was compared with deep plexus, a significant difference was noted (p<0.05) (Figs. 5–6–7–8). The decrease in perfusion indices showed a significant linear trend with the increase in severity of NPDR.
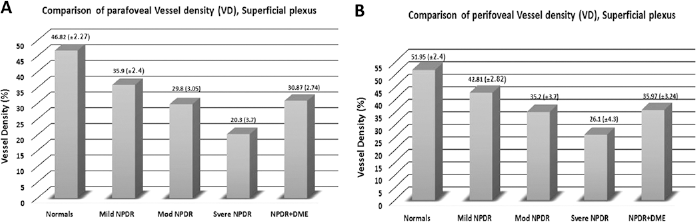
Mean vessel density in parafoveal (
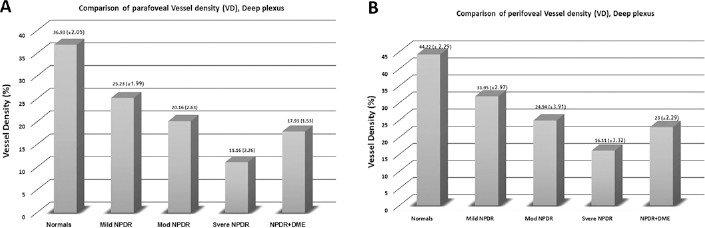
Mean vessel density in parafoveal (
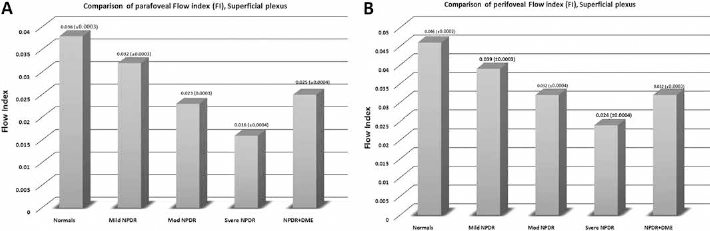
Mean flow index in parafoveal (
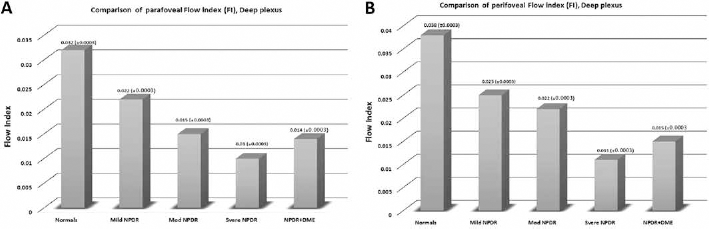
Mean flow index in parafoveal (
Comparison of severity of NPDR and perfusion indices between each subgroup
Table IV demonstrates the outcome of one-way analysis of variance of comparison of NPDR subgroups and normal cohorts in relation to NPDR severity. A significant difference was noted comparing perfusion indices of various subgroups (p<0.05; Tab. IV). However, there was no significant difference noted when the moderate NPDR group was compared with the NPDR + DME subgroup (p>0.05; Tab. IV).
Outcome of one-way ANOVA comparing NPDR subgroups and normal cohorts in relation to NPDR severity
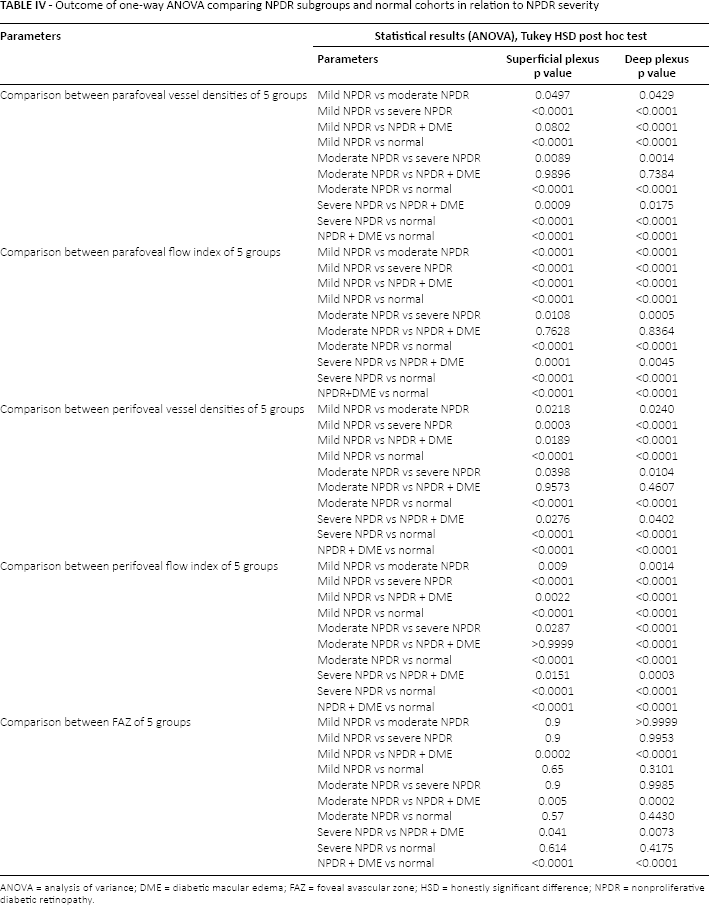
ANOVA = analysis of variance; DME = diabetic macular edema; FAZ = foveal avascular zone; HSD = honestly significant difference; NPDR = nonproliferative diabetic retinopathy.
Foveal avascular zone and severity of retinopathy
The FAZ area was highest in patients with DME and there was no significant difference comparing the area of FAZ of the mild NPDR group to the moderate or severe NPDR group for superficial or deep plexus (p>0.05; Tab. IV). When area of FAZ of patients with DME was compared with other NPDR subgroups, a statistically significant difference was noted (Fig. 9).
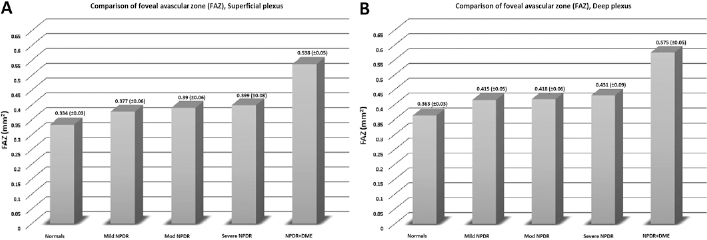
Foveal avascular zone area in superficial and deep plexus of retina with confidence interval of mean in parenthesis.
Correlation between severity of retinopathy and perfusion indices
Linear correlation plots between the levels of severity of DR and perfusion indices showed progressive decline with increase in the severity of NPDR (Figs. 10–11–12–13). Spearman rank correlation coefficient (rs) between vessel density and level of NPDR severity in the parafoveal region showed negative correlation (Fig. 10) for both superficial (rs -0.87; p 0.083) and deep (rs -0.96; p = 0.017) plexus (significant only in deep plexus [p = 0.017]). Similarly, when vessel density of the perifoveal region (Fig. 11) was compared with level of NPDR severity, negative correlation was noted in both superficial (rs -0.85; p = 0.08) and deep (rs -0.98; p = 0.011) plexus, but a significant difference was noted only in deep plexus (p = 0.011). On estimating rs between FI and level of NPDR severity, a negative correlation was noted in parafoveal (Fig. 12) and perifoveal (Fig. 13) regions. Significance was noted only in deep plexus (p<0.05). Linear correlation plots between the levels of severity of DR and FAZ areas showed progressive increase with increase in the severity of NPDR with a spike noted in patients with DME (Fig. 14). Spearman rank correlation coefficient (rs) between vessel density and level of NPDR severity in the parafoveal region showed a negative correlation (Fig. 14), but it was not statistically significant (p>0.05). Out of our 60 normal eyes, there were 25 eyes from the age group of 40-70 years (mean age 55.31 years, median age 57 years). The perifoveal vessel density in this age group in superficial plexus was 49.32 ± 8.14 and in deep plexus was 42.11 ± 6.23. Though there was decrease with age in deep (44.22% vs 42.11%) as well as superficial plexus, it still was significantly less than the vessel density noted in diabetic patients (Tab. V).
Vessel densities in deep plexus of various subgroups and normal subjects older than 40 years
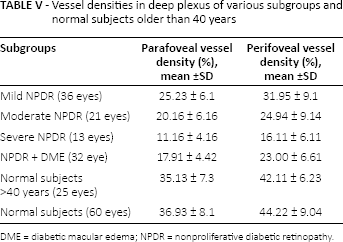
DME = diabetic macular edema; NPDR = nonproliferative diabetic retinopathy.
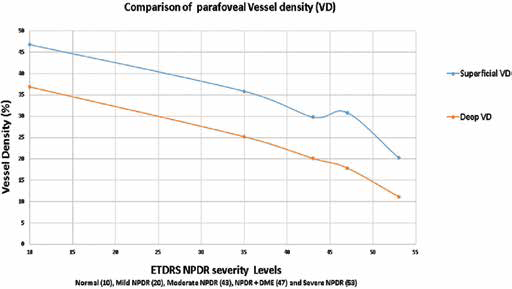
Linear regression plot for vessel density in superficial and deep plexus in the parafoveal region. Spearman correlation coefficient (rs) for superficial plexus was -0.87 (p = 0.083) and rs for deep plexus was -0.96 (p = 0.017).
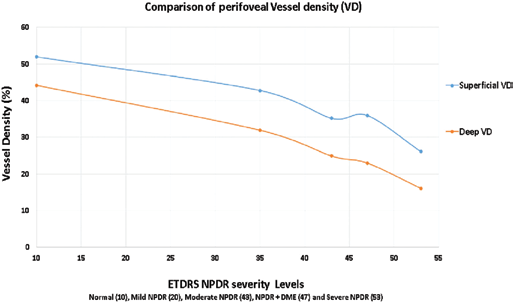
Linear regression plot for vessel density in superficial and deep plexus in the perifoveal region. Spearman correlation coefficient (rs) for superficial plexus was -0.85 (p = 0.08) and rs for deep plexus was -0.98 (p = 0.011).
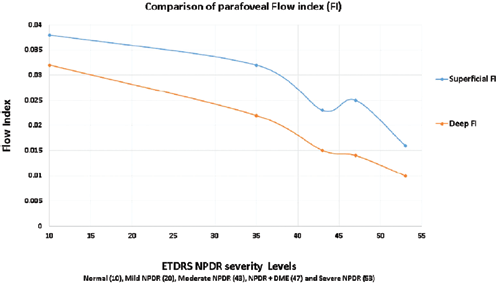
Linear regression plot for flow index in superficial and deep plexus in the parafoveal region. Spearman correlation coefficient (rs) for superficial plexus was -0.81 (p = 0.073) and rs for deep plexus was -0.98 (p = 0.015).
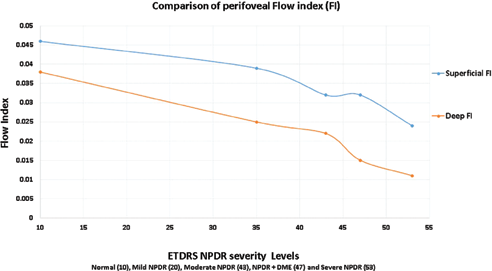
Linear regression plot for flow index in superficial and deep plexus in the perifoveal region. Spearman correlation coefficient (rs) for superficial plexus was -0.91 (p = 0.042) and rs for deep plexus was -0.97 (p<0.001).
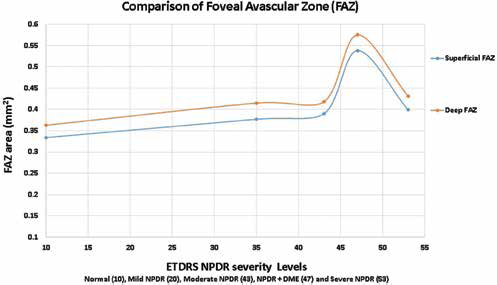
Linear regression plot for foveal avascular zone in superficial and deep plexus (mm2). Spearman correlation coefficient (rs) for superficial plexus was -0.67 (p = 0.078) and rs for deep plexus was -0.71 (p = 0.061).
Discussion
The number of patients with diabetes mellitus is expected to increase significantly in the next decade. By 2030, the worldwide prevalence of diabetic mellitus in the age group 20-79 years will increase by 1.3% (from 6.4% in 2010 to 7.7% by 2030) (1). In our study, significant decrease in perfusion index of superficial and deep plexus was noted and inversely correlated with degree of DR scale. Parafoveal vessel density and FI both decreased significantly with increase in severity. A similar trend was also noted in the perifoveal region. This decrease was more pronounced in the deeper plexus. The FAZ area increase was not significant with worsening of NPDR but this increase was profound in patients with DME. Correlation coefficient showed strong negative linear relation between the perfusion indices and severity of NPDR. Deep capillary flow was more severely compromised with increase in severity of NPDR (4×; rs = 0.97) than superficial plexus (2×; rs = 0. 85) when compared to normal (p<0.05).
The complexity in structure and function of retinal tissue makes it one of the most metabolically active locations in the body (13). The retina maintains a high oxygen concentration that remains stable despite changes in hemodynamics and atmospheric partial pressures (14). Retinal blood vessels are unique in that they can regulate vascular tone, and therefore blood flow, without the presence of an autonomic nerve supply (15). Diabetic retinopathy is a microangiopathy causing compromise of deep and superficial retinal plexus. Chronic sustained hyperglycemia causes specific pathognomonic histopathologic changes in diabetic retina.
Hyperglycemia-induced basement membrane thickening and intramural pericyte death lead to incompetence of the vascular walls (16). This leads to development of microaneurysms that first appears in deep retinal venular capillary plexus. The progression to sluggish blood flow and microinfarction of deep capillaries causes decrease in perfusion earlier in deeper plexus (16). Throughout most of the posterior retina, the retinal capillaries are arranged anatomically in a dual layer (17). The superficial capillary layer is associated with the ganglion cell layer, whereas the deep capillary layer resides within the inner nuclear layer. Like capillary networks elsewhere in the body, the retinal capillaries assume a meshwork configuration to ensure adequate perfusion to all retinal cells (17). The deeper layer has a mesh diameter (i.e., the distance between capillaries) averaging 50 μm but varies between 15 and 130 μm. The more superficial layer has a slightly larger meshwork, on average 65 μm in diameter (16 to 150 μm). In the mid equatorial and anterior zones, where the retina is thinner, only superficial capillary layer is present (17). This explains earlier involvement of posterior pole of retina in DR. Deep retinal capillary bed is considered more closely related to the venous side of circulation while the superficial capillary bed is more intimately involved with the arterial side (17). This has clinical application when considering the variety of hemorrhage in the fundus. Venous occlusive conditions like diabetes demonstrate deeper retinal hemorrhage of dot-and-blot nature whereas linear flame-shaped hemorrhage occurring in superficial retina is noted in arterial diseases like hypertensive retinopathy. The capillary wall consists of a continuous layer of flattened and longitudinally oriented endothelial cells and an incomplete layer of longitudinally oriented pericytes (18). The pericytes are closely spaced, resulting in an approximate ratio of pericytes to endothelial cells of 1:1, a relatively high ratio compared with elsewhere in the central nervous system (18). The pericytes of the retinal capillaries are not as elongated as the endothelial cells. They are endowed with multiple arm-like processes that wrap around the surrounding endothelial cells. Pericyte processes appear to cover about 85% of the entire circumference of the available capillary endothelial tube (18). Evidence suggests that the retinal pericytes are directly involved in the local control of retinal blood flow and affect endothelial proliferation as well (18). Retinal capillary coverage with pericytes is crucial for the survival of endothelial cells, particularly under stress conditions such as diabetes (19). Reduction of pericyte numbers in retinal capillaries leads to formation of increased numbers of acellular-occluded capillaries and microaneurysms (19). This pericyte loss relates to accumulation of toxic products such as sorbitol or advanced glycation end products (19). Pericytes also control endothelial cell proliferation, suggesting that pericyte loss may be involved in the pathogenesis of proliferative DR (19). All these histopathologic changes cause compromise of retinal blood flow and there are several techniques implemented to investigate blood flow variation noninvasively in the eye (20–21–22). However, FFA and OCT are the most widely used techniques for assessing the retinal vascular changes associated with DR.
Optical coherence tomography is a noninvasive technique that provides micrometer-level axial resolution in cross-sectional retinal imaging and has been clinically adopted as the standard to observe structural changes of retina, such as DME (1). Fundus fluorescein angiography is a vitally important diagnostic tool for evaluating patients with retinal pathologies. It is an invasive test that requires intravenous administration of dye and imaging for at least 10-15 minutes.
Fundus fluorescein angiography, obtained by using high-resolution fundus camera, visualizes the capillaries embedded in the transparent retina. However, early reports did not find adequate correlation between FA images of the retina and their histology (23). Weinhaus and coworkers (24) have reported that fluorescein angiography does not image the deeper capillary plexus well in monkey eyes. They suggested that scattering from the deeper retinal layers obliterated the image of the capillaries in deeper plexus. Optical coherence tomography angiography divides and quantifies separately the retinal circulation into superficial and deep capillary plexus. Using the SSADA technique (a vital component of OCTA), the radial capillary network in inner and outer retinal en face zones was readily imaged. The decrease in perfusion of retina is quantitatively measured with the use of OCTA. This study demonstrated that the deeper plexus is involved much earlier than superficial plexus.
Images obtained using OCTA have high resolution and are reproducible and reliable. As demonstrated previously, variability in OCTA is significantly lower than in other devices aimed at measuring flow, including laser Doppler flowmetry and laser speckle flowgraphy (9). Agemy et al (25) have described progressive changes in DR using OCTA and reported that the coefficient of variance was repeatable and reproducible for 6×6-mm scans. They found that the intravisit repeatability (range 0.1%-6.8%) and intervisit reproducibility (range 0.2%-5.7%) were similar in each subject.
Previous OCTA studies, using the new SSADA algorithm, revealed compelling images detailing the abnormalities in the retinal microcirculation vessels (9, 10). Patients with mild NPDR had ETDRS levels of 20-35, features of ETDRS level 43-47 were classified as moderate NPDR, and patients with level 53 were classified as severe NPDR (4). Early Treatment Diabetic Retinopathy Study criteria were used to categorize the degree of DR severity (4). Normal subjects had ETDRS grading of 10. In this study, for statistical analysis, all subjects with mild NPDR were graded as level 35, moderate NPDR patients were graded as level 42, subjects with NPDR + DME were labeled as level 47, and those with severe NPDR were labeled as level 53. The current study demonstrated that en face OCT angiograms could clearly visualize and quantify progressive vascular compromise at different NPDR stages. The decrease in the perfusion indices showed significant linear trend along the spectrum of DR for superficial and deep capillary network. This study demonstrates the potential of perfusion indices in objectively grading and linearly assessing microvascular compromise in DR. Perfusion indices in the perifoveal zone was affected more than those of the parafoveal zone. This could be explained by the difference in the size of the zones (perifoveal larger than parafoveal). On comparing perfusion indices of the moderate NPDR group to subjects having NPDR with DME, there was no significant difference. This could be explained by the fact that patients with DME can have variable grades of severity of NPDR. On comparing FAZ of patients with DME and other NPDR subgroups, statistical significance was noted. This happens as patients with DME accumulate fluid in the macula, causing distortion and enlargement of the FAZ (Fig. 2). This distortion of FAZ is due to flow voids of edema, rather than true decrease in perfusion indices on OCTA. The importance of the outer retinal plexus in retinal diseases has been difficult to ascertain. It is possible that in patients with DR the outer plexus is affected in parallel to the inner plexus and FFA is insufficient to grade vascular compromise completely and separately. Histologic evidence suggests that diabetic changes (microaneurysm and pericyte loss) occur earlier in deep plexus (19). Thus the deeper capillary compromise may be more profound or selective depending on the stage of DR (Tab. II; Fig. 4). Our findings of the deep capillary layer are consistent with previous nondiabetic and animal model studies showing that this capillary plexus is more vulnerable to ischemic insult, as it may be located in in a watershed zone of oxygen supply (26–27–28). Scarinci et al (29) in their study on 14 eyes have shown that that macular photoreceptor disruption on spectral-domain OCT in patients with DR corresponds to areas of capillary nonperfusion at the level of the deep plexus. This further emphasizes the contribution of the deep plexus to the oxygen requirements of the photoreceptors as well as the outer retina in diabetic macular ischemia.
Agemy et al (25) have described progressive changes in DR using OCTA, showing decrease in capillary perfusion density with increase in severity of DR. They obtained OCTA by RTVue XR Avanti (Optovue Inc.), but used automated color-coded perfusion maps and vessel density for analysis. In this study, we used not only vessel density but also FI for each image analysis. Though the results of their study are comparable to ours, we have used both perfusion indices in our results, making it more robust. They were not able to obtain a statistically significant difference despite having decreasing trends of perfusion densities with increase in the severity of DR. Conversely, we have demonstrated not only progressive decrease in perfusion indices but also a statistically significant change with increase in severity of DR. Takase et al (30) have reported variation in FAZ areas in diabetic eyes with and without DR (using Image J software, Wayne Rasband, National Institutes of Health, Bethesda, MD). The FAZ area in the superficial layer was 0.25 ± 0.06 mm2 in healthy eyes (n = 19), 0.37 ± 0.07 mm2 in diabetic eyes without retinopathy (n = 24), and 0.38 ± 0.11 mm2 in eyes with DR (n = 20). Diabetic eyes showed statistically significant FAZ enlargement compared with healthy eyes, irrespective of the presence of DR. In this study, we used built-in software to obtain area of FAZ. This could explain the difference in the results obtained in our study. However, both studies have similar average values and show similar trends of increase in the size of FAZ with increase in severity of DR. In this study, the mean value of vessel density in the parafoveal region in the normal subjects cohort was comparable to normative data results published in the literature (31–32–33–34). Shahlaee et al (33) have also reported a negative correlation between vessel density and age. Coscas et al (34) also have described a decrease in vessel density with age. In this study, 55 is the medium age of the diabetic population, which could be a bias if comparing their macular vessel density with a normal population with a median age of 42 years.
Optical coherence tomography angiography requires that the patient fixate precisely for several seconds, which may not be possible in patients with poor vision and is a limitation in this study. Due to this fact, we excluded a few patients from the analysis as there were motion artifacts noted in the images. The other limitation is that the study is cross-sectional. Our patient population is primarily white and African American. There could be variation in values of perfusion indices in different ethnicities. Diabetic retinopathy is a disease involving entire retina. Currently, OCTA provides perfusion indices only for the macular region. Macular function cannot be taken as a predictor for total retinal function and/or structural change. Thus the results of this study should not be applied to peripheral retinal compromise in DR. It should also be kept in mind that classification according to ETDRS is prone to lack reproducibility and has high test-retest variability (within and among graders) despite all possible efforts. In this study, 55 is the median age of the diabetic population, compared to a 45 median age normal population. This can have an effect on the results and their application. The DME + NPDR subgroup is not subgraded (mild, moderate, or severe NPDR) depending upon the severity of NPDR because the number of patients with DME in subgroups was too small compared to the non-DME group to perform meaningful statistical analysis. Accumulated fluid in retinal layers in DME masks the flow signal emanating from perfused vessels and may corrupt the OCTA data. The comparison of this group with the other NPDR groups may not be accurate with little clinical relevance.
Conclusion
Optical coherence tomography angiography clearly delineates the retinal microcirculation and enables quantification of vascular perfusion of each layer. As DR progresses, a decrease in flow index and vessel density becomes more profound in the deep retinal plexus. Thus OCTA, a noninvasive clinical test, may be used routinely to evaluate perfusion of retinal microvasculature status and monitor therapeutic effect of treatment interventions in DR.
Footnotes
Financial support: No financial support was received for this submission.
Conflict of interest: None of the authors has conflict of interest with this submission.
Meeting presentation: Presented at ASRS 2015, Vienna.