






Abstract
Purpose
Continuous flow left ventricular assist devices (CF-LVADs) generally operate at a constant speed, which causes a decrease in pulse pressure and pulsatility in the arteries and allegedly may lead to late complications such as aortic insufficiency and gastrointestinal bleeding. The purpose of this study is to increase the arterial pulse pressure and pulsatility while obtaining more physiological hemodynamic signals, by controlling the CF-LVAD flow rate.
Methods
A lumped parameter model was used to simulate the cardiovascular system including the heart chambers, heart valves, systemic and pulmonary arteries and veins. A baroreflex model was used to regulate the heart rate and a model of the Micromed DeBakey CF-LVAD (Micromed Technology, Houston, TX, USA) to simulate the pump dynamics at different operating speeds. A model simulating the flow rate through the aortic valve served as reference model. CF-LVAD operating speed was regulated by applying proportional-integral (PI) control to the pump flow rate. For comparison, the CF-LVAD was also operated at a constant speed, equaling the mean CF-LVAD speed as applied in pulsatile mode.
Results
In different operating modes, at the same mean operating speeds, mean pump output, mean arterial pressure, end-systolic and end-diastolic volume and heart rate were the same over the cardiac cycle. However, the arterial pulse pressure and index of pulsatility increased by 50% in the pulsatile CF-LVAD support mode with respect to constant speed pump support.
Conclusions
This study shows the possibility of obtaining more physiological pulsatile hemodynamics in the arteries by applying output-driven varying speed control to a CF-LVAD.
Introduction
Continuous flow left ventricular assist devices (CF-LVADs) are small rotary blood pumps, implanted in patients with end-stage heart failure. They generally operate at a constant speed. However, constant speed CF-LVAD assistance reduces the pulse pressure and index of pulsatility over a cardiac cycle, which may lead to long term complications (1). Although it was reported that the effects of the non-pulsatile CF-LVAD assistance is tolerated under certain conditions, the same studies show that pulsatile blood flow is more beneficial.
In the long term, the outcome of CF-LVAD support is similar for pulsatile and non-pulsatile support (2–4). However, while supported, patients under pulsatile support exhibit less remodeling and functional changes in their vascular system than patients under constant flow support (5–12). This leads to less gastrointestinal (GI) bleeding, aortic wall remodeling, and a better vascular auto-regulatory function. Geisen et al report that non-surgical bleeding in CF-LVAD patients can be explained by acquired von Willebrand disease (13). However, Crow et al report that loss of von Willebrand factor multimeres alone cannot be a predictor of GI bleeding (14). Nevertheless, comparative studies show that loss of von Willebrand Factor is higher under CF-LVAD support than in pulsatile assist device support (15, 16), which may be interpreted as pulsatile circulatory support being more beneficial for LVAD patients. Under pulsatile support, pulmonary vascular resistance reduces more than under constant flow support (17). Furthermore, long-term organ function appears to be preserved better with pulsatile support (18–20). Inflammatory responses reportedly occur at a lower rate in patients under pulsatile support as well (21, 22). A comparison between pulsatile versus continuous flow cardiac support and the benefits of pulsatile perfusion have been summarized in the literature (23–25). From these studies it is clear that pulsatile support may be beneficial for reducing the late complications of CF-LVAD support.
Models for pulsatile CF-LVAD operation have been described for different purposes. Cox et al defined a sinusoidal pump speed variation in a numerical model of a CF-LVAD supported patient to evaluate ventricle models and compare the effects of pulsatile and constant speed mechanical circulatory support on the coronary blood flow (26). In their study, varying speed support improved the perfusion and unloading of the left ventricle in comparison with constant speed support. However, there was no improvement in the arterial pulsatility. In a similar operating mode, Shi et al operated a CF-LVAD at a sinusoidal speed to evaluate the hemodynamic response of the cardiovascular system under assistance (27). They concluded that constant pump speed is the most efficient work mode for a rotary blood pump. Ando et al used a controller for counter pulsating operation of a CF-LVAD, and showed that in a CF-LVAD this mode enhances the myocardial perfusion (28). They did not consider the effects on pulsatility. Ising et al used different CF-LVAD flow rates to modulate the operating speed in order to increase the pulsatility in a simulation study (29). They changed the pulse width and amplitude of the flow signal through the pump. Thus, they showed the possibility of increasing pulsatility through pump control, although the control method itself was disregarded. To do so, a proper physiologically relevant reference model for systemic flow rate is needed. Furthermore, the ventricles were described using a time-varying elastance model in these studies. However, it has been reported in the literature that time-varying elastance models are not sufficient to describe the ventricle function under CF-LVAD support (30).
Vandenberghe et al did a comparison study between the continuous and pulsatile CF-LVAD operating modes using a Deltastream diagonal pump (31). The driver of this pump allows the user to set the pulse frequency of the rotational speed, outflow pulse pressure, and mean pump flow rate. The shape of the pump speed variations was sinusoidal only. Khalil et al varied the amplitude of the speed, heart rate, and systolic duration of the left, right, or both pumps in an axial flow total artificial heart to increase the pulsatility (32). The CF-LVADs were driven at a sinusoidally time-dependent rotational speed profile to increase the pulsatility in the studies mentioned above. A speed profile of this sort does not necessarily produce physiological pressure and flow rate signals in the circulatory system, although it may increase the pulsatility.
In this study, we aimed to develop a model reference control algorithm for a CF-LVAD in order to enhance the pulsatility in the systemic arterial pressure so as to deliver better long-term support for CF-LVAD patients. The controlled variable is the pump flow rate, to enable direct dynamic control of the pump output over a cardiac cycle, thus enabling pulsatile flows through the circulatory system as if the heart were functioning normally. The reference model and the pump driving mode allow more physiological signal shapes to be obtained in the arterial hemodynamics, and combines earlier partial findings into a complete control method.
Materials and Methods
To develop varying speed CF-LVAD control, models for describing the behavior of the cardiovascular system, including the baroreflex function, and a model of a CF-LVAD were used in a lumped parameter model. The reference flow rate signal to drive the pump was obtained from a separate lumped parameter model of the circulation and fed into a PI controller to drive the pump.
Cardiovascular system model
The cardiovascular system model used in the simulations includes heart chambers, heart valves, and the complete systemic and pulmonary circulation. The applied ventricle models are based on the model developed by Bovendeerd et al (33). This model describes the ventricular wall mechanics using myocardial constitutive properties. The ventricular wall mechanics model relates the macroscopic ventricular pressure and volume with microscopic tissue properties, which are fiber stress, fiber strain, radial wall stress, and radial wall strain. Active and passive fiber stress relations include the myocardial constitutive laws for fiber stress and radial stress. Expressions for the left ventricular pressure (plv), volume change (dVlv/dt), and active fiber stress (σ a ) are given below. Detailed information about the full heart model can be found in (33).



In Eq. 1 to 3, σ f , and σ m,r denote fiber stress and radial wall stress, V w and V lv , ventricular wall and cavity volume, respectively. Q mv and Q av are flow rate through the mitral and aortic valves, c is the parameter defining the strength of the contractility, σ ar is the active fiber stress and f, g and h are the non-dimensional functions that define the influence of sarcomere length (l s ), muscle activation and sarcomere shortening velocity (υ s ) respectively.
The circulatory system is described with a lumped parameter model including electrical analogs for resistance, compliance, and inertia (34), depicted in Figure 1. Similarly, the heart valves were modeled as ideal diodes allowing one-way blood flow. Atria have been modeled as passive compliances only. In this system, the change of systemic arterial pressure (dp
as
/dt) and the change of the flow rate in the aorta (dQ
as
/dt) are given by:



Electric-analog of the cardiovascular system and block diagram of the control application. R, L and C denote resistance, inertance and compliance, p, Q and V denote pressure, flow rate and volume, MV, AV, TV and PV are mitral, aortic, tricuspid and pulmonary valves, e an u are error and input of the CF-LVAD in the control application, ω is the operating speed of CF-LVAD, t and T are the instantaneous time and heart beat duration and subscripts la, lv, ra and rv denote left atrium and ventricle and right atrium and ventricle, as, sv, pa and pv denote systemic arteries, systemic veins, pulmonary arteries and pulmonary veins, ref and m represent reference and model.
With Q av the flow rate through the aortic valve, and p sv the pressure in the systemic veins. C as , R as and L as represent the arterial compliance, resistance, and inertance, respectively. The change of the pressures and flow rates in the other compartments were modeled in the same way using different parameter values (Tab. I).
Parameters Values Used in the Blood Vessels, Heart Valves, Ventricles, and Atria
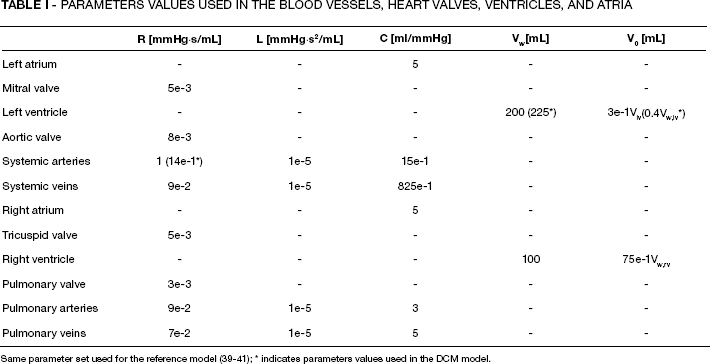
indicates parameters values used in the DCM model.
Baroreflex heart rate control model
The baroreflex model to modulate the heart rate was taken from Ursino (35). It has been used in other studies, e.g., for investigating aspects of the effects of intra-aortic balloon pumps on hemodynamics (36). In this model the afferent baroreflex pathway was defined using a sigmoidal function and linear first order differential equations. The model for the regulation effectors for the duration of a heart beat is:





Here, σ T,s and σ T,v are the sympathetic and vagal activities, with strengths G T,s and G T,v and time delays D T,s and D T,v and time constants, τ T,s and τ T,v. f es and f ev denote the sympathetic efferent and vagal efferent pathway frequencies respectively. t is instantaneous time, ΔT s and ΔT v denote sympathetic and vagal stimulation and T 0 denotes the heart period in absence of cardiac innervations, respectively.
CF-LVAD model
To simulate CF-LVAD support, a model was integrated into the cardiovascular system model that estimates the pressure difference across the Micromed VAD®, (Micromed Technology, Houston, TX, USA) considering the operating speed of the pump, flow rate, and change of the flow rate through the pump (37):


In the equations above, Δp CF-LVAD and Q CF-LVAD denote the pressure difference across the pump and flow rate through the pump. L CF-LVAD (2e-2mmHg s 2 /mL) and R CF-LVAD are the inertance and resistance effects in the pump. K (8.56e-05mmHg s 2 /rad 2 ), k1(9.17e-04mmHg s 2 /mL 2 ) and k2(203e-3mmHg s/mL) are the estimated parameters (37) and ω CF-LVAD denotes the operating speed of the pump.
CF-LVAD controller
In the simulations of the assisted cardiovascular system, the operating speed of the CF-LVAD was regulated by applying proportional-integral (PI) control to flow rate through the CF-LVAD. A PI controller is defined as below.

In a PI control application, proportional gain (K p ) is multiplied by the error, e(t), thus reducing the instant error. Integral gain (K i ) is multiplied by the integration of the error over time to eliminate the steady state error. The sum of both actions (P and I) constitutes the output of the controller, u(t). The proportional (K p ) and integral (K i ) gains were selected as 14 mL−1 and 50 mL−1s−1, respectively, in the simulations. The control gains were tuned according to the Ziegler-Nichols method (38).
Flow control reference model
The reference flow rate was obtained from a model that describes the dynamics of a passive left atrium, active left ventricle, and systemic arteries (Fig. 1). The left atrium and ventricle and heart valve models were described in the same way as in the complete cardiovascular system. The systemic arteries were represented as RC circuits, including their resistance and compliance properties. The flow rate through the aortic valve in the reference cardiovascular system model was used as the reference flow rate in the control application. The equations describing the reference flow rate are given below:



In the equations above, p as,m and p lv,m are the systemic arterial pressure and left ventricular pressure in the reference model. V tot,m , V u,m and V lv,m represent total, unstressed (zero pressure), and left ventricular blood volume, respectively. R av,m and R as,m are the characteristic resistances of aortic valve and systemic arteries, C as,m and C la,m denote compliances of the systemic arteries and left atrium in the reference model, respectively. Q as,m and Q ref denote the reference model systemic arterial and reference flow rates for the control application, while a 1 and a 2 are the parameters defining the amplitude and the shape of the reference flow signal. In the reference model, a 1 is the compliance of the aorta and a 2 equals one. For simplicity, the same parameter values as in the full cardiovascular system were used in the reference model. The block diagram, indicating the connection between the used models and the application of flow control, is given in Figure 1.
Pathological cases
A dilated cardio-myopathy (DCM) condition was simulated as the pathological case in this study. To simulate DCM, contractility of the left ventricle (c) was reduced from 1 to 0.55. The ventricular cavity volume is described by the inlet and outlet blood flow of the left ventricle. The reduced contractility reduces the contraction as calculated in the single fiber model and this changes the ventricular pressure and volume levels accordingly (26). Left ventricular wall volume was increased from 200 mL to 225 mL, zero pressure left-ventricular volume, increased from 0.3V lv to 0.4V lv as defined in (26). Systemic arterial resistance was increased to simulate the increased systemic resistance in the DCM patient, from 1 mmHg·s/mL to 1.4 mmHg·s/mL. The systemic resistance was kept as in the DCM model for the CF-LVAD supported circulatory model.
The parameters used in the models of a healthy and a DCM heart, baroreflex, and CF-LVAD were taken from (26, 33, 35, 37). The parameter values for blood vessel properties were taken from (39–41), and slightly adjusted to obtain physiological responses from the model. The parameter values in the circulatory model are listed in Table I.
Model output
To quantify the pulsatility in the systemic arterial pressure signal, the index of pulsatility (I p ) was taken from (42) and normalized using the mean values over a cardiac cycle, so as to have a descriptive parameter for pulsatility, usable in different pump support modes.

The simulations were performed using Matlab Simulink R2010a (Mathworks, Natick, MA, USA). The set of the equations was solved using the ode15s solver. The maximum step size was 5e-3 s, relative tolerance was set to 1e-3. The hemodynamic signals for the healthy and DCM situations without mechanical circulatory support in the cardiovascular system are calculated first. The physiological ranges of the hemodynamic signals such as pressures in the heart chambers and main blood vessels, ventricular volumes, cardiac output, ejection fraction, etc., are summarized in (26, 43) for healthy and DCM conditions. This information was used to compare the simulation results for the healthy and DCM models. To obtain realistic results in the varying speed CF-LVAD assisted model, the lower and upper bounds of the operating speed were set to 5 krpm and 15 krpm, respectively, according to the operational boundaries of the native Micromed total artificial heart controller.
Results
The hemodynamic parameters for healthy and DCM models are listed in Table II. The hemodynamic parameters for the healthy model were within the healthy range as defined in (26, 43). For the DCM model except the end-systolic arterial pressure, end-systolic, and end-diastolic arterial pressures, the hemodynamic pressures were within the range described in (26), so the model used as the DCM was eligible for CF-LVAD implantation.
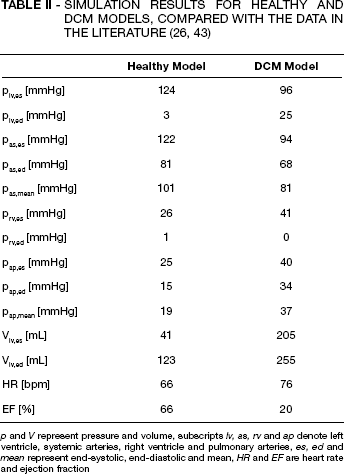
p and V represent pressure and volume, subscripts lv, as, rv and ap denote left ventricle, systemic arteries, right ventricle and pulmonary arteries, es, ed and mean represent end-systolic, end-diastolic and mean, HR and EF are heart rate and ejection fraction
All the simulations reached a periodic solution after a maximum of 30 s of simulated time. Results are presented as a 2 s time interval of the periodic solution.
In Figure 2, left and right ventricular pressures, systemic and pulmonary arterial pressures, left and right ventricular volumes, and p-V loops of the ventricles are given for the healthy and DCM models. In the DCM model, there was a significant decrease in end-systolic left ventricular and systemic arterial pressures with respect to the healthy situation. Simultaneously, there was an increase in end-diastolic left ventricular pressure. Left ventricular volume over a cardiac cycle increased as well, due to impaired left ventricular contractility. The stroke volume in the ventricles decreased by 40% in the DCM heart model. End-systolic pressure in the right ventricle and pulmonary artery increased as well as the mean pulmonary arterial pressure in the DCM situation. Right ventricular end-diastolic volume decreased slightly while right ventricular end-systolic volume increased. The amplitude of the flow rate signal through the aortic valve decreased for the DCM heart model. Ejection fraction decreased by 20% in the DCM model. So, the DCM model clearly has the features of a CF-LVAD implantation candidate.

Simulation results for healthy and DCM conditions. plv, pas, prv and pap are pressures in the left ventricle, systemic arteries, right ventricle and pulmonary arteries, Vlv and Vrv are left and right ventricular volumes and Qav is the flow rate through aortic valve, H and DCM show the results for healthy and DCM modes, respectively.
For both varying and constant speed CF-LVAD assistance, ventricular and arterial pressures, ventricular volumes and pressure-volume loops are given in Figure 3. In both assistance modes, systemic arterial pressure at the end of the systole exceeded 100 mmHg. Increased end-diastolic left ventricular pressure in the DCM situation decreased under CF-LVAD assistance in both operating modes. Similarly, the right ventricular and pulmonary arterial end-systolic pressures decreased to 25 mmHg. End-systolic left ventricular volume was slightly lower under constant speed CF-LVAD assistance than the varying speed CF-LVAD assistance. Stroke volume of the right ventricle increased under both varying and constant speed CF-LVAD support modes. However, stroke volume of the left ventricle decreased more under constant speed CF-LVAD support. In both operating modes, left ventricular pressure did not exceed the systemic arterial pressure for the simulated pump speeds, so the aortic valve remained closed and blood was flowing only through the CF-LVAD throughout the cardiac cycle. In varying speed mode the systolic pressure increase was faster than in constant speed support, leading to a maximum pressure obtained earlier in systole. A similar effect is observed when the arterial pressure becomes lowest. It starts to increase immediately due to the change in pump speed. Under constant speed CF-LVAD support, the transition between the pressures in the systolic and diastolic phases is smoother. Likewise, the shape of the ventricular volume graphs in pulsatile mode resembles the physiological ones better than the ones calculated for constant speed pump operation. Figure 4 gives the comparison of the systemic arterial pressures for the healthy model, the DCM model, and the CF-LVAD assisted model for both operating modes, the operating speed of the CF-LVAD and the flow rate through the pump, together with pressures at the inlet and outlet of the pump and the actual flow rate signals through the CF-LVAD in both operating modes together with the reference flow rate signal in varying speed CF-LVAD support.

Simulation results for CF-LVAD assisted circulatory model. plv, pas, prv and pap are pressures in the left ventricle, aorta, right ventricle and pulmonary arteries, Vlv and Vrv are left and right ventricular volumes, VS and CS show the simulation results for varying speed and constant speed CF-LVAD supported circulatory models.

Systemic arterial pressures in healthy model (pas,h), DCM model (pas,DCM), CF-LVAD assisted model at a constant speed assistance (pas,cs), CF-LVAD assisted model at the varying speed assistance (pas,vs), Flow rates through the CF-LVAD in constant speed assistance mode (QCF-LVAD,cs), varying speed assistance mode (QCF-LVAD,vs), and reference flow rate (Qref) in varying speed assistance mode and CF-LVAD operating speed (ωCF-LVAD) over a cardiac cycle with pressures in the left ventricle (plv), systemic arteries (pas) and CF-LVAD flow rate (QCF-LVAD) in varying speed control application.
As mentioned before, the varying speed CF-LVAD support causes a faster increase, which is more physiological in the systolic arterial pressure. Under continuous speed CF-LVAD assistance, arterial pulse pressure did not reach the healthy level. Varying speed CF-LVAD support increased the arterial pulse pressure by 12 mmHg with respect to constant speed pump assistance. In varying speed control, the operating speed of the CF-LVAD increased rapidly when the afterload reached its minimum. With the fast increase of the operating speed, the pump flow rate increased rapidly as well. The CF-LVAD operating speed remained constant during the left ventricular contraction and decreased rapidly after left ventricular relaxation began. When the afterload reached a maximum over a cardiac cycle, the CF-LVAD operating speed started to increase again to avoid reverse flow through the pump. With the decrease of the afterload, the CF-LVAD operating speed started to decrease and continued decreasing until the afterload reached the minimum over a cardiac cycle. The amplitude of the flow rate signal in the varying speed CF-LVAD operating mode was higher than the amplitude of the flow rate signals in the constant speed CF-LVAD operating mode. The applied control method showed a good performance on the mean flow rate through the pump. The mean pump output was almost the same as the mean of the reference signal over a cardiac cycle. However, the performance of the applied control on the instantaneous flow rate was not as good as the performance on the mean flow rate due to upper and lower bounds of the operating speed imposed by the controller.
Figure 5 shows the comparison of the hemodynamic variables under assistance of different operating modes and healthy and DCM models. Arterial pulse pressure decreases in the DCM situation. Under constant speed CF-LVAD assistance, arterial pulse pressure was the lowest, while varying speed CF-LVAD control provided a significant increase. For both operating modes the decreased mean arterial pressure in the DCM situation increased to a normal level. I p increased by 43% with the increase of the arterial pulse pressure. The flow generated by the CF-LVAD under assistance was as high as the cardiac output in the healthy model for both operating modes.

Comparison of the hemodynamic parameters in healthy model (H), DCM model (DCM), CF-LVAD assisted model at a constant speed (CS) and CF-LVAD assisted model at the varying speed (VS). CO and MPO are cardiac output and mean pump output, Vlv,ed and Vlv,es are the end-systolic and end-diastolic volumes in the left ventricle.
Due to increased flow rate under CF-LVAD assistance, the increased heart rate in the DCM model decreased to a healthy level under both CF-LVAD support modes. The hemodynamic parameters considered in Figure 5 were at the same level except the arterial pulse pressure and I p . These parameters were markedly higher under varying speed CF-LVAD support than the constant speed CF-LVAD support. The heart rate was 60 bpm under constant speed CF-LVAD support while it was 64 bpm under varying speed pump operating mode.
Discussion
In the previous sections the benefits of pulsatile perfusion in the LVAD patients were associated with a reduction of long-term complications. Although there are studies that report that continuous flow does not have deleterious effects on the end-organ function, the debate continues on non-pulsatile versus pulsatile support (24). As an example of the studies stating that continuous flow is tolerated well, Klotz et al reported that left ventricular pressure unloading is similar in patients with non-pulsatile in comparison with pulsatile devices, although volume unloading is better in pulsatile assist devices (44). In another study, Slaughter claims that according to clinical evidence under support of continuous flow assist devices, end-organ perfusion and function can be well maintained for longer assistance periods (45). So, at first sight, there seems to be no need for pulsatile pump flow. However, long-term complications, such as GI bleeding, AI, etc., which are typical for CF-LVAD support even in third-generation CF-LVADs, indicate the need for pulsatile pumping (46).
The aim of this study was to show the possibilities of pulsatile CF-LVAD assistance compared to constant speed support. The operating speed of a Micromed DeBakey CF-LVAD (Micromed Technology, Houston, TX, USA) was regulated by applying a PI control to pump flow rate to increase arterial pulsatility. The proposed control strategy provided an increase in the pulse pressure and I p in the arterial pressure signals over a cardiac cycle without reducing the level of support. The time-dependent total cardiac output flow rate resembled normal physiological aortic flow much better than the flow rate under constant speed LVAD support. The peak flow rate through the CF-LVAD was around 370 ml/s under pulsatile support mode while it was around 200 ml/s under constant speed support. Under varying speed CF-LVAD support the considered hemodynamic variables in the simulations were at the same levels with constant speed CF-LVAD support. The applied control performed well for the mean pump flow rate, however, instantaneous performance of the applied control was not as good as the performance on the mean flow. The upper and lower bounds were restricted according to the native Micromed DeBakey CF-LVAD (Micromed Technology, Houston, TX, USA) speed limits, thus limiting the instantaneous performance of the controller. It should also be noted that in a dynamic pump operating mode, the power consumption of the CF-LVAD might be higher than in constant speed pump support mode.
The control strategy that we used was applied to increase the pump flow at the systolic phase and to minimize flow in the diastolic phase. The applied control strategy increased the arterial pulsatility index by regulating the pump operating speed. However, change in the arterial pulsatility is dependent on different factors such as preload and afterload of the left ventricle and the pressure-flow relation at different speeds of the CF-LVAD. In the case of a change in the preload and afterload, the pulsatility index will increase due to synchronization of the pump and the heart. The level of increase will be determined by the pressure-flow characteristics of the CF-LVAD.
Left ventricular cardiac output decreases due to DCM, which leads to a decrease of right ventricular preload and thus end-diastolic volume, which will in turn decrease right ventricular output until an equilibrium is reached. In the presented model, in DCM, the end-diastolic pressure and volume of the right ventricle is slightly decreased compared to the healthy condition, however, the end-systolic pressure increases and right ventricular ejection fraction reduces. La Vecchia et al (47) report the reduced ejection fraction of the right ventricle in DCM condition. The ventricular pressures were described by fiber stress (σ f ), radial wall stress (σ m,r ), ventricular wall volume (V w ), and ventricular cavity volume (V v ) (Eq. 1). The increased end-systolic cavity volume in the right ventricle increases the right ventricular fiber stretch ratio. The non-dimensional functions f and h are the functions that define the influence of sarcomere length (l s ), and sarcomere shortening velocity (υ s ) on fiber stress. When either of them becomes larger, the active and total fiber stress (σ f ) in the DCM model will follow. Therefore, a larger right ventricular pressure is obtained for the same contractility (c) at increased end-systolic right ventricular volume. Furthermore, the relation between the ventricular pressure and volume is nonlinear (Eq. 1). Therefore, the ESPVR line does not follow a linear trend (26). In Ursino's baroreflex model (35), heart rate, contractility, splanchnic, and extrasplanchnic resistances are regulated. In this study, only heart rate regulation was considered because the change in splanchnic and extrasplanchnic resistances becomes very low in (35) and does not have a significant effect on the results. The contractility was reduced to model DCM in the simulations. The DCM model was able produce the hemodynamics in good agreement with the available patient data (26). The heart rate remains lower compared to clinical observations in LVAD recipients. The set-point (60 bpm) of the baroreflex most likely changes in DCM patients, due to the long term heart condition they have, leading to a higher basic heart rate. A different set-point value of HR could influence the results. Nevertheless, a higher pulsatility is expected due to synchronization and speed variations under varying speed CF-LVAD support, independent of the chosen heart rate. In a separate study, the baroreflex coefficients for DCM patients should be determined for Ursino's model, to account for the higher heart rates in these patients.
In a real world application, the heart rate varies with each heart beat, which means heart rate has to be estimated. This needs further elaboration including modeling of pathological conditions in the heart such as arrhythmias, which are very common in LVAD patients. Existence of the model describing the left ventricular and arterial dynamics as a reference model will allow predicting such kind of conditions and change the operating speed accordingly. The Micromed DeBakey CF-LVAD (Micromed Technology, Houston, TX, USA) includes a flow sensor to measure the pump flow during the operation. With the onset of ventricular contraction the flow rate through the CF-LVAD starts to increase. During the ventricular relaxation flow rate through the CF-LVAD decreases and in the diastolic phase reaches a minimum. The change of the flow rate through the CF-LVAD can be used for synchronizing the operating speed over a cardiac cycle accordingly. In this study, results for full CF-LVAD support were presented. In a real application, flow rate through the aortic valve needs to be estimated under partial support of a CF-LVAD. This requires a more detailed model and estimation techniques to assess aortic flow. In such a support mode, it is expected to have lower aortic valve flow due to synchronization of the peak reference flow with the systolic phase in the ventricle. Thus, an increased arterial pulsatility due to synchronization, and lowered aortic valve flow even under partial pump support is to be expected. For reasons of simplicity, it was assumed that heart rate was estimated properly and the control system adjusted timing of the reference signal accordingly.
The flow rate through the pump increases in the systolic phase when the left ventricle has a low pressure difference with respect to the aorta. It is minimized at diastolic phase. Under such a CF-LVAD support mode, the blood is pumped in the systolic phase predominantly. However, under constant speed CF-LVAD support blood is pumped continuously over a cardiac cycle. For the same mean pump outputs, the applied control strategy provides more physiological hemodynamical signal shapes. Furthermore, suction is not expected because the ventricle is unloaded during the systole and the applied control strategy actively minimizes the blood flow through pump during diastole. Thus, the ventricle will be filled in the diastolic phase without blood being ejected through the pump.
The applied control strategy doubled the pulsatility index in arterial pressure and CF-LVAD flow rate. The control variable was pump flow rate and the pump operating speed was regulated to achieve the required flow as well as possible. Due to the construction of CF-LVADs, fast changes of pump speed are hard to acquire. Adding a more aggressive pump speed control may be convenient to increase the benefit of the applied control strategy. This, however, will imply higher power consumption, which, in view of the battery power current CF-LVADs rely on, may be difficult to achieve.
In this study, our aim was to use a hemodynamic control variable (flow rate), rather than just pump speed. When the pump speed is used as a control variable, the relation between the pressure levels in the left ventricle and aorta, the flow rate through the pump, and the operating speed of the pump should be taken into account together, and a model should be developed to obtain more physiological pressure and flow signals in the circulation. Instead of this, we used a simpler approach, which not only increases the pulsatility, but also allows more physiological pressure and flow signals in the systemic circulation to be obtained.
Conclusions
Numerous studies report the beneficial effects of pulsatile mechanical circulatory support over continuous speed support. In this study, we have shown and quantified the effects of varying operating speed over a cardiac cycle to improve arterial pulsatility. The flow rates generated in our method resemble normal physiological systemic flow. Using a reference model to describe the left ventricular and arterial system dynamics produced physiological hemodynamic signals in the systemic arteries. The numerical study shows enhanced pulsatility and more physiological hemodynamic signals in varying speed control, which may reduce the long-term complications associated with CF-LVAD support. Varying speed control may combine the beneficial effects of pulsatile mechanical circulatory support and the durability of CF-LVADs.
Footnotes
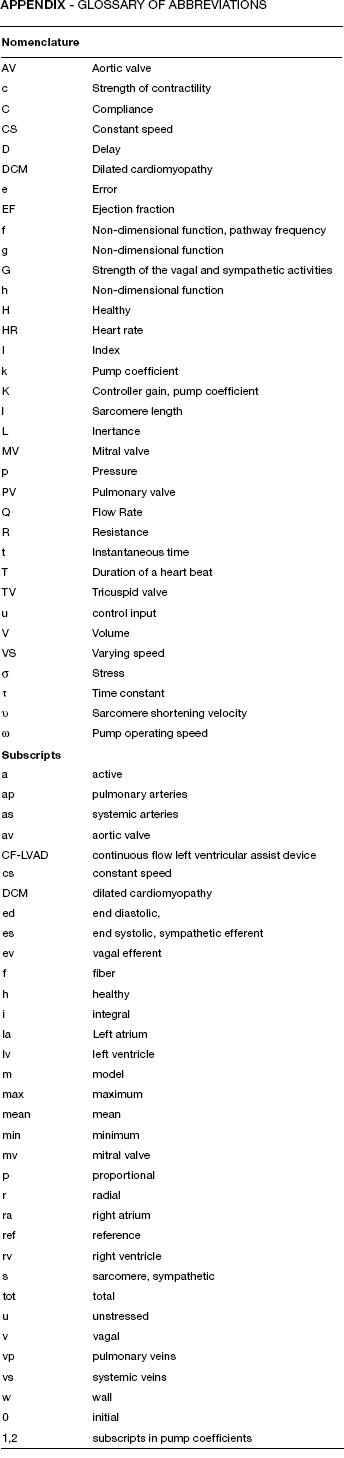
Appendix - Glossary of Abbreviations
| Nomenclature | |
|---|---|
| AV | Aortic valve |
| c | Strength of contractility |
| C | Compliance |
| CS | Constant speed |
| D | Delay |
| DCM | Dilated cardiomyopathy |
| e | Error |
| EF | Ejection fraction |
| f | Non-dimensional function, pathway frequency |
| g | Non-dimensional function |
| G | Strength of the vagal and sympathetic activities |
| h | Non-dimensional function |
| H | Healthy |
| HR | Heart rate |
| I | Index |
| k | Pump coefficient |
| K | Controller gain, pump coefficient |
| l | Sarcomere length |
| L | Inertance |
| MV | Mitral valve |
| p | Pressure |
| PV | Pulmonary valve |
| Q | Flow Rate |
| R | Resistance |
| t | Instantaneous time |
| T | Duration of a heart beat |
| TV | Tricuspid valve |
| u | control input |
| V | Volume |
| VS | Varying speed |
| σ | Stress |
| τ | Time constant |
| υ | Sarcomere shortening velocity |
| ω | Pump operating speed |
|
|
|
| a | active |
| ap | pulmonary arteries |
| as | systemic arteries |
| av | aortic valve |
| CF-LVAD | continuous flow left ventricular assist device |
| cs | constant speed |
| DCM | dilated cardiomyopathy |
| ed | end diastolic, |
| es | end systolic, sympathetic efferent |
| ev | vagal efferent |
| f | fiber |
| h | healthy |
| i | integral |
| la | Left atrium |
| lv | left ventricle |
| m | model |
| max | maximum |
| mean | mean |
| min | minimum |
| mv | mitral valve |
| p | proportional |
| r | radial |
| ra | right atrium |
| ref | reference |
| rv | right ventricle |
| s | sarcomere, sympathetic |
| tot | total |
| u | unstressed |
| v | vagal |
| vp | pulmonary veins |
| vs | systemic veins |
| w | wall |
| 0 | initial |
| 1,2 | subscripts in pump coefficients |