
Abstract
Cast Mg–8 wt% Mg2Si in situ composites containing 0, 0.5, 1, 2 and 3 wt% Gd were studied for their microstructure and high-temperature behaviour. Mechanical properties of the composites were investigated in the temperature range 25–250°C. Gd addition resulted in the modification of the primary Mg2Si particles, reduction of their average size and volume fraction, and formation of new Mg3Si2Gd2 and Mg5SiGd intermetallic phases and solid solution of Gd in the Mg matrix. The composite with 1% Gd addition showed the highest strength due to the presence of finer Mg2Si particles with polygonal morphology. Higher Gd contents decreased the strength, due to the coarsening of the Mg2Si particles, caused by the over-modification effect of Gd.
Introduction
Significant interest has been devoted to magnesium and its alloys in recent years, due to a combination of attractive properties such as low density, high damping capacity, good specific strength, recyclability and dimensional stability for aerospace and automotive industries. Specifically, the Mg–Si base alloys offer significant prospective as lightweight structural materials for high-temperature applications [1-3]. This is because the solubility of Si in Mg is extremely low (0.003 at%), and therefore, the majority of the Si atoms can react with Mg atoms to form the second phase Mg2Si. The hypereutectic Mg–Si alloys with the Si contents greater than 1.34 wt% are usually considered as Mg–Mg2Si in situ composites containing more than about 4 wt% of Mg2Si particles as the reinforcements. These particles exhibit high hardness (4.5 GPa), high melting point (1085°C), reasonably high elastic modulus (120 GPa), low density (1.99 × 10³ kg m−3) and low thermal expansion coefficient (7.5 × 10⁻⁶ K−1) [4].
It is widely accepted that the strength of the Mg–Si alloys significantly increases with the increase in silicon content of the alloys [5-8]. These cast composites have very low ductility due to the undesirable morphology of the coarse primary Mg2Si particles and the presence of the brittle eutectic (α–Mg + Mg2Si) structure. This morphology, which leads to easy crack initiation alongside the interface between Mg matrix and Mg2Si particles, caused by the stress concentration at the sharp tips of these particles, is believed to damage the mechanical properties both at ambient and elevated temperatures. Consequently, many attempts have been made to take advantage of adding various alloying elements such as Sb [9], Bi [10], Sr [11], Ba [12], Ca [13], P [14], as modifiers during solidification of the Si-containing Mg alloys and composites to improve their mechanical properties. Using a G–D map obtained from thermodynamic and kinetic principles, Tian et al. analysed the influence of several elements on the size of in situ formed Mg2Si particles in Mg melts [15]. They found that P, Sb, Sn and Sr refine Mg2Si through enhancing the nucleation rate and reducing the growth rate, while, Mn, Ti, V and Zr contribute to coarse-shaped Mg2Si by delaying nucleation. Their study, however, did not include the effect of Gd element.
The modification effects of Gd addition on the primary Mg2Si particles in the hypereutectic Mg–3Si alloy have also been investigated [16]. It was found that 1 wt% Gd addition can modify the Mg2Si particles and improve hardness of the cast Mg–3Si alloy accordingly. Besides, in a more recent study, performed by the present authors, it has been evidenced that the addition of Gd can change the shape of the primary Mg2Si particles from coarse dendritic shape to polygonal type, and reduce their average size, leading to improvement of creep resistance of the cast hypereutectic Mg–3Si alloy [17]. Khorshidi et al. [18,19] have also pointed out that adding Gd alters the irregular morphology of the Mg2Si particles to finer polyhedral shape along with the enhancement in the elevated-temperature mechanical properties of an Al–Mg2Si composite. These observations suggest that Gd can act as a suitable modifier for Mg2Si phase.
Hitherto, most of the investigations on mechanical characteristics of the Si-containing Mg alloys and composites have been performed by uniaxial tension test [5,10,11,13]. Nevertheless, up to now, the study of mechanical behaviour of in situ Mg–Mg2Si composites by the small-scale shear punch testing (SPT) technique has not been reported. This is a miniature testing method, that has been successfully employed for assessing mechanical behaviour of various as-cast magnesium alloys and composites [8,20-22]. SPT has been found capable of providing strength values which are well related to those obtained by the conventional tensile tests [23,24]. Therefore, the main aims of the current study are to examine the effects of Gd addition on the microstructure of an Mg–8Mg2Si in situ composite, to explore the relationship between Gd content, microstructural features and mechanical properties, using SPT technique at ambient and elevated temperatures.
Experimental procedure
Materials and processing
The studied materials with the nominal chemical compositions of Mg–3Si–xGd (x = 0, 0.5, 1, 2 and 3 wt%) were cast by a tilt-casting system, the details of which are given elsewhere [17]. Based on the equilibrium phase diagram of the Mg–Si system and using the lever rule, 3 wt% of Si would result in 8 wt% of Mg2Si. For this to happen, the cooling rate of the melt should be low enough to facilitate an equilibrium condition. Accordingly, the molten composites were poured into a mould preheated to 195°C to reduce the solidification rate. Microstructural characterisations were made by optical microscopy (OM) and scanning electron microscopy (SEM). Energy dispersive spectroscopy (SEM-EDS) and elemental mapping were performed on the specimens, which were first mechanically polished and then chemically etched with an acetic picric (10 ml acetic acid, 5 g picric acid and 95 ml ethanol) etchant at ambient temperature. For the identification of the phases, X-ray diffraction (XRD) was employed. The XRD studies were carried out using Cu Kα radiation at 40 kV and tube current of 30 mA over the 2θ range of 20°–80°, using a step size of 0.02° with a counting time of 0.35 s at each step. Image analysis software (Clemex) was used to determine the average size, volume fraction and size distribution of the primary Mg2Si particles.
Shear punch test
The mechanical property measurement of the materials was carried out by SPT. In this test, a sheet specimen is positioned under a flat-bottomed cylindrical punch and over a receiving-hole in the die. As the load is applied, the punch penetrates into the sample, punching a circular disc from it. The diameter of the punch was 3.175 mm and that of the die hole was 3.225 mm. The die and punch assembly was placed on the lower platen of a universal testing machine inside a three-zone split furnace to run the tests in the temperature range of 25–250°C. The 0.7-mm-thick specimen was loaded at a constant crosshead speed of 0.25 mm/min. The instantaneous load P was continuously recorded as the punch was driven against the sample. Punch displacement was normalised to the specimen initial thickness and taken as a measure of ductility. The shear stress of the tested samples was determined using the relationship [25]:

Results and discussion
Microstructural observations
The SEM images and EDS point analysis of the Mg–8Mg2Si base composite are shown in Figure 1. As can be seen in this figure, the typical microstructure of the base composite contains three constituents: dendritic α–Mg, coarse irregular-shape primary Mg2Si particle, and lamellar eutectic structure of (α–Mg + Mg2Si). These observations are in accordance with microstructural aspects reported for a cast hypereutectic Mg–3Si alloy [17]. The given EDS analysis confirms that the base composite consists of Mg and Si atoms. Moreover, the primary Mg2Si particles are circumscribed by the α–Mg phase. The (α–Mg + Mg2Si) eutectic structure is formed around the α–Mg phase, similar to what occurs in a hypereutectic Mg–Si alloy [17,26]. The formation of microstructural constituents is usually controlled by the solidification conditions of the material. Because of the relatively high cooling rate that is imposed on the molten material by the steel mould, it is anticipated that the situation is deviated from the equilibrium condition during solidification process. After Mg2Si precipitates primarily with a dendritic morphology, the liquid phase around these precipitates becomes rich in Mg due to the rejection of Mg solute atoms. As a result, α–Mg phase is formed and grow around the primary Mg2Si particle. As the temperature decreases to the eutectic temperature, the eutectic structure of (α–Mg + Mg2Si) forms around the α–Mg phase.
SEM micrograph of the base composite with average chemical compositions of the Mg matrix and Mg2Si particles analysed by EDS.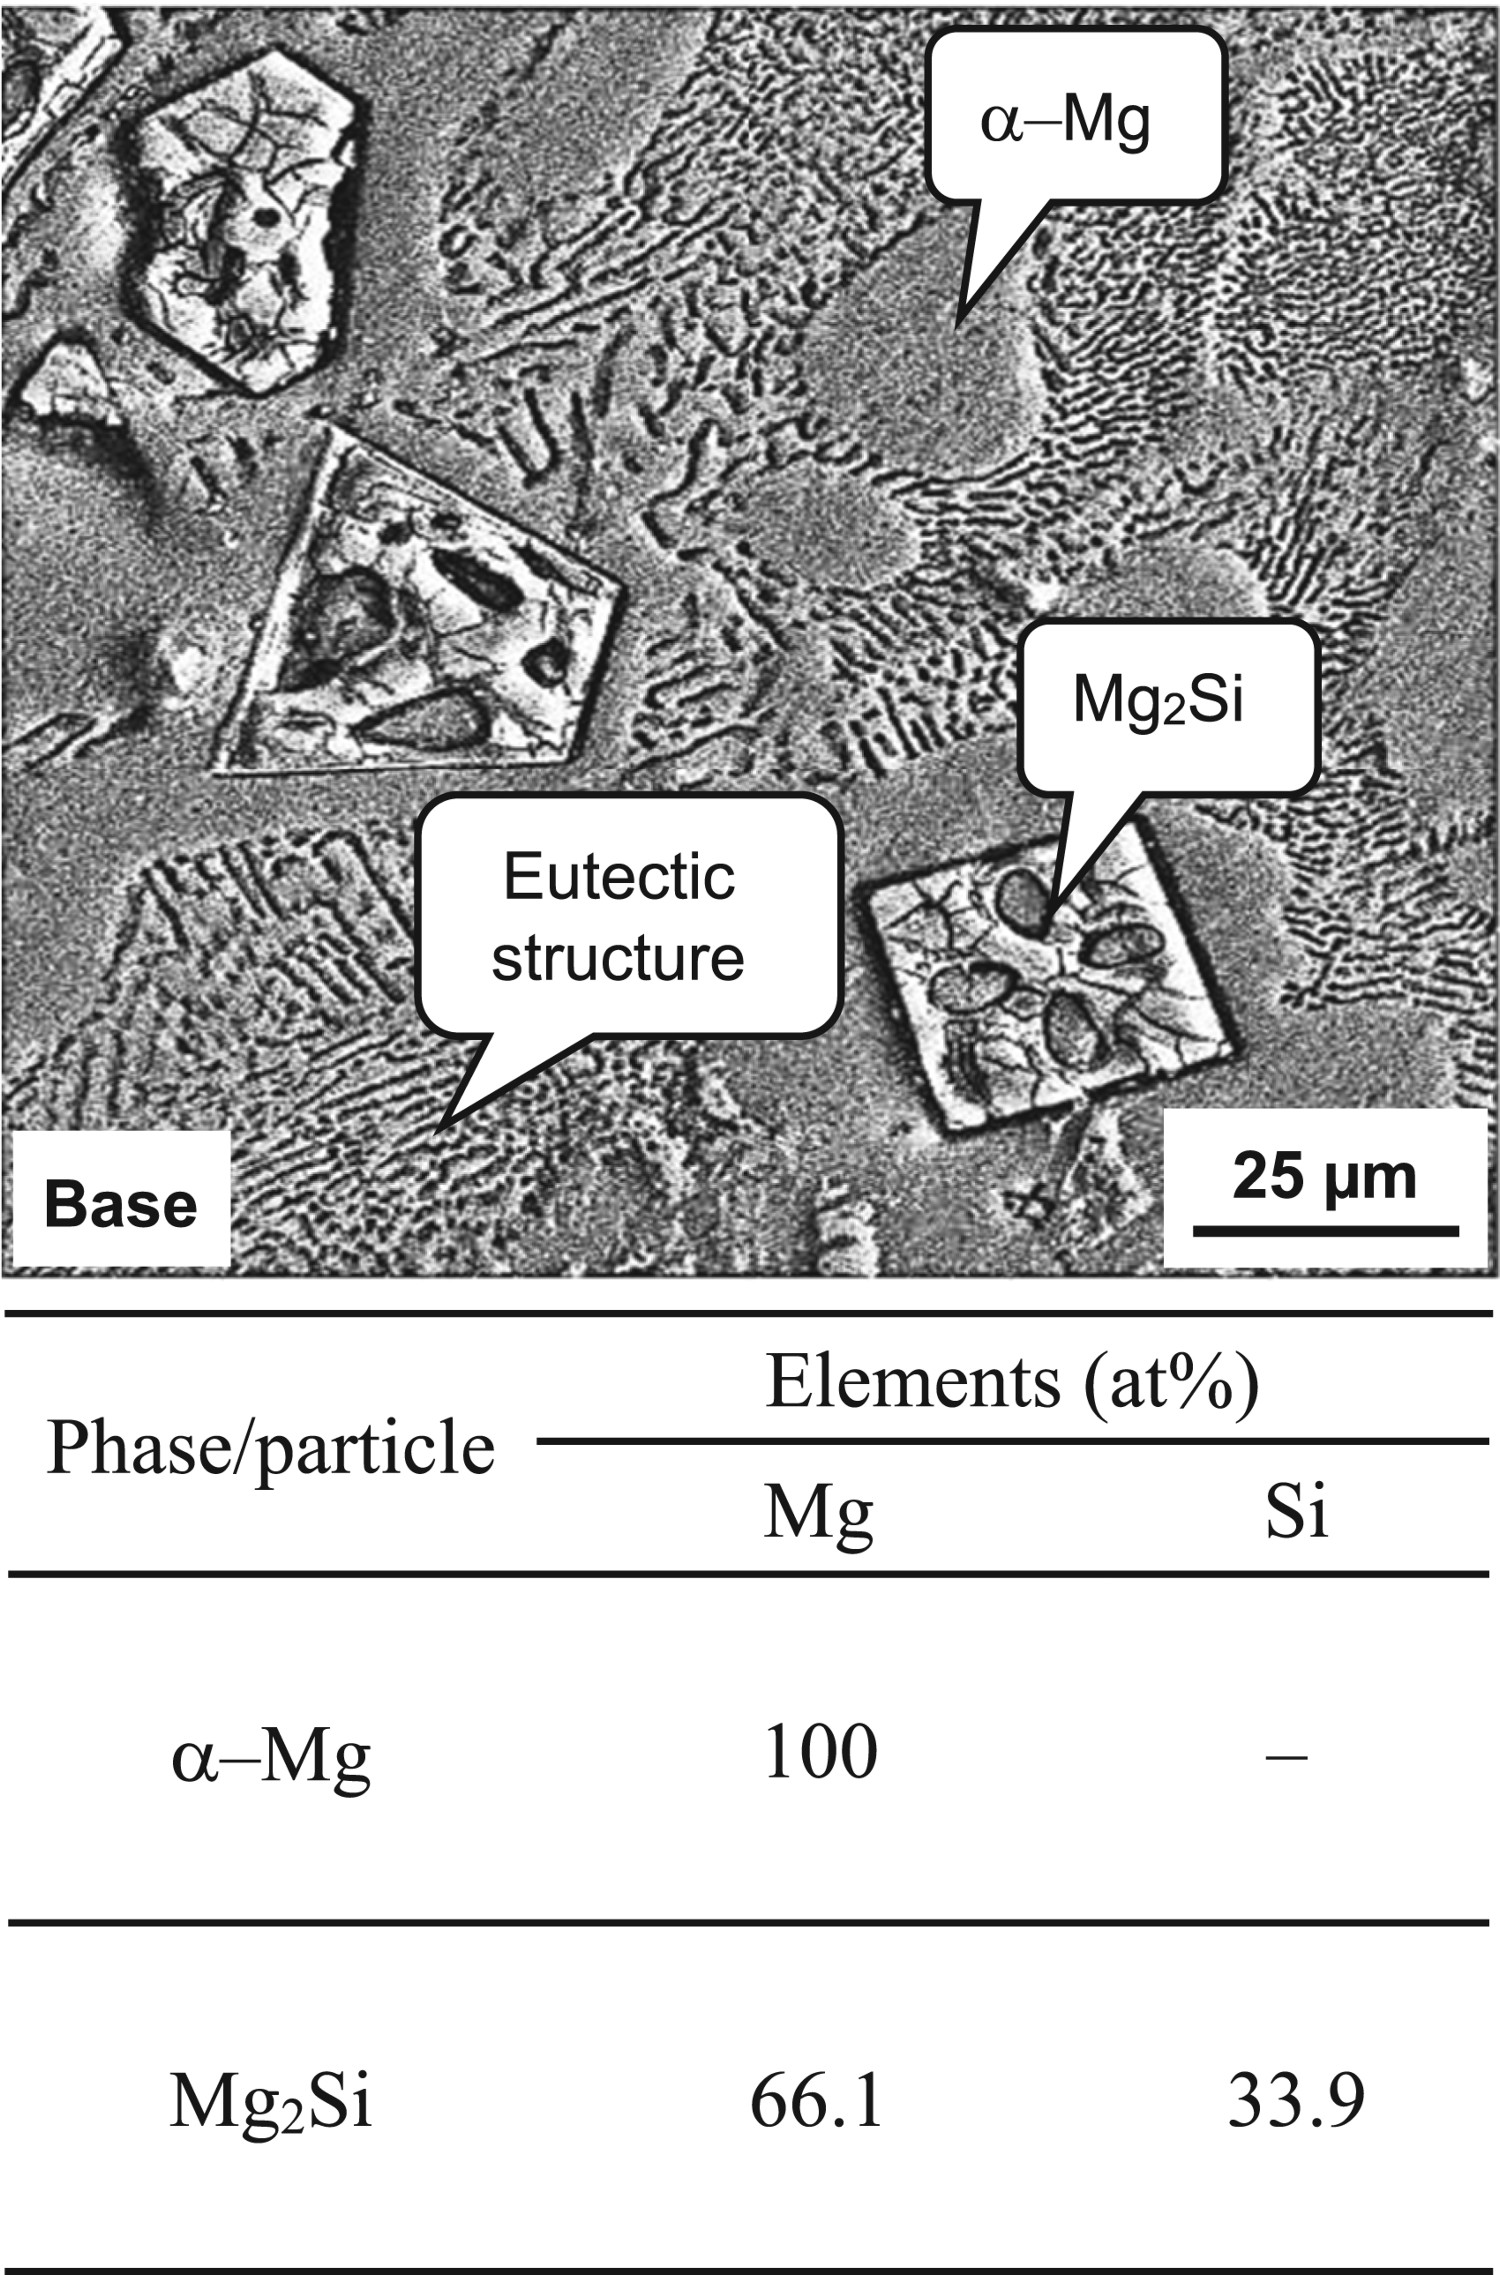
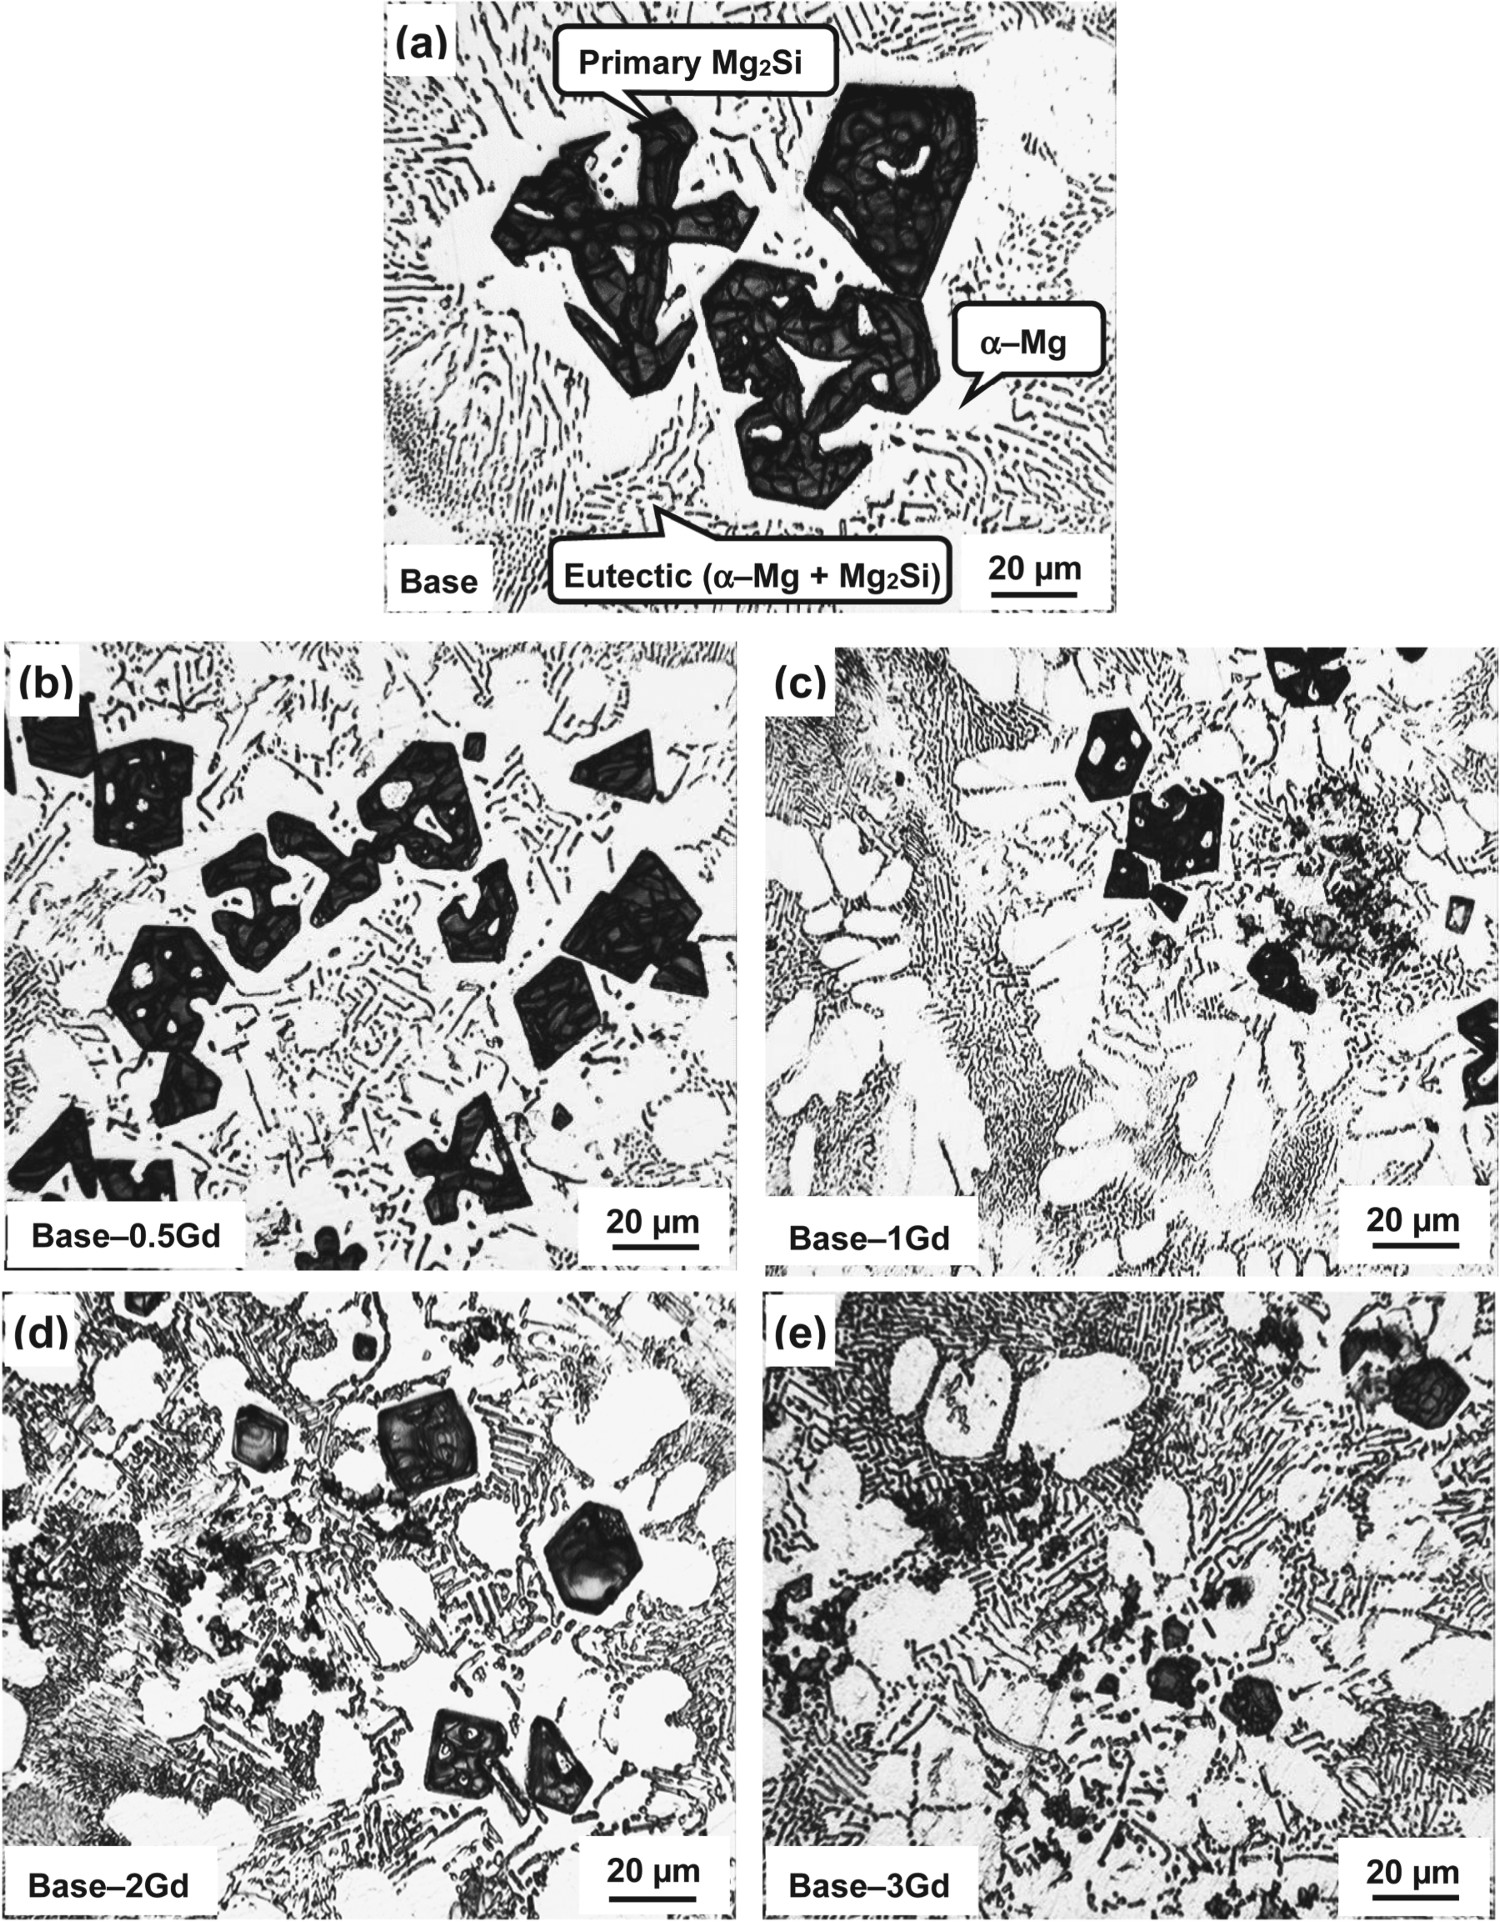
The XRD patterns of the Base, Base–1Gd and Base–3Gd composites are demonstrated in Figure 2, and the OM micrographs of composites with different amounts of 0.0, 0.5, 1 2 and 3 wt% Gd are shown in Figure 3. According to the XRD pattern of the base composite, it is evident that the only constituents are Mg and Mg2Si phases, consistent with the result of SEM (Figure 1) and OM images (Figure 3(a)). Nevertheless, as can be seen in Figure 3(b–e), some new fine clusters of particles with dark contrast are detectable in the microstructure of the Gd-containing composites that are expected to contain Gd. It should be mentioned, however, that no Gd-containing phases were identified in the XRD results after addition of 1 and 3 wt% Gd, shown in Figure 2(b,c), respectively. This is believed to be due to the low volume fraction of the Gd-containing phases, leading to the low peak intensity, which could not be detected by XRD analysis. The same behaviour has been previously observed in an Mg–3Si–1Gd alloy, and a similar argument has been put forward to justify it [16].
XRD patterns of: of (a) Base, (b) Base–1Gd, and (c) Base–3Gd composites. Optical images of: (a) Base, (b) Base–0.5Gd, (c) Base–1Gd, (d) Base–2Gd, and (e) Base–3Gd composites.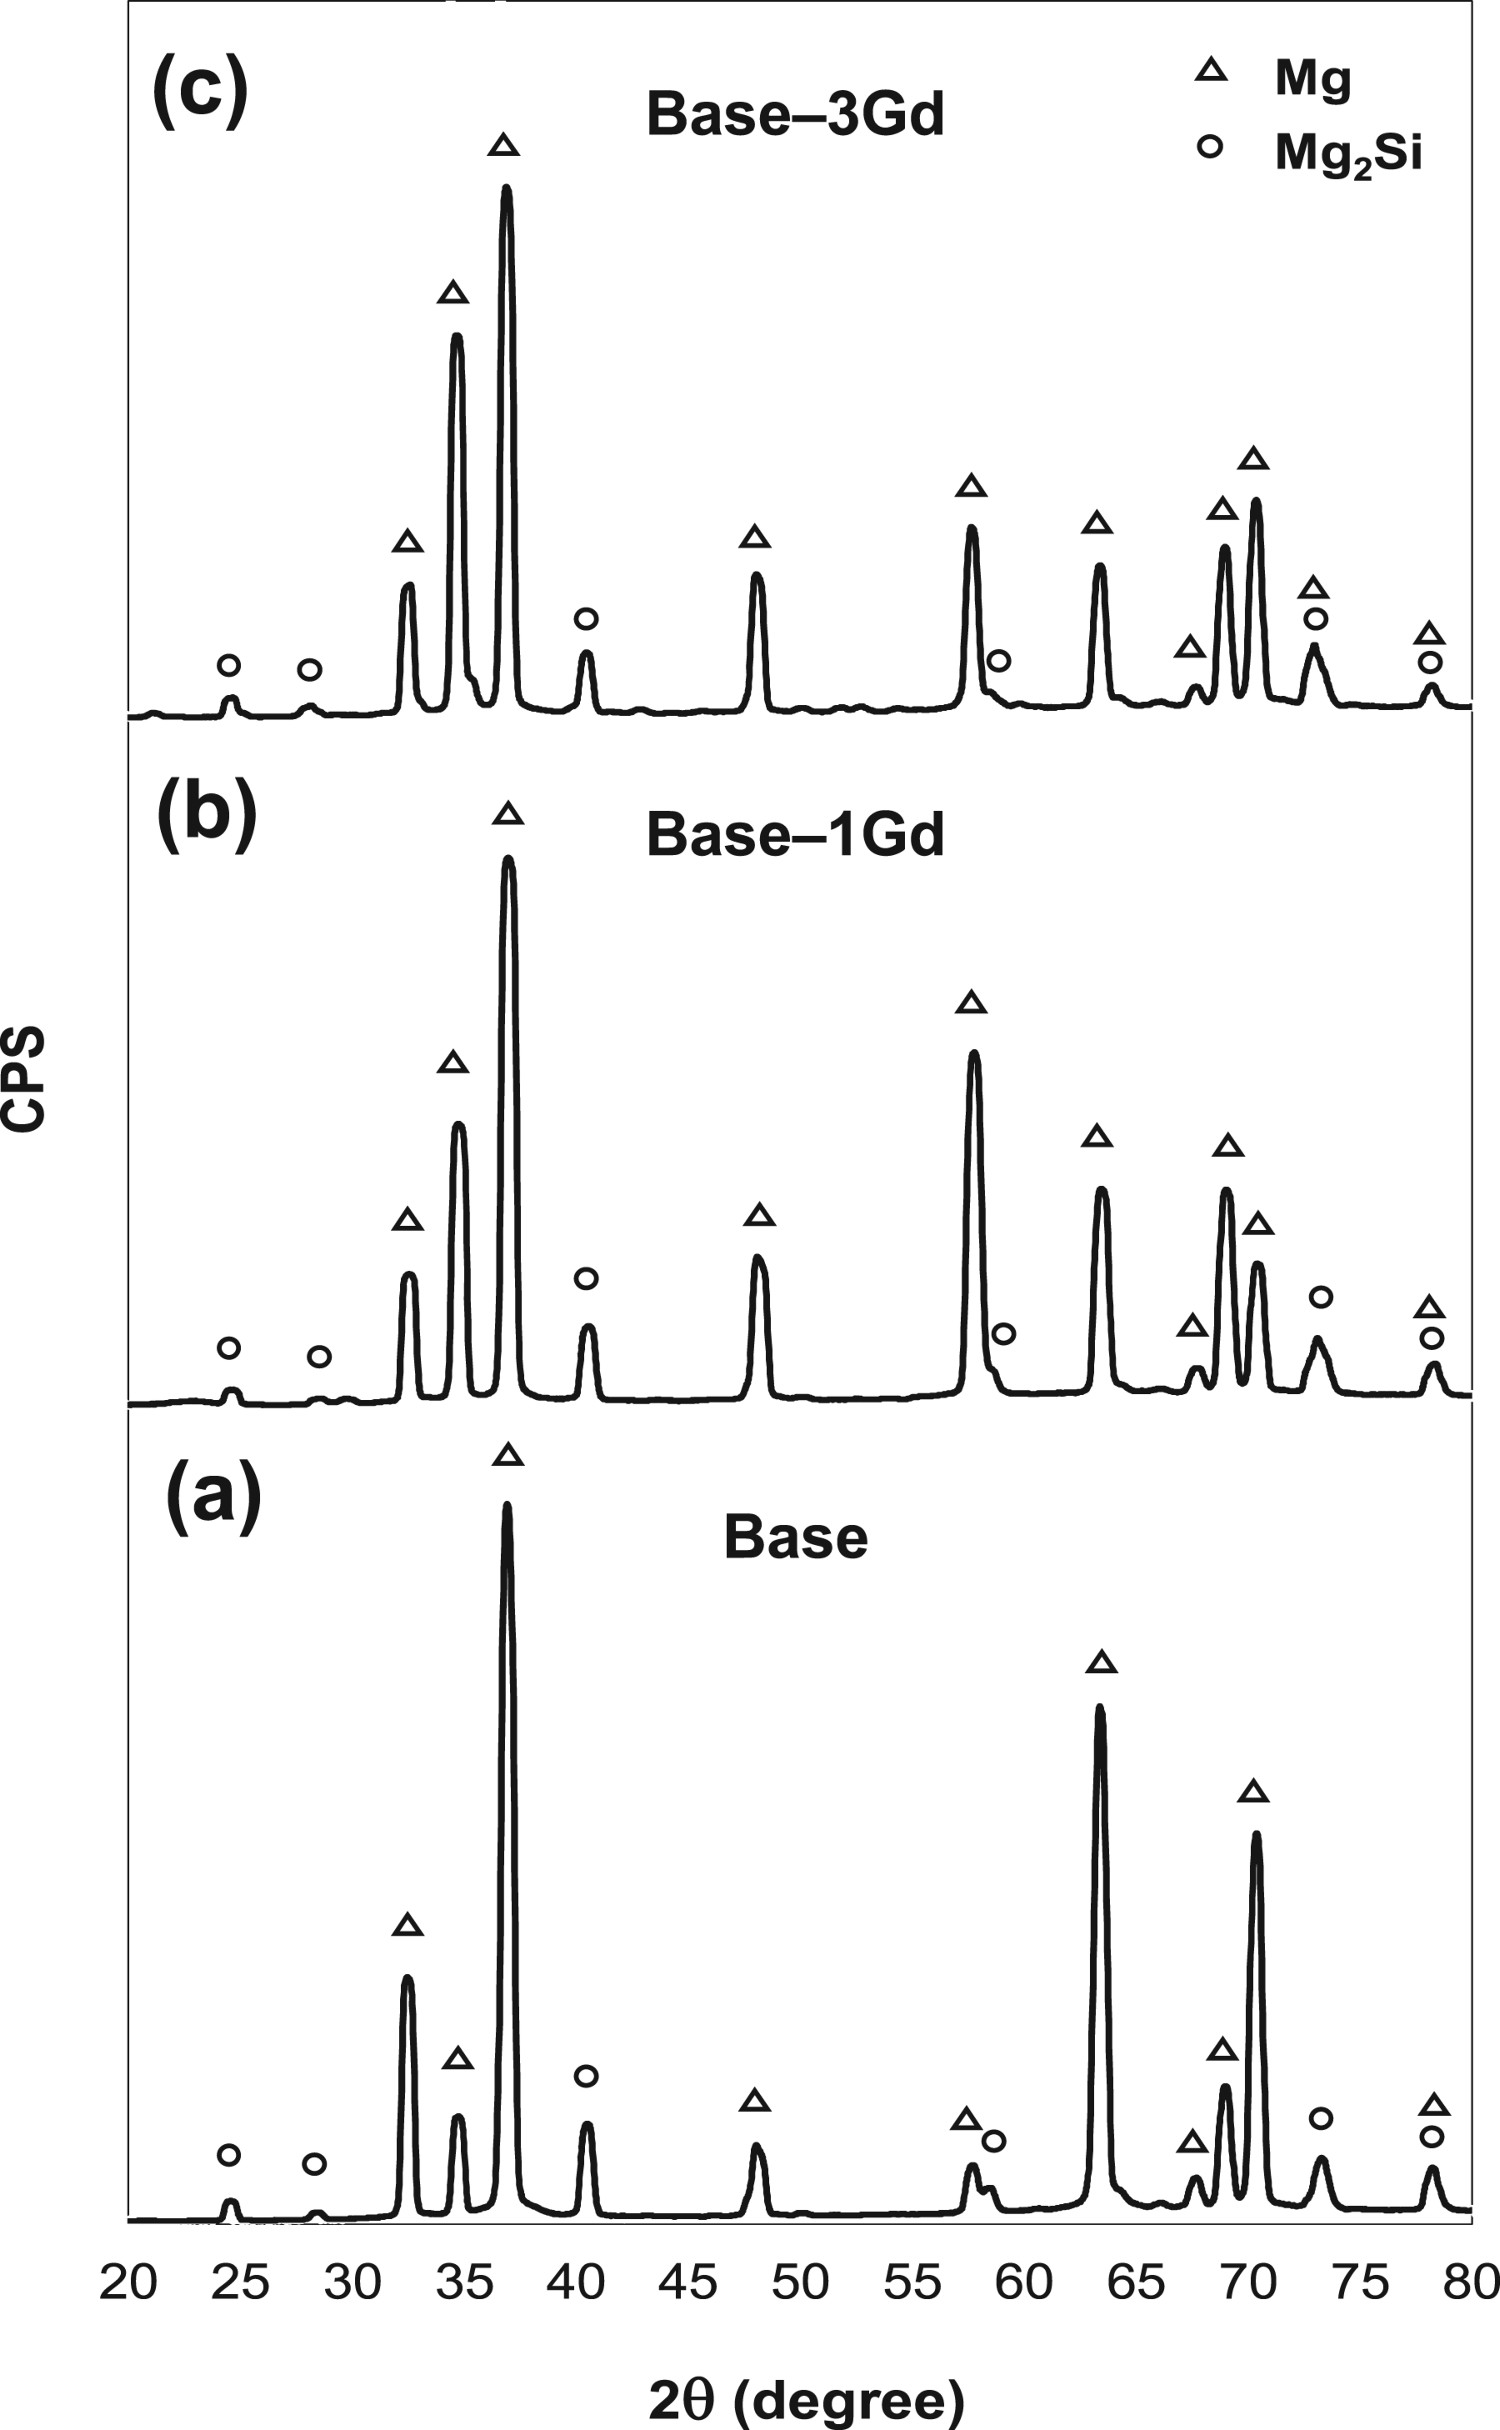
The changes in the average size and volume fraction of the primary Mg2Si particles with the Gd content measured by Clemex image analysis are plotted in Figure 4(a,b), respectively. Figure 4(a) reveals that the average size of the primary Mg2Si particles is about 43.3 µm in the unmodified composite. When Gd content is increased to 0.5 and 1 wt%, the average sizes of the primary Mg2Si particles reduce to about 29 and 18 µm, respectively. Further increase of Gd to 2 wt%, results in the coarsening of the primary Mg2Si particles to about 21 µm, indicating that over-modification has occurred. Interestingly, when the Gd content is further increased to 3 wt%, the size of the primary Mg2Si particles drops to 12.8 µm. A rather similar trend can be seen in the variation of the volume fraction of these particles with Gd content, as depicted in Figure 4(b). The volume fraction of Mg2Si particle decreases from about 9% in the Gd-free composite to about 2% in the Base–3Gd composite.
Variation of: (a) average size and (b) volume fraction of Mg2Si with the Gd content.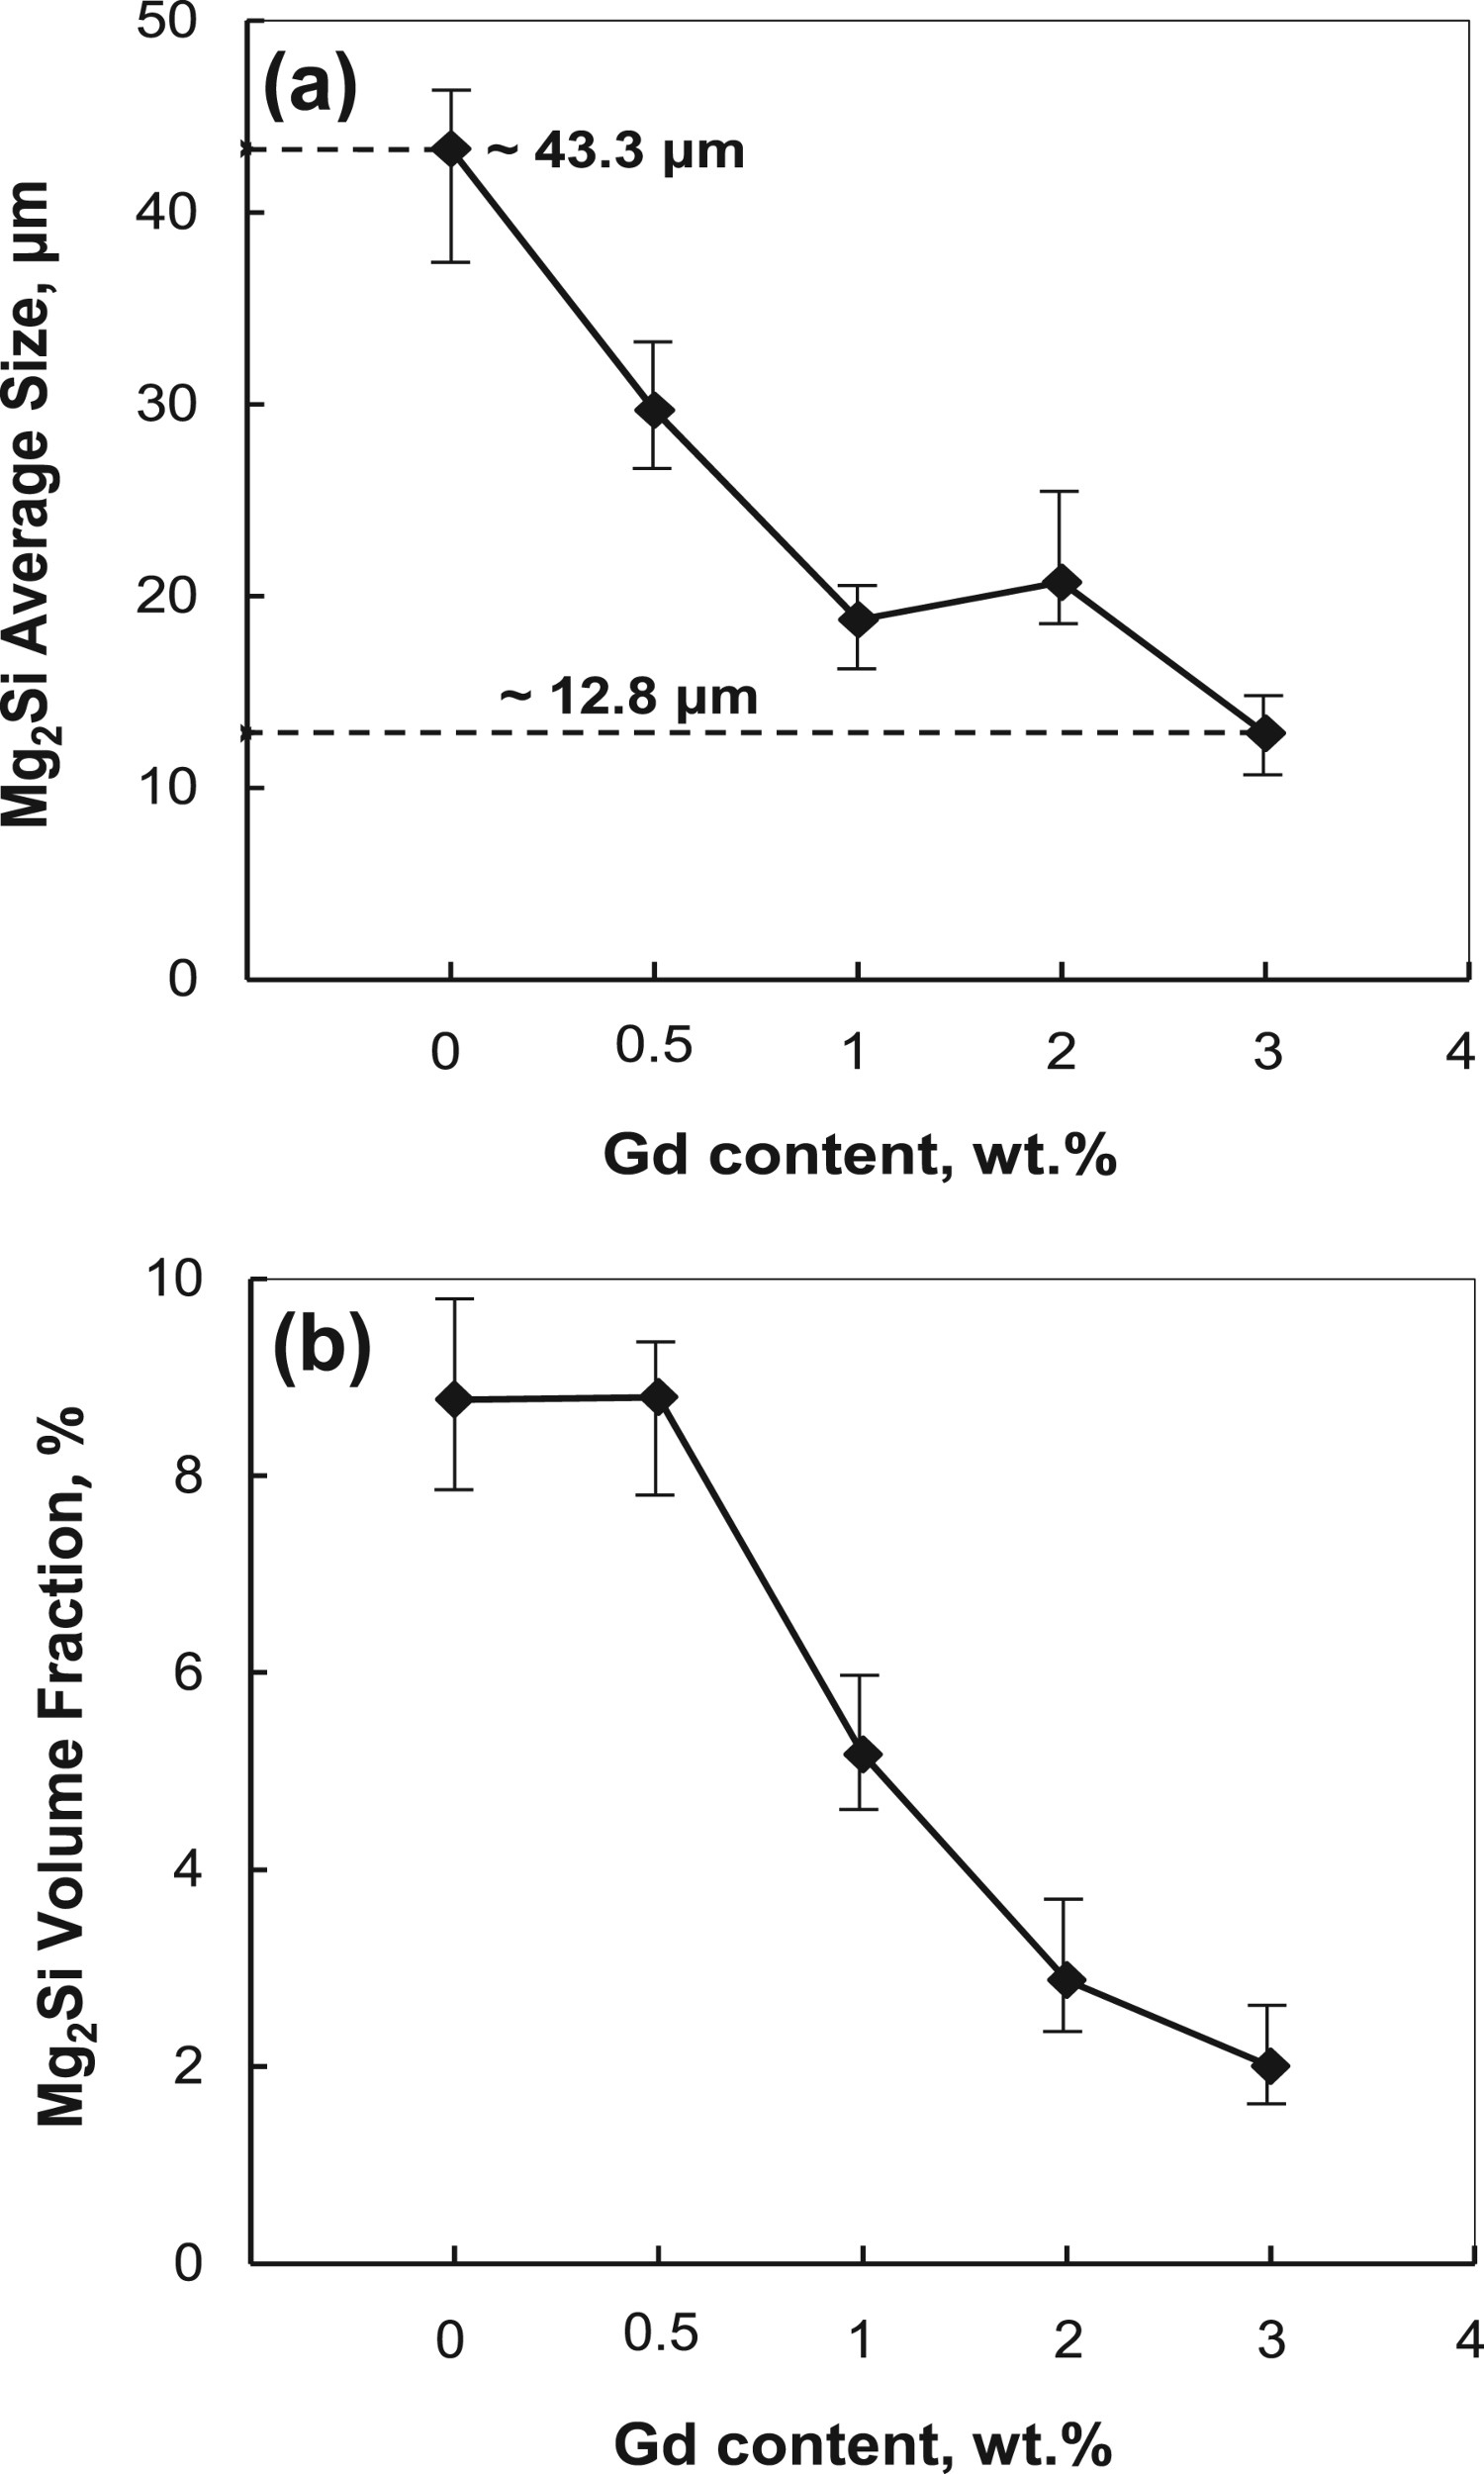
The size distributions of the primary Mg2Si particles in all five composites are shown in Figure 5. It can be observed that the composites with 0, 0.5 and 1 wt% Gd possess a rather skewed histogram with the average sizes of 43.3, 29 and 18 µm, respectively. In contrast, at the higher Gd contents of 2 and 3 wt% the size distribution becomes more normal. Another feature deducible from these histograms is that the mean values of the distributions shift towards the smaller sizes of 21 and 12.8 µm, as the Gd content increases to 2 and 3 wt%, respectively. These findings are in agreement with microstructural observations shown in Figures 3 and 4.
Size distribution of the primary Mg2Si particles in the tested composites.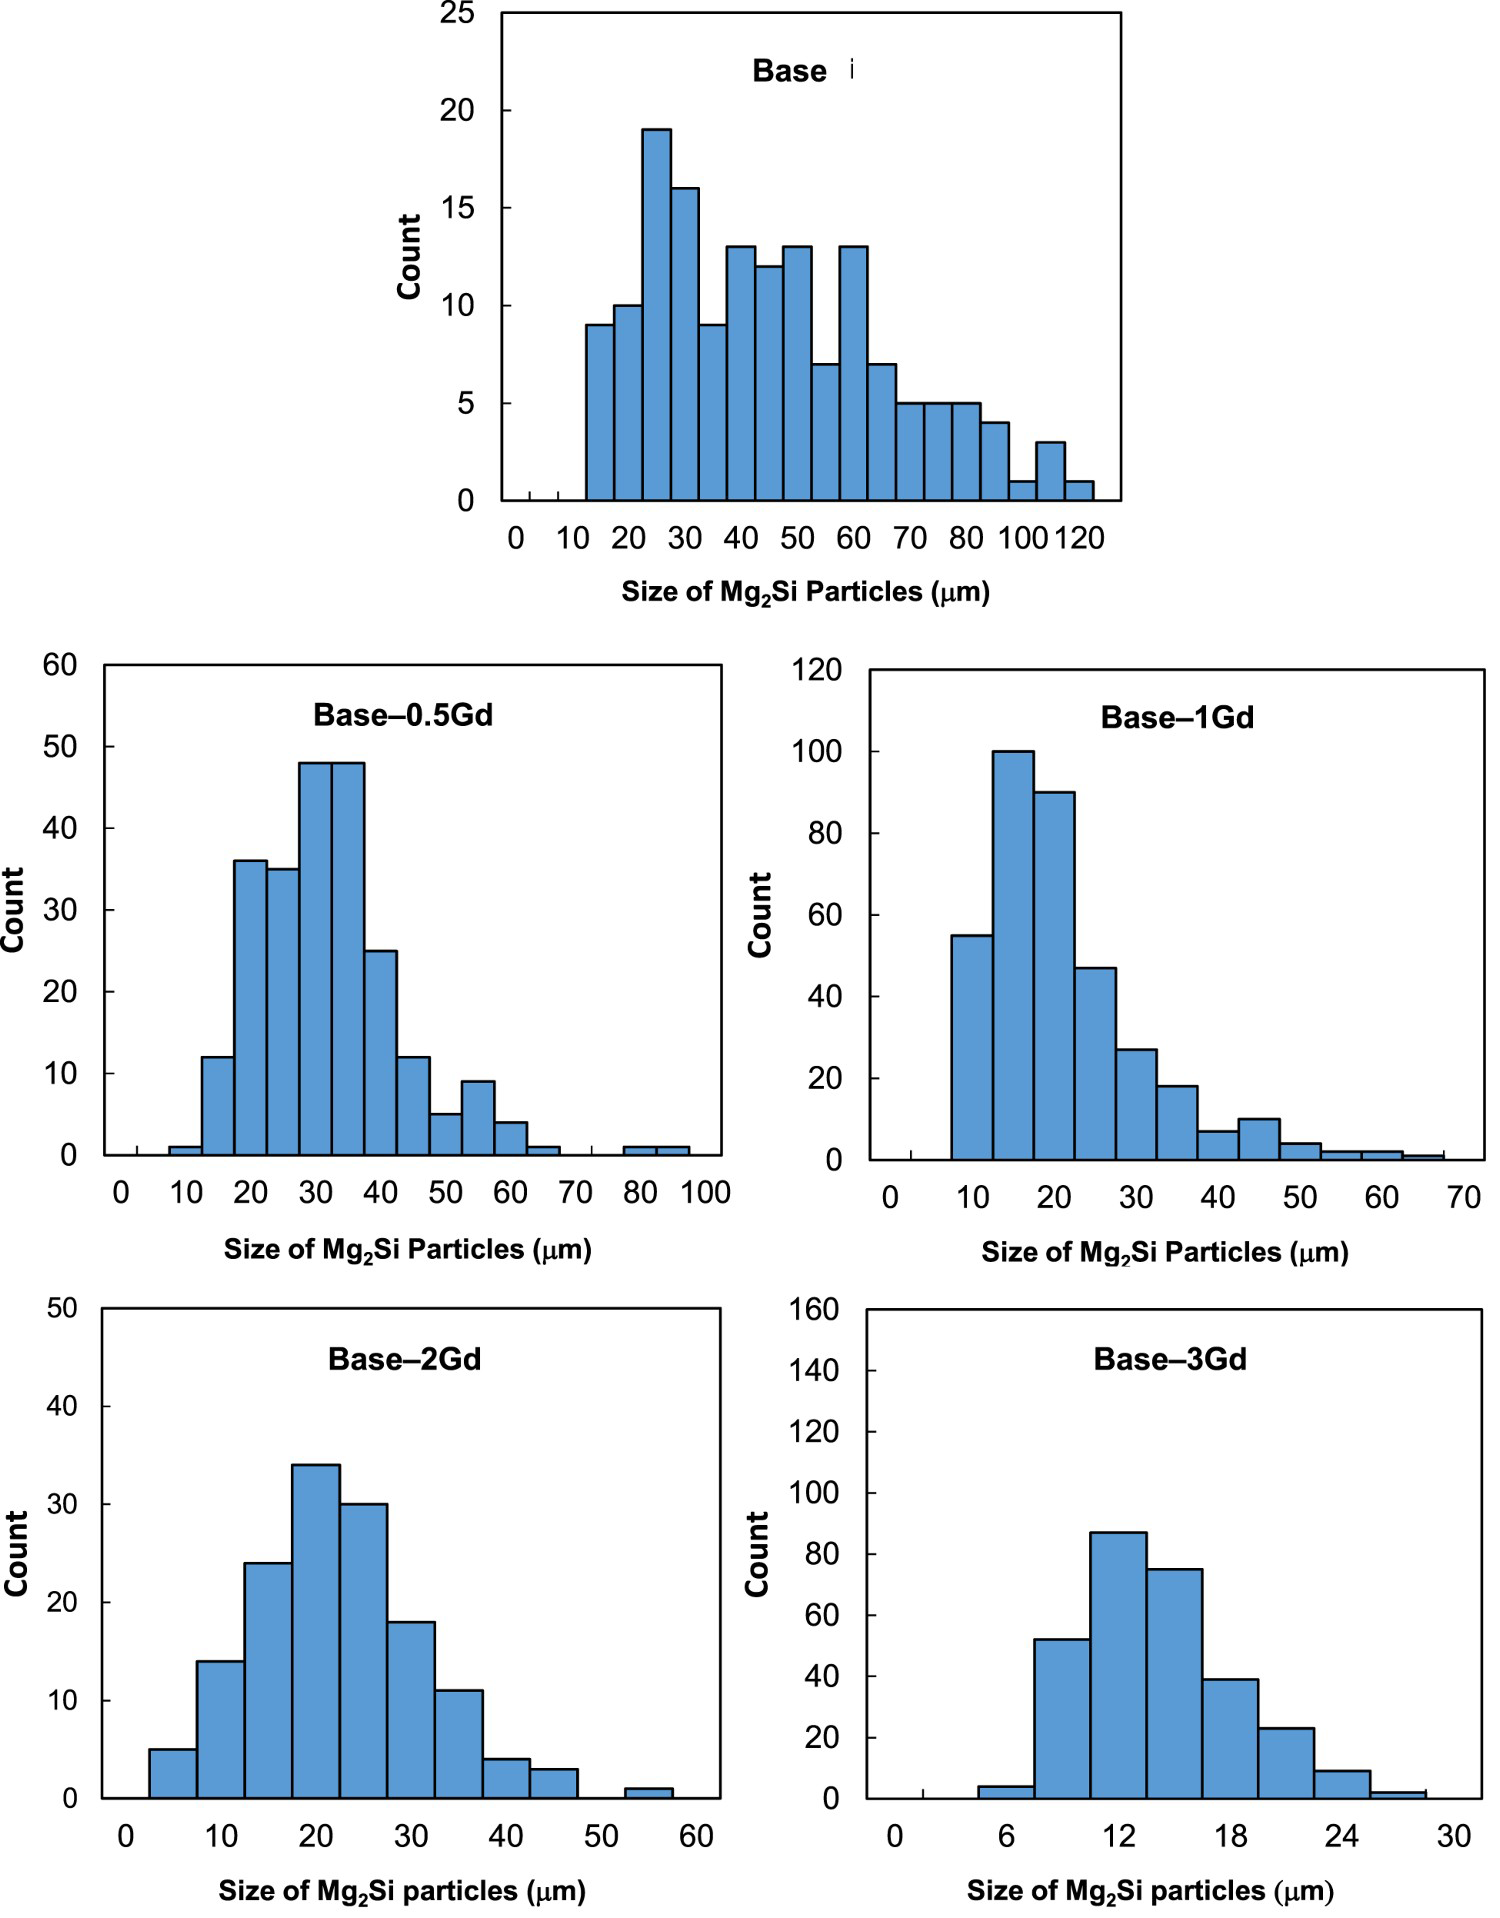
For a better examination of the constitutive phases, SEM images of the base and Gd-containing composites are shown in Figure 6. It is evident that the coarse dendritic shape of the primary Mg2Si particles has been transformed to a finer polygonal type, some of them having rounded edges after Gd addition (Figure 6(b–e)). That is to say, Gd addition refines the primary Mg2Si particles and removes the internal holes of these particles. It is also discernible that the lamellar eutectic structure and the dendritic α–Mg have both been refined. Furthermore, alike OM images, some clusters of the new fine particles having brighter contrasts are visible in the microstructure of the Gd-containing composites. These new fine particles become coarser and more agglomerated as the Gd level reaches 3 wt%. This is concurrent with the decrease in the volume fraction of the primary Mg2Si particles, being in reasonable agreement with the results of Figure 4(b).
SEM micrographs of: (a) Base, (b) Base–0.5Gd, (c) Base–1Gd, (d) Base–2Gd, and (e) Base–3Gd composites.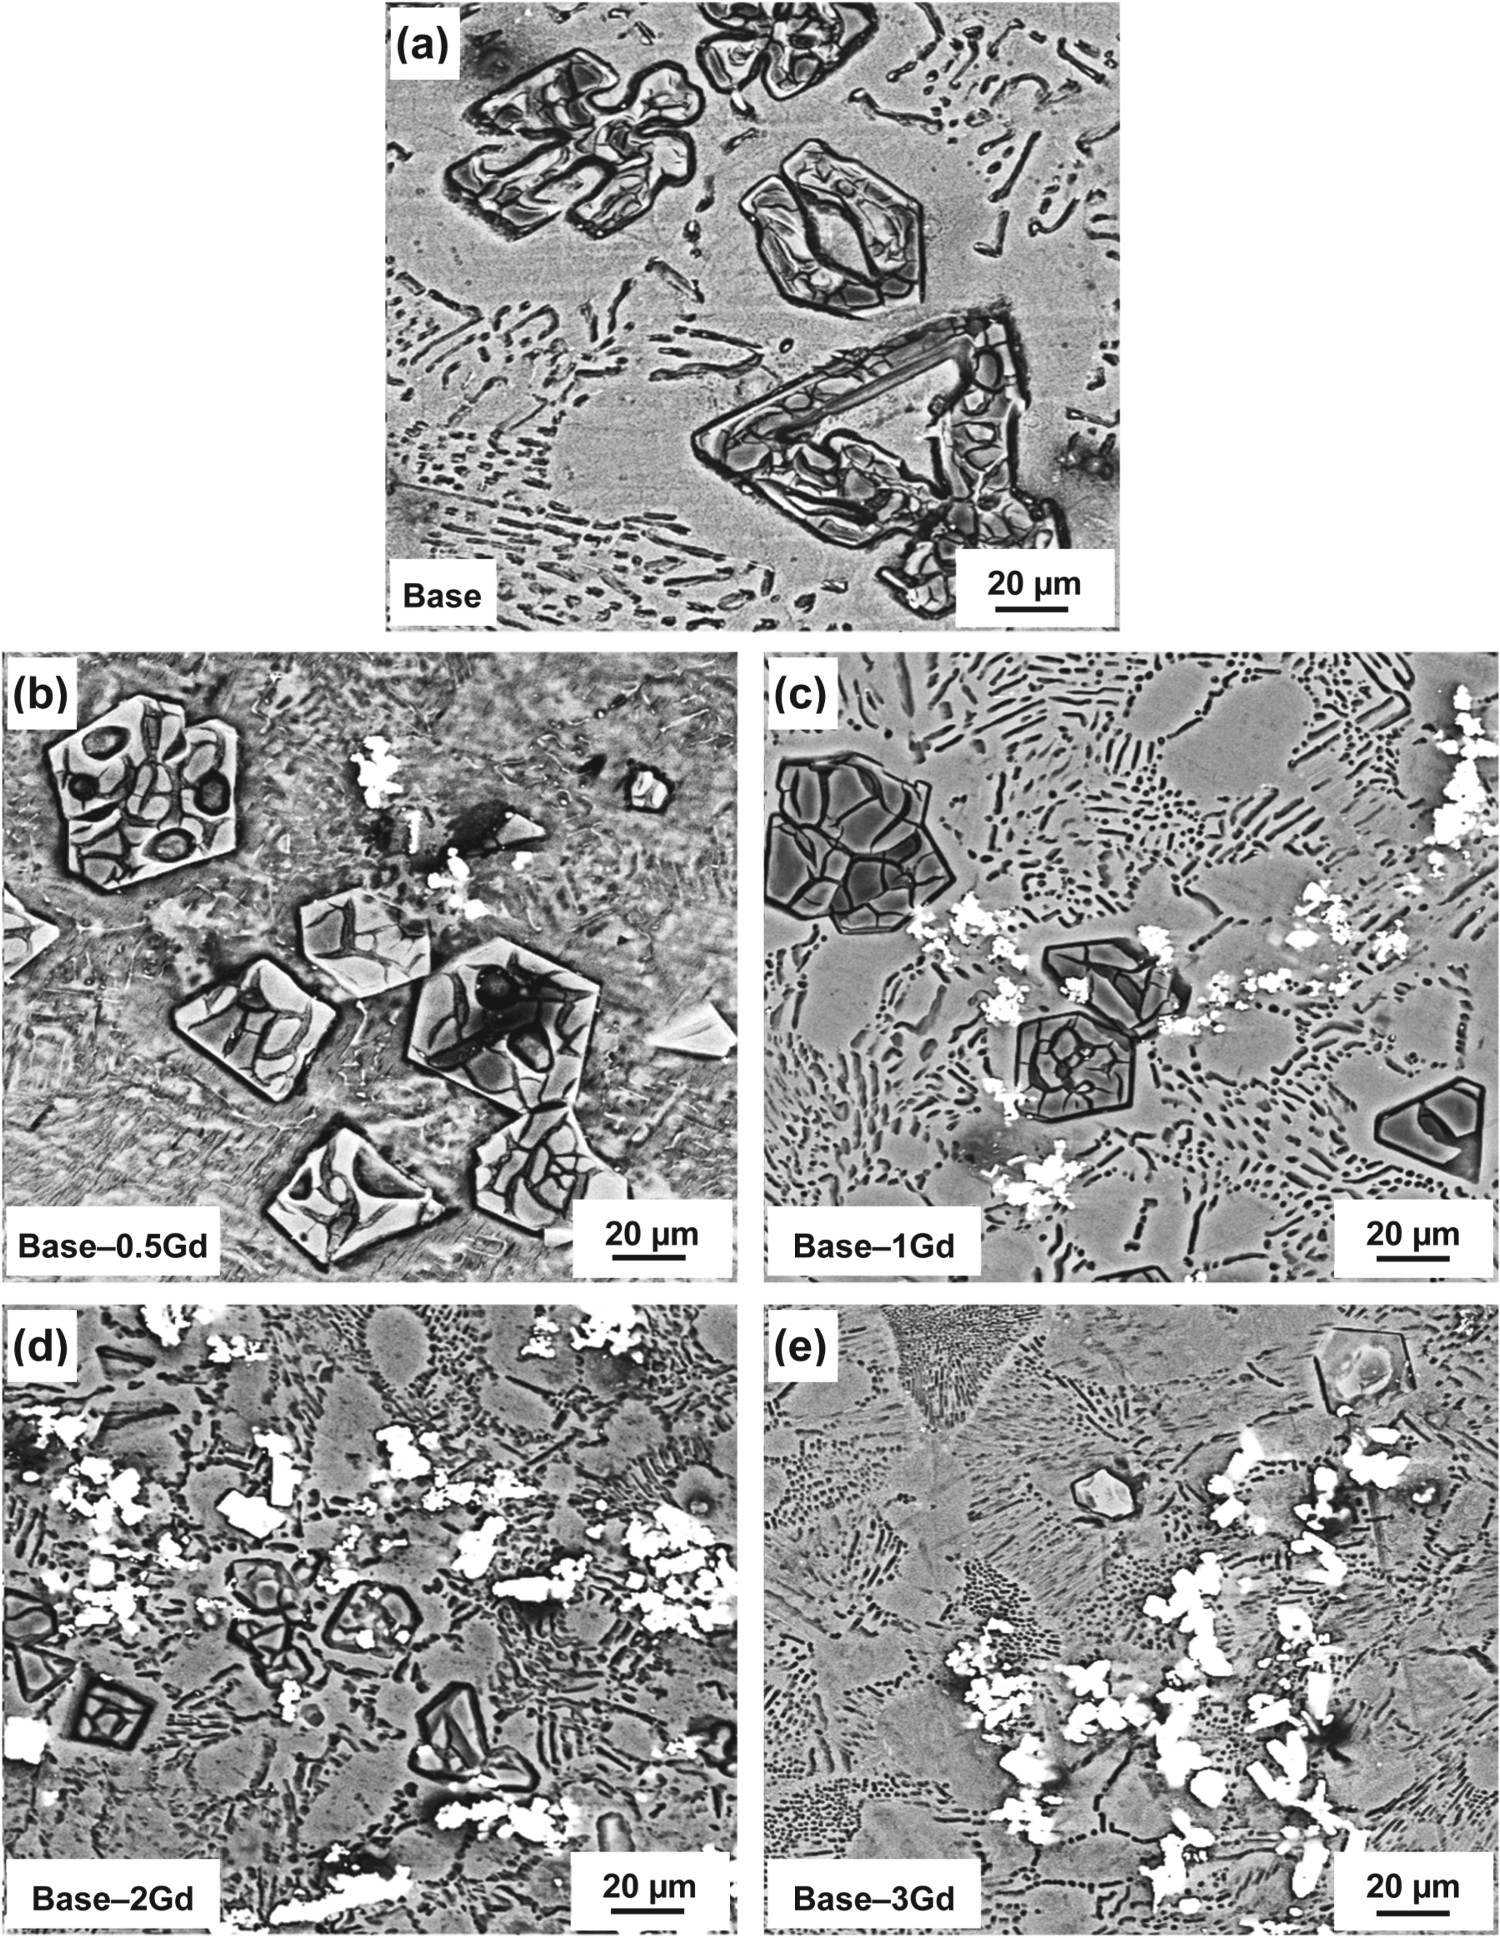
Up to the present time, two main mechanisms of alloy modification are well accepted. One of these mechanisms, called heterogeneous nucleation, is the increase of nucleation sites in the melt. The other, known as poisoning effect, is the suppression of the crystal growth through changing the solidification condition [27,28]. Ye et al. [16] reported that Gd addition can modify the primary Mg2Si particles by the poisoning mechanism, in which the growth of Mg2Si particles is inhibited through the change of the solidification conditions. In the present research, Gd or its compounds poisons the growth sites on the Mg2Si nucleus surface and confines the anisotropic growth of the primary Mg2Si particles.
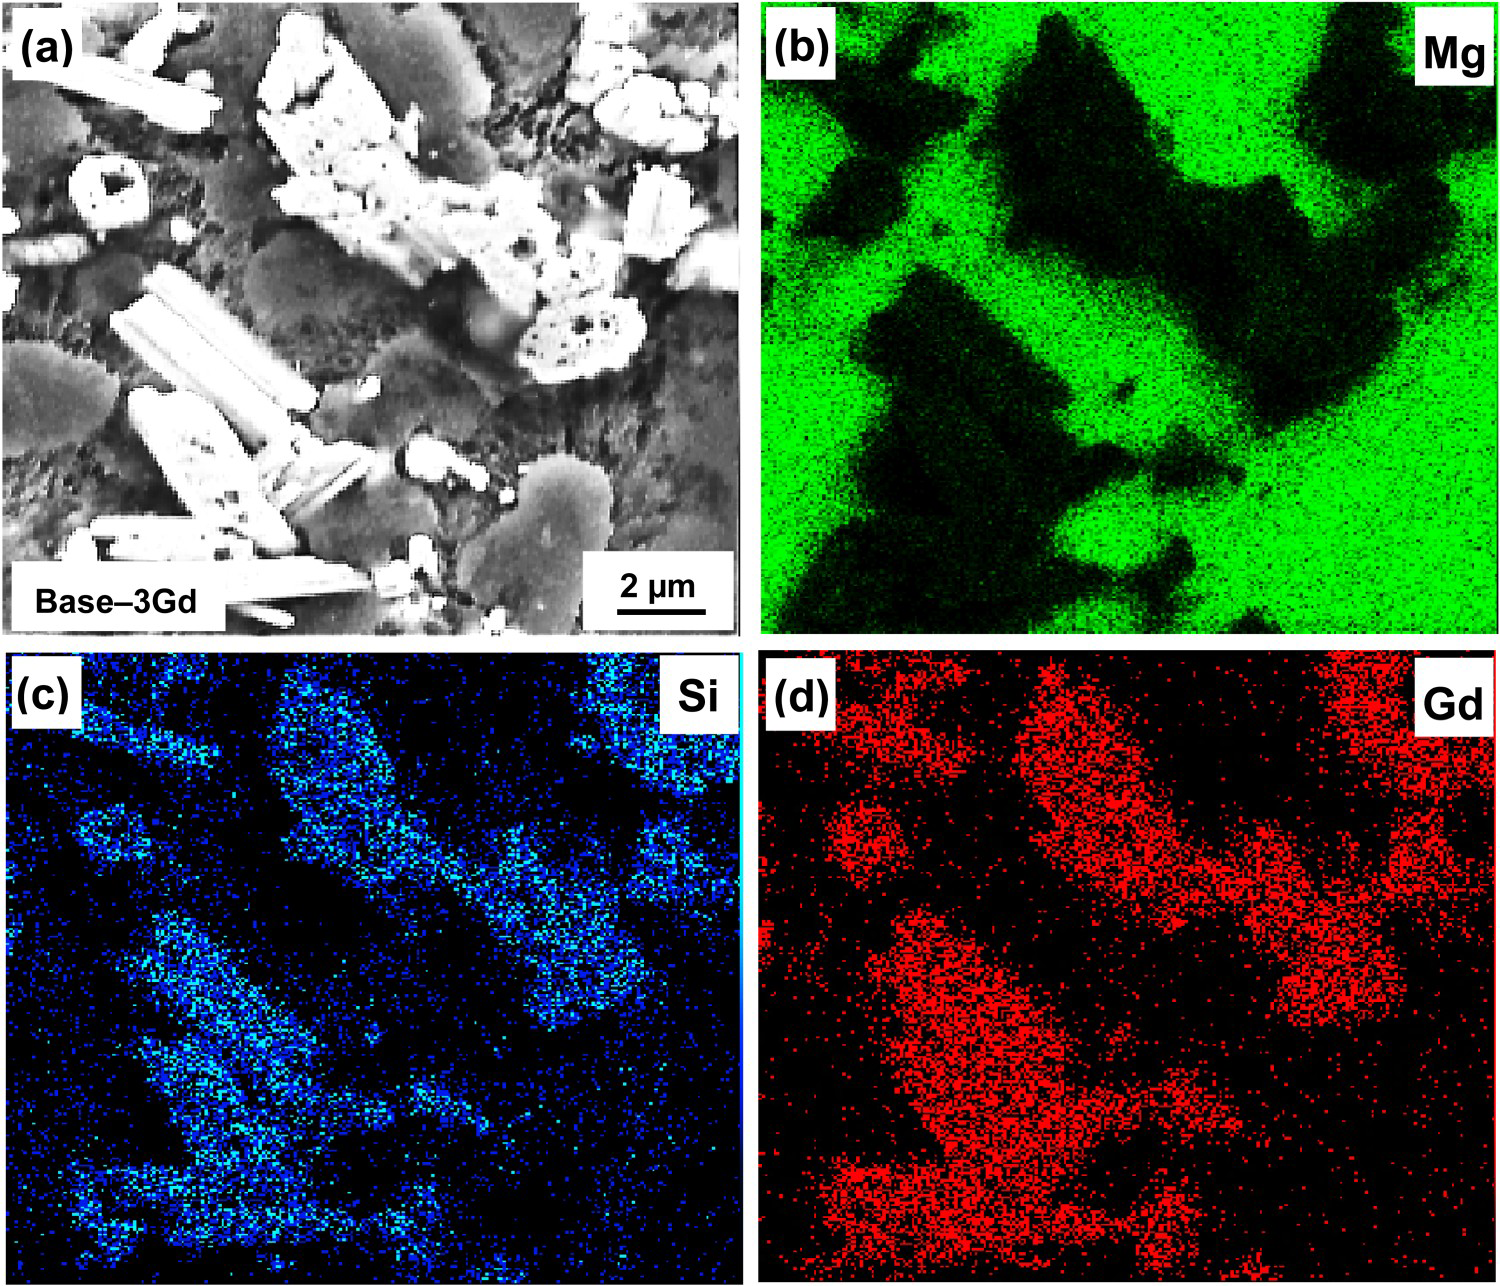
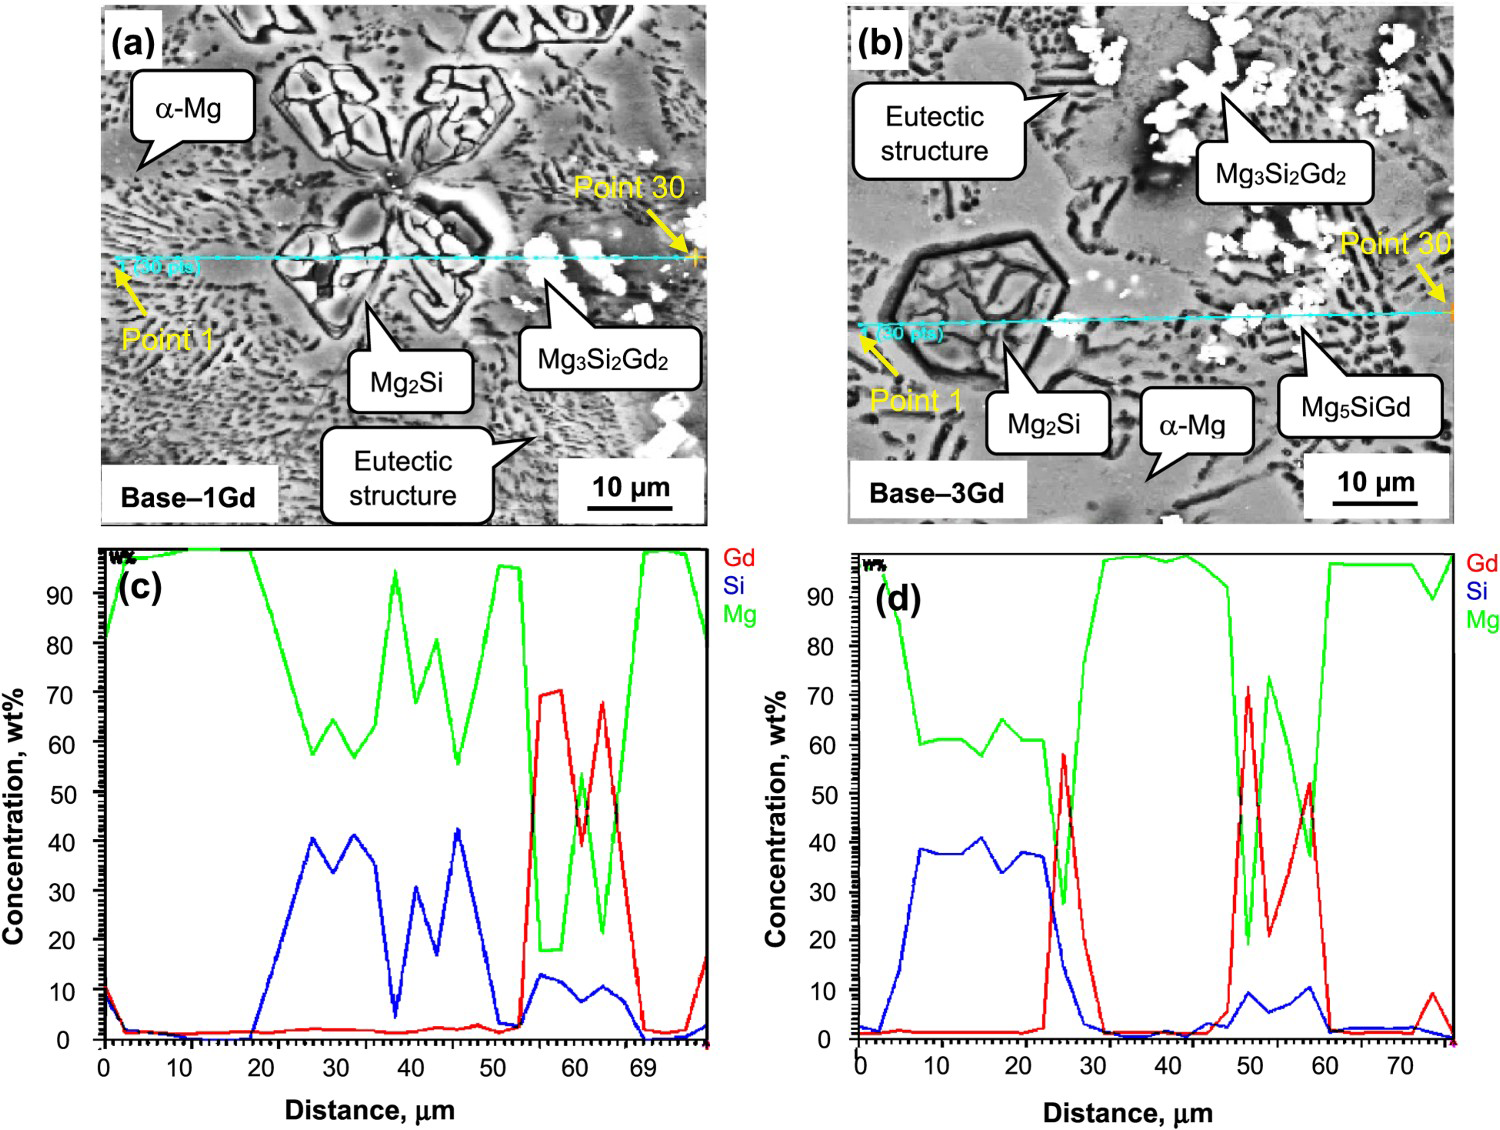
Elemental maps of the composites containing 1 and 3 wt% Gd, shown in Figures 7 and 8, indicate that the bright particles are rich in both Si and Gd, and a small portion of the Gd has been dissolved in the Mg matrix. The observed microstructural features can positively influence the elevated-temperature mechanical properties of the studied materials. For a more accurate determination of the phase compositions, the SEM images, which include all micro-constituents of the composites, are presented in Figure 9(a,b). It can be deduced from SEM image of Figure 9(a) that some coarse block-like bright particles are observed in the Base–1Gd composite, while the microstructure of the Base–3Gd in Figure 9(b) the white particles co-exist with some finer particles with similar contrast. The EDS line scan patterns along the lines passing through different phases are shown in Figure 9(c,d). The mean compositions of the existing phases, determined by EDS line analysis of both Mg–8Mg2Si–1Gd and Mg–8Mg2Si–3Gd composites are tabulated in Table 1, confirming that the block-like phase consists of Mg, Gd and Si. To be specific, the phases corresponding to the coarser and finer particles, based on the respective atomic percentages of Mg–27.3Si–29.5Gd and Mg–15.2Si–14.9Gd, are supposed to be Mg3Si2Gd2 and Mg5SiGd. Similar results have been reported in other researches on materials having similar chemical compositions to the materials in the present investigation [16,17]. The solubility of Si in Mg is 0.003 at%, while that of Gd is 4.41 at% at the eutectic temperature and 0.25 at% at room temperature [29]. Therefore, the absence of Si in the matrix analysis in Table 1 is due to its extremely low solubility limit, while the detected 0.2–0.3 at% Gd is in accordance with the maximum solubility of Gd in Mg. The dissolved Gd in the Mg matrix can contribute to the overall strength of the composite through solid solution hardening mechanism.
(a) SEM micrograph of Base–1Gd composite displaying the dispersion of the phases in the Mg matrix, and the elemental maps of (b) Mg, (c) Si, and (d) Gd. (a) FESEM micrograph of the Base–3Gd composite showing the Gd-containing phase, and the elemental maps of (b) Mg, (c) Si, and (d) Gd in the microstructure. SEM micrograph and EDS line scans of Mg, Si and Gd elements along the scanning line located on an primary Mg2Si particle, Gd-containing phases and matrix region of: (a) Base–1Gd and (b) Base–3Gd composites. The corresponding line analyses are given in (c) and (d), respectively. Average chemical composition of the phases in the Base–1Gd and Base–3Gd composites obtained by EDS in Figure 9.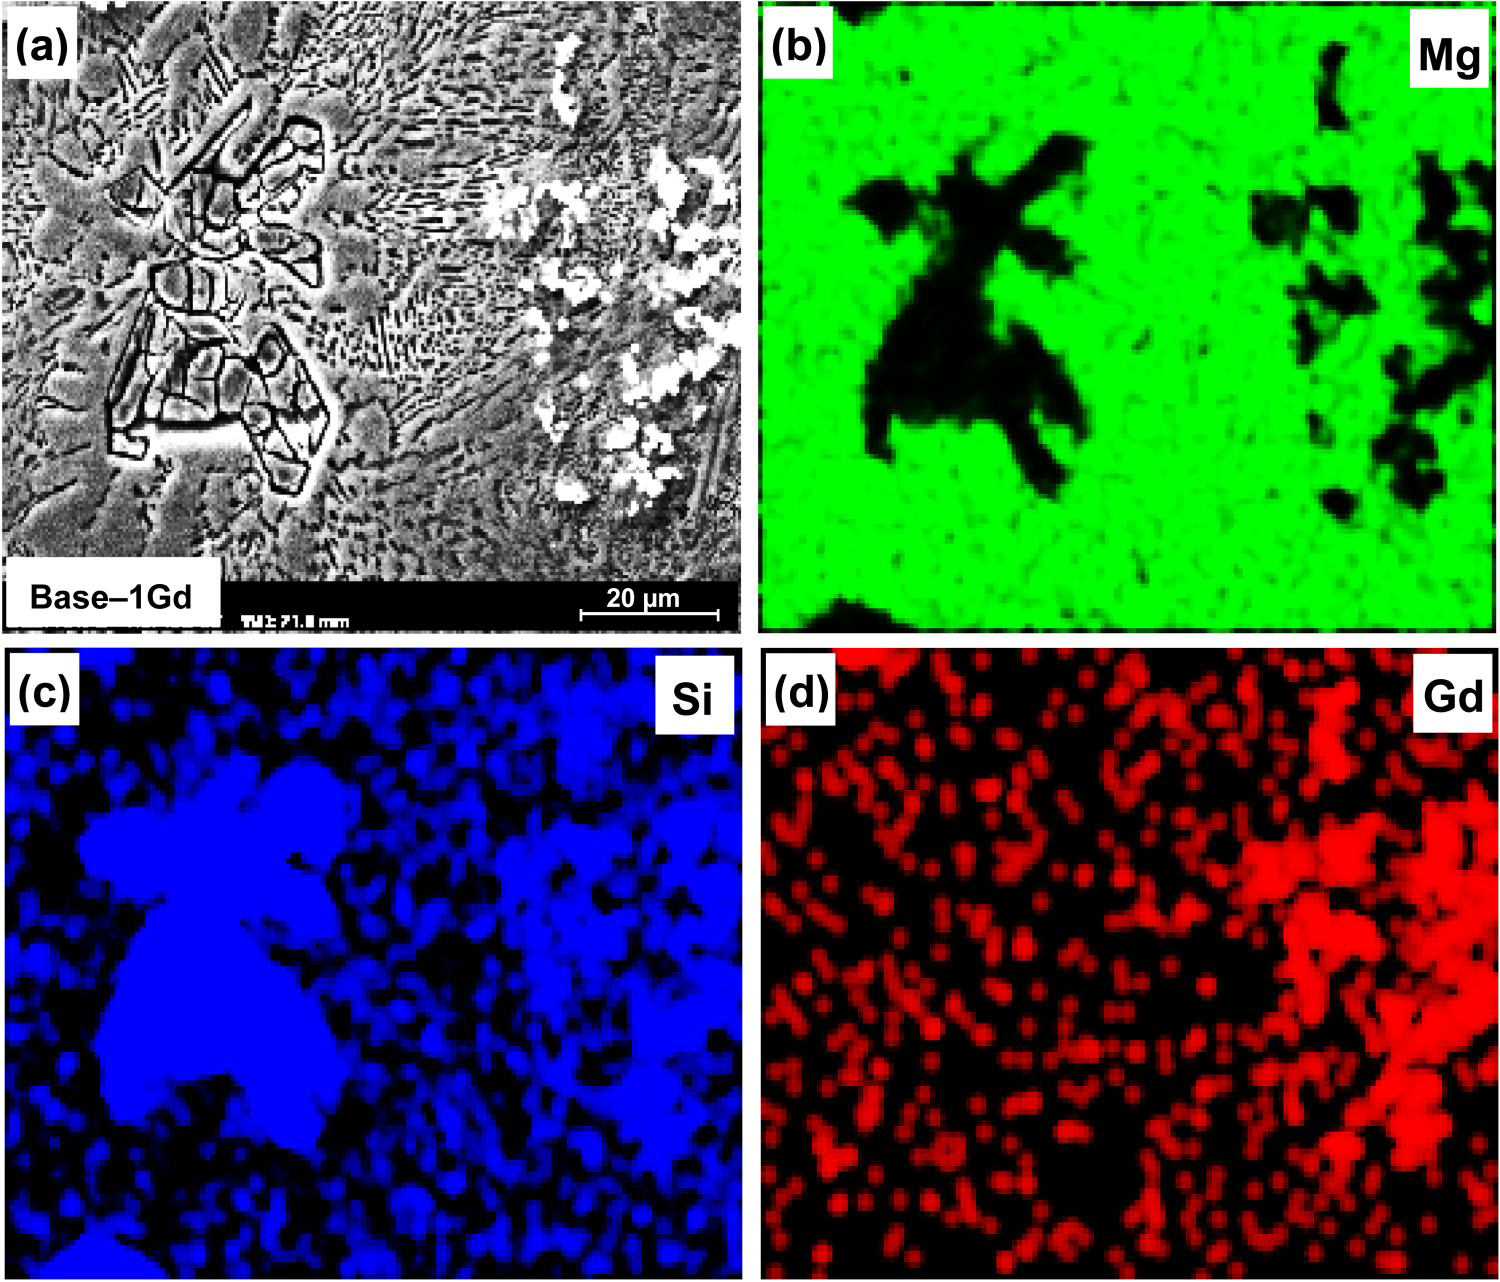
High-temperature mechanical properties
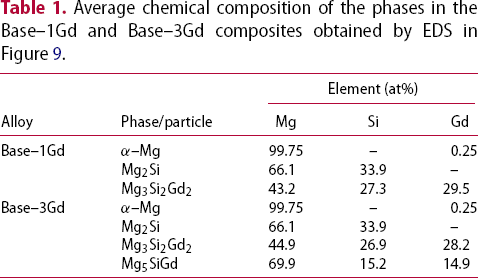
Mechanical properties of the composites were studied by SPT in the temperature range 25–250°C. Typical SPT curves, which show the change of shear stress with normalised displacement of the investigated materials, are shown at different temperatures in Figure 10. Because of the relatively high solidification rate of the melt provided by the steel mould and casting by tilt-casting method, a nearly defect-free casting alloy has been obtained and therefore the SPT data have a high level of reproducibility. It can be inferred that, SPT curves consist of a linear elastic part, followed by a work-hardening region, after which they pass through a maximum value corresponding to the load instability. The point at which the curve deviates from linear elastic behaviour is considered as the shear yield stress (SYS), while the stress at maximum load is taken as the ultimate shear strength (USS). It has been previously shown that these two stress values have good correlations with the tensile yield stress and ultimate tensile strength values obtained in the tensile tests [30]. It is evident that by the Gd addition to the base composite, both SYS and USS of the composites increase. Contrary to this behaviour, ductility of the composites is not significantly affected by the Gd content.
Shear stress-normalised displacement curves of the composites in different temperatures.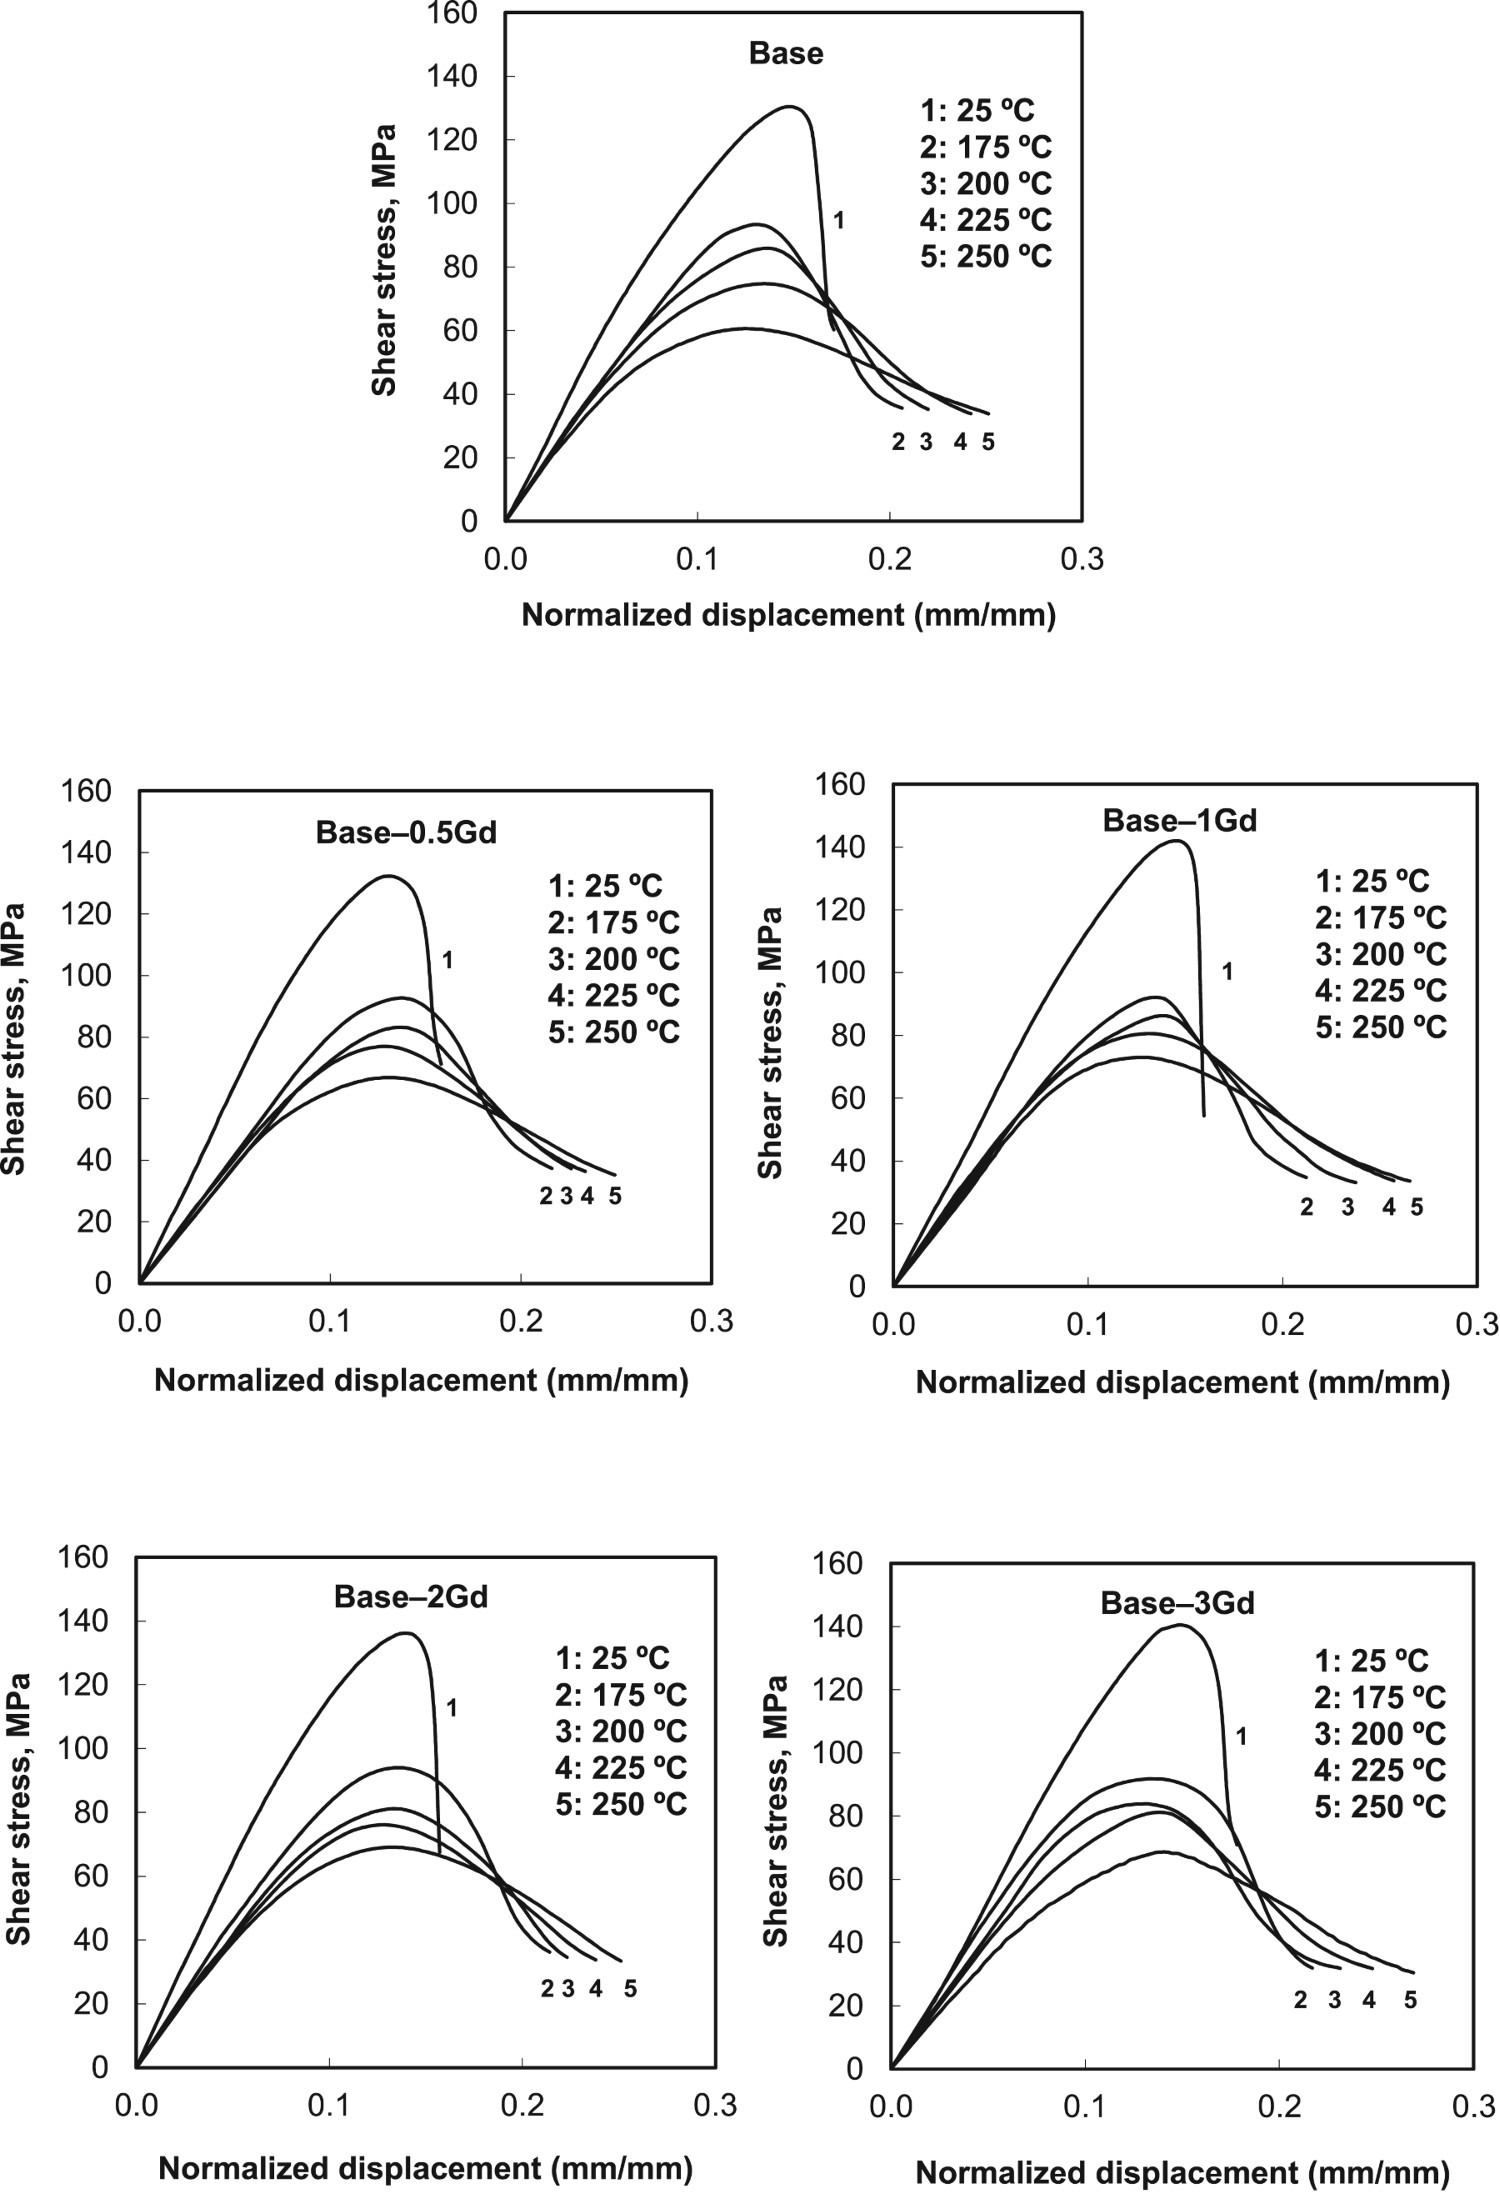
To summarise the influence of Gd on the strength improvement of the base composite at different temperatures, the obtained SYS and USS data have been plotted against test temperature in Figure 11(a,b), respectively. It can be deduced that Gd addition enhances the shear strength of the base composite, the effect that is more noticeable for the 1 wt% Gd addition. Addition of 2 wt% Gd decreases the strength, while further addition of Gd to 3 wt% results in the partial regaining of the strength. Therefore, it can be concluded that for the Mg–8Mg2Si composite the optimum Gd content is 1 wt%. The results also indicate that in all five composites investigated in the present work, both SYS and USS values decrease with increasing the test temperature from 25 to 250°C, due to activation of slip systems, declining of Gd solution hardening effect, and other softening phenomena taking place at elevated testing temperatures. At temperatures below about 200°C, basal slip system is the predominant deformation mechanism, whereas at temperatures above 200°C activation of non-basal slip systems can contribute to the reduction of shear strength.
Variation of: (a) SYS and (b) USS of the composites with test temperature.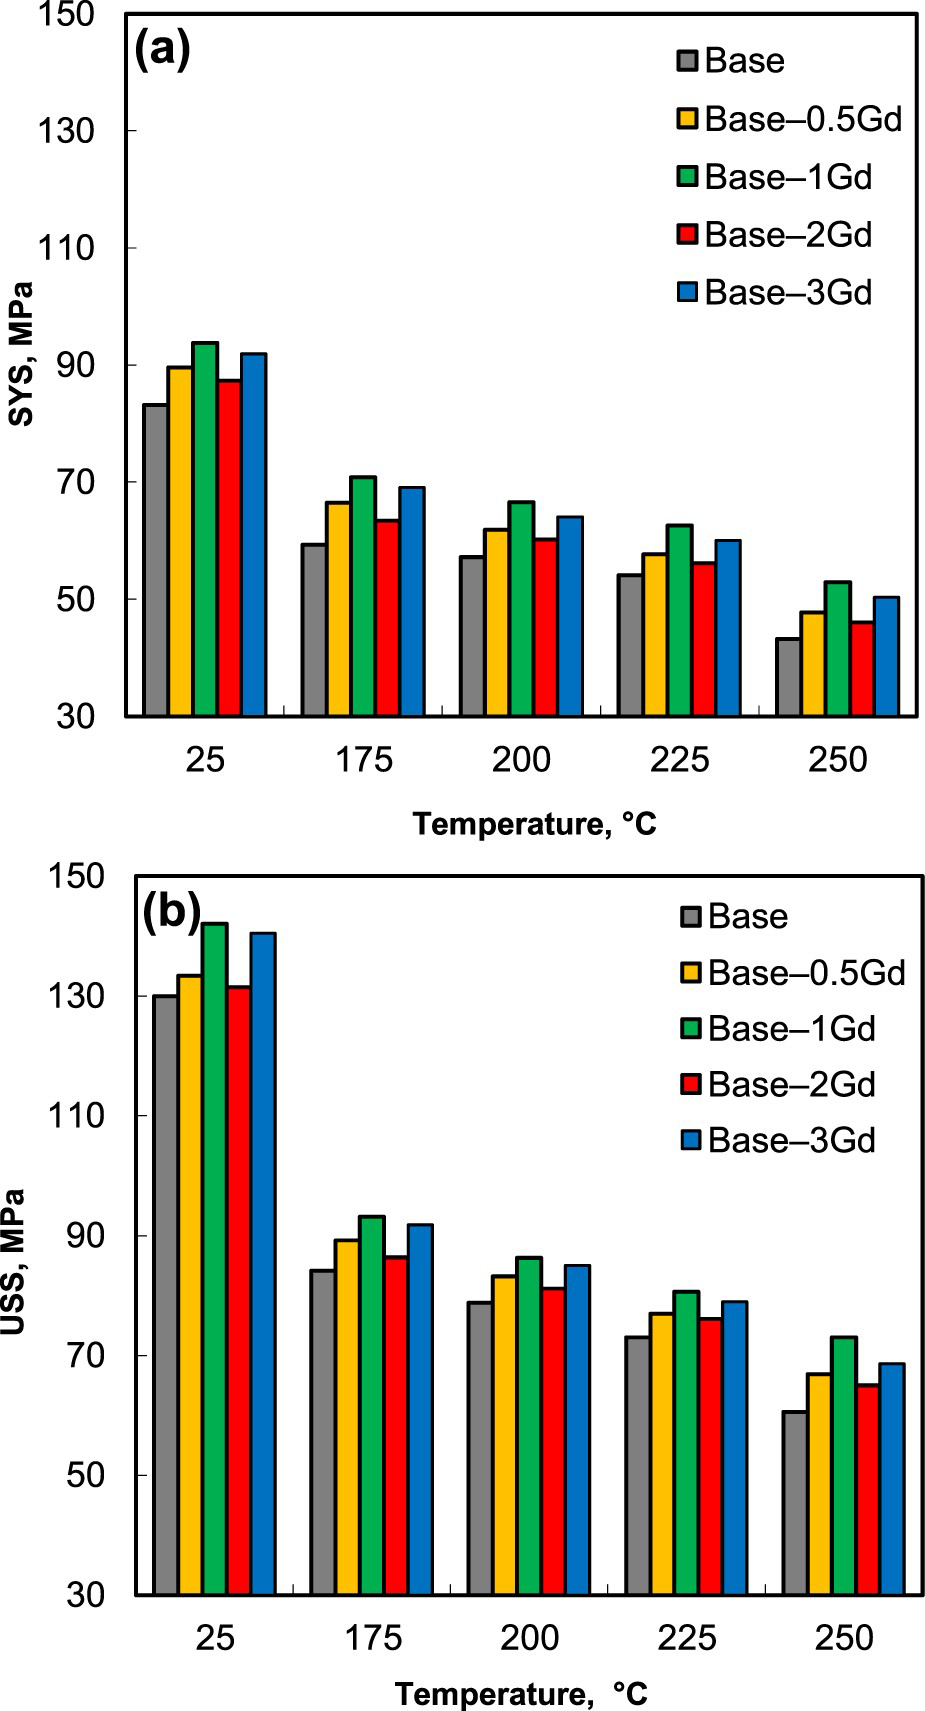
The relative increase in the strength of the base composites after 1 wt% Gd addition could stem from the modified microstructural features. These include the modification of the primary Mg2Si particles morphology from coarse dendritic shape to a finer polygonal type with rounded edges, the refinement of lamellar eutectic structure and the dendritic α–Mg, the formation of solid solution of Gd in α–Mg, and the homogeneous distribution of the primary Mg2Si particles in the microstructure. It is worth stating that alteration of the morphology of the thermally stable primary Mg2Si particles due to the presence of Gd, has the dominant role in the strengthening of the composites. These high melting point particles are primarily responsible for the enhanced strength of the Mg2Si-containing composites at all temperatures.
Fractography
To better understand the effect of Gd addition on the mechanical properties of the composites, the fracture surfaces of the base composite together with the one with 1 wt% Gd, which had already exhibited optimum properties, were investigated. The SEM fracture surfaces of the samples after SPT at room temperature and 250°C are given in Figure 12. In contrast to the study of fracture in tensile tests, in which the two new surfaces are perpendicular to the loading direction, in the SPT the fracture surface is formed along the applied load. This surface has been sheared and cut by the cutting edge of the penetrating cylindrical punch. Therefore, it is expected that the appearance of fracture surface to be different from those of the tensile test, which show typical ductile and brittle behaviours, characterised by dimples and beach marks, respectively.
SEM fractographs of the Base and Base–1Gd composites after SPT at 25 and 250°C.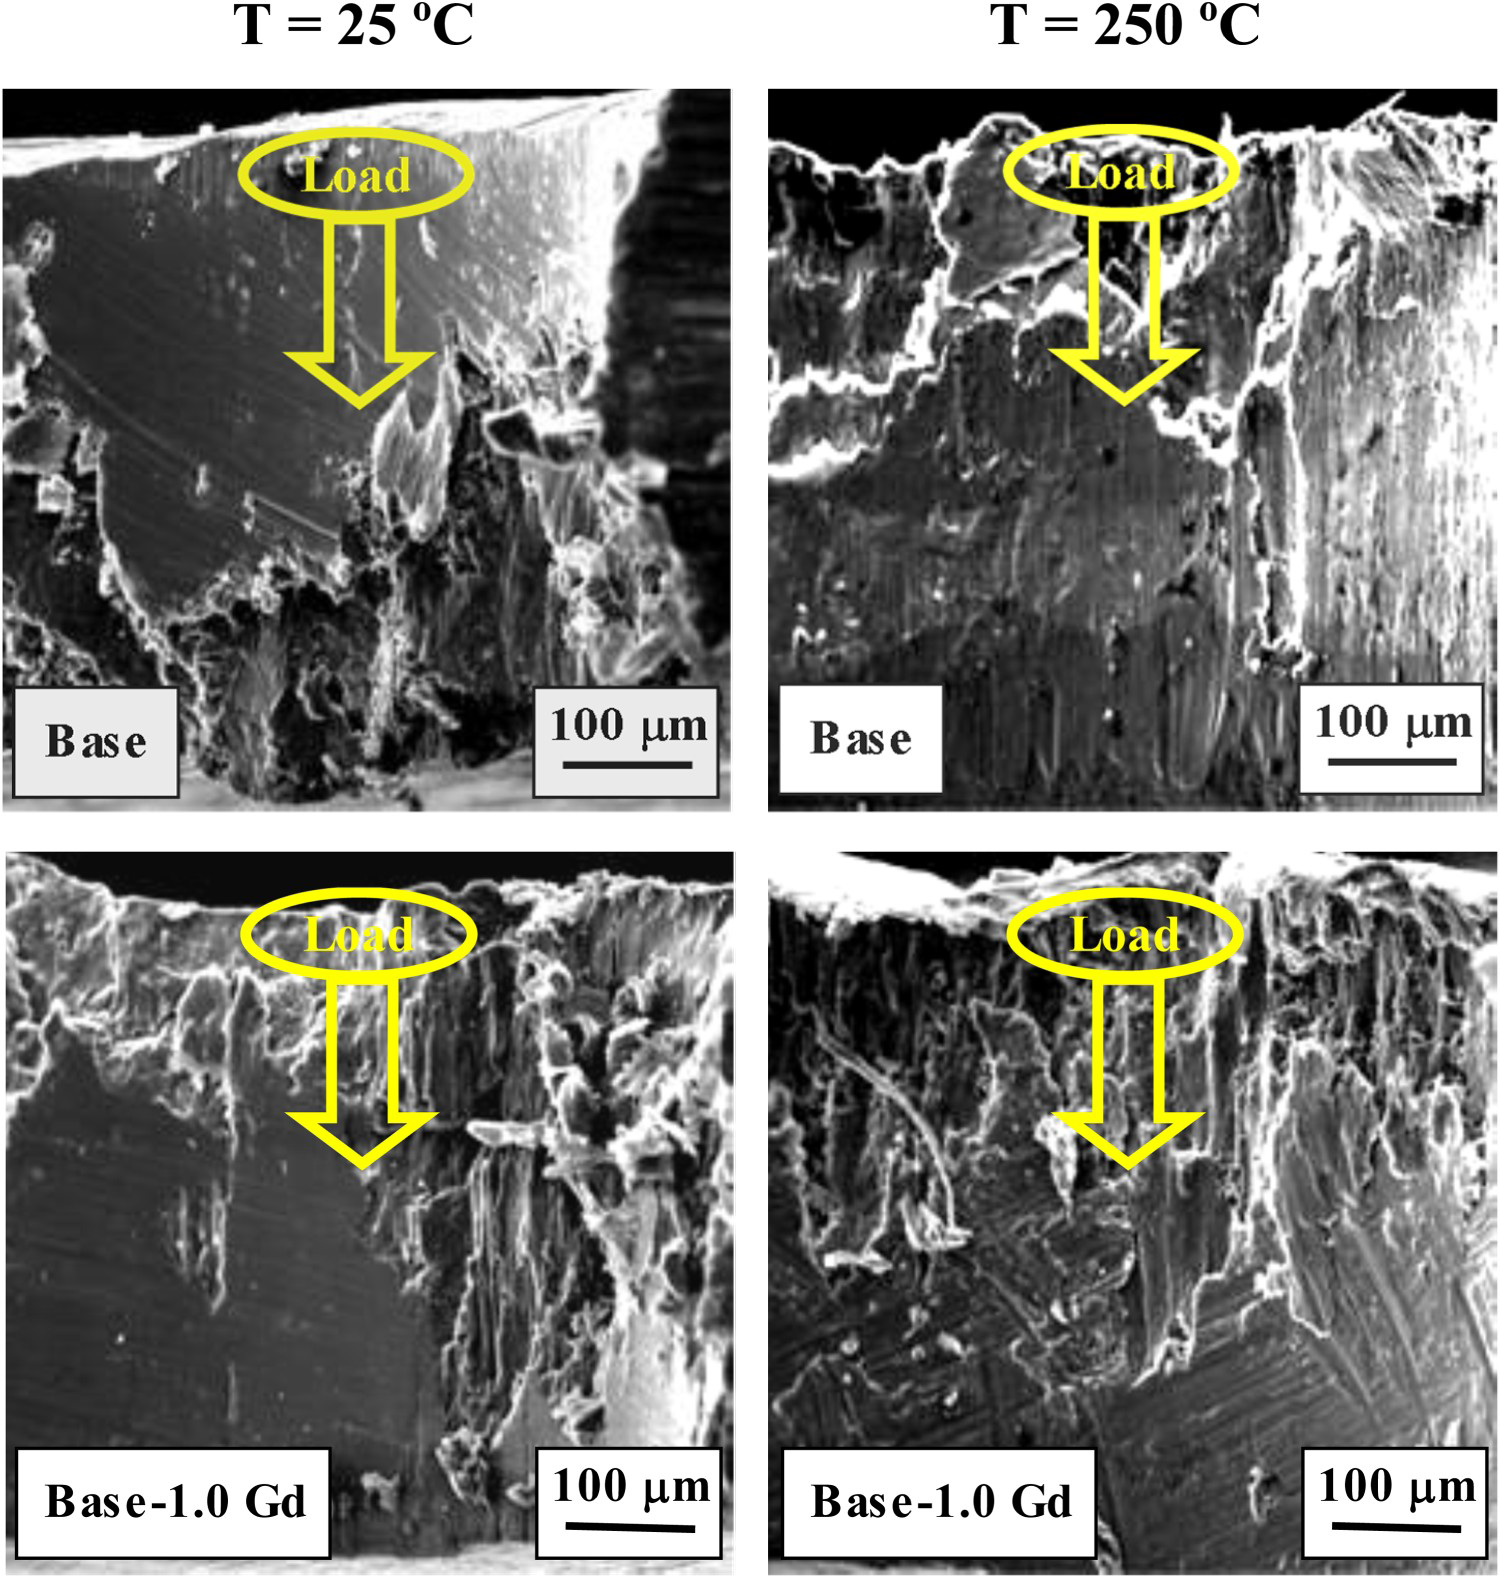
In Figure 12, the fractographic examination of the Base and Base–1Gd composites after SPT at room temperature is indicative of rough surfaces, which have been formed by the detachment of particles, constituting limited plastic deformation. In the Gd-containing composite, however, some river patterns and tearing edges have appeared, resulting in a semi-cleavage fracture with slightly lower ductility. The observed room-temperature behaviour is in contrast to that of the elevated temperature, in which the fracture surfaces are mostly fibrous, providing significant plastic deformation before failure. Here, there is no sign of dimples, as the penetrating punch has already wiped them out by shearing the fractured surface. Therefore, it can be concluded that Gd addition has insignificant detrimental effect on the ductility of the composite at room temperature, the effect that is absent at high temperatures. These observations are in agreement with the measured ductility values of the composites deduced from the SPT curves in Figure 10, where the superior ductility of the composites at high temperature is evident.
Conclusions
The following results were obtained after investigating the microstructural evolution and high-temperature mechanical characteristics of a cast Mg–8Mg2Si in situ composite with Gd additions:
The microstructure of the Mg–8Mg2Si base composite consists of coarse dendritic primary Mg2Si particle and lamellar (α–Mg + Mg2Si) eutectic structures in the α–Mg matrix. Addition of Gd modified the shape of the Mg2Si particles from coarse dendritic to a finer polygonal morphology by the poisoning effect, and the size distribution of these particles became homogeneous, resulting in the formation of Gd-containing second phases with blocky-shape morphology. The average volume fraction and size of the Mg2Si particles decreased with increasing Gd content up to 1 wt%. When the Gd content reached 2 wt% the average size of the Mg2Si particles slightly increased, due to the over-modification phenomenon. Gd-containing intermetallic compounds were coarser and more agglomerated as the Gd content reached 3 wt%. Gd additions enhanced the high-temperature mechanical characteristics of the base composite at all temperatures. The Mg–8Mg2Si–1Gd composite possessed the highest shear strength, which was ascribed to the refinement of the eutectic structure, formation of the finer polygonal Mg2Si particles, and reduction of their average size. The Mg–8Mg2Si–2Gd composite showed reduced strength because of the coarser Mg2Si particles caused by the over-modification of Gd. Further addition of Gd content to 3 wt%, however, resulted in more refinement of the primary Mg2Si particles and formation of Mg5SiGd intermetallics, both of which increasing the strength of the composites.
Footnotes
Disclosure statement
No potential conflict of interest was reported by the author(s).
Correction Statement
This article has been corrected with minor changes. These changes do not impact the academic content of the article.