
Abstract
Iron–tungsten/TiO2 nanotube photoelectrodes have been synthesised by the anodisation process followed by the chemical bath deposition technique in this work. X-ray diffraction analysis, field emission scanning electron microscopy, UV–Vis, energy-dispersive X-ray spectroscopy and photoelectrochemical (PEC) measurements have been used to characterise these photoelectrodes. The ratio of the iron–tungsten deposited on TiO2 nanotubes remarkably influences the PEC performance and the amount of hydrogen. The A1 photoelectrode showed the best PEC activity. The investigation of the recyclability of these new TiO2 nanotubes indicated good stability of their photocatalytic activity. A simple method for the synthesis of high-performance PEC photoelectrodes with good stability and reliability has been provided by this work.
Introduction
Investigation of photoelectrochemical (PEC) water splitting to produce clean hydrogen energy from renewable solar energy and water, which is a promising method to deal with increasingly serious problems of energy crisis and environmental degradation, has been extensively carried out in recent years [1-3]. Given its low-cost, non-toxicity, physicochemical stability, powerful optical absorption and superior photocatalytic activity, titanium dioxide (TiO2) has received more attention in photochemistry and photocatalysis compared with other semiconductors [4-8]. However, only ultraviolet (UV) light, which merely covers 2–4% of the solar spectrum due to its wide band gap of ca. 3.2 eV, can excite pure TiO2 nanomaterial. Moreover, the high recombination rate of photoinduced electron hole pairs greatly lowers its photocatalytic activity [4-8]. Vertically oriented, one-dimensional TiO2 nanotubes formed by anodisation of titanium substrates in fluorinated electrolytes have proved to be promising candidates, and logically promoted a good chance for the separation and transfer of charge carriers given their strong light harvest scattering property and slow recombination rate of photoinduced charge carriers [9-11]. Considering the simplicity in the preparation of highly ordered, one-dimensional TiO2 nanostructures, their aligned perpendicularity to the substrate, high internal area and other interesting properties, TiO2 nanotubes have been of remarkable interest [12-14]. There are many methods to improve the performance of anodic oxides such as doping [15,16], in situ doping [17,18], co-sensitised [19,20], and ultrasound-assisted impregnation deposition [21]. A simple process for the preparation of tungsten–iron/TiO2 nanotube photoelectrode for the PEC water splitting process has been developed in this work. The molar ratios of tungsten and iron in CBD solutions determine the morphology, optical properties and photoelectrochemical (PEC) performance of the new TiO2 samples. A new pattern for the development of efficient, yet long-term recyclable photoanodes for PEC water splitting is provided by this work. The preparation of tungsten–iron, co-deposited TiO2 nanotubes by anodisation and chemical bath deposition processes and application of these new samples as photoanodes in PEC cells for PEC hydrogen generation has not been reported so far.
Experimental
The experimental parameters for the synthesis of different samples.
Field emission scanning electron microscopy (FESEM, Hitachi S-4160, Japan) was used to characterise the surface morphology and microstructure of different iron–tungsten/TiO2 nanotubes. Energy-dispersive X-ray spectroscopy (EDX) was used to estimate the elemental composition of these nanotubes. X-ray diffraction analysis (XRD, Philips X'Pert PRO) was used to analyse the crystal structure of the samples using Cu K radiation. UV–Vis spectrophotometry (JASCO V-570) was used to measure the optical absorption property of the samples. Photocurrent measurements were carried out on an Origaflex electrochemical working station (OGF500 potentiostat/galvanostat, France). A standard three-electrode system was employed using Pt foil, saturated Ag/AgCl and iron–tungsten/TiO2 nanotubes as counter, working and reference electrodes, respectively.
A 1 M KOH aqueous solution containing 5 vol.-% ethylene glycol was used as the electrolyte. A 55 W xenon lamp was used to provide light irradiation. The light luminous intensity was 200 mW cm−2. Potentials were provided with respect to the Ag/AgCl electrode. The electrode photocurrent responses were measured at 0.6 V vs. the Ag/AgCl electrode. The hydrogen gas generated from samples using a 55 W xenon lamp illumination was collected by the water displacement technique. Hydrogen gas was formed at the counter electrode in the PEC cell. The platinum cathode was inserted into a burette, in which H2 gas was collected by electrolyte displacement. Hydrogen volume measurement was directly performed via reading the electrolyte level variations in the burette at different time intervals.
Results and discussion
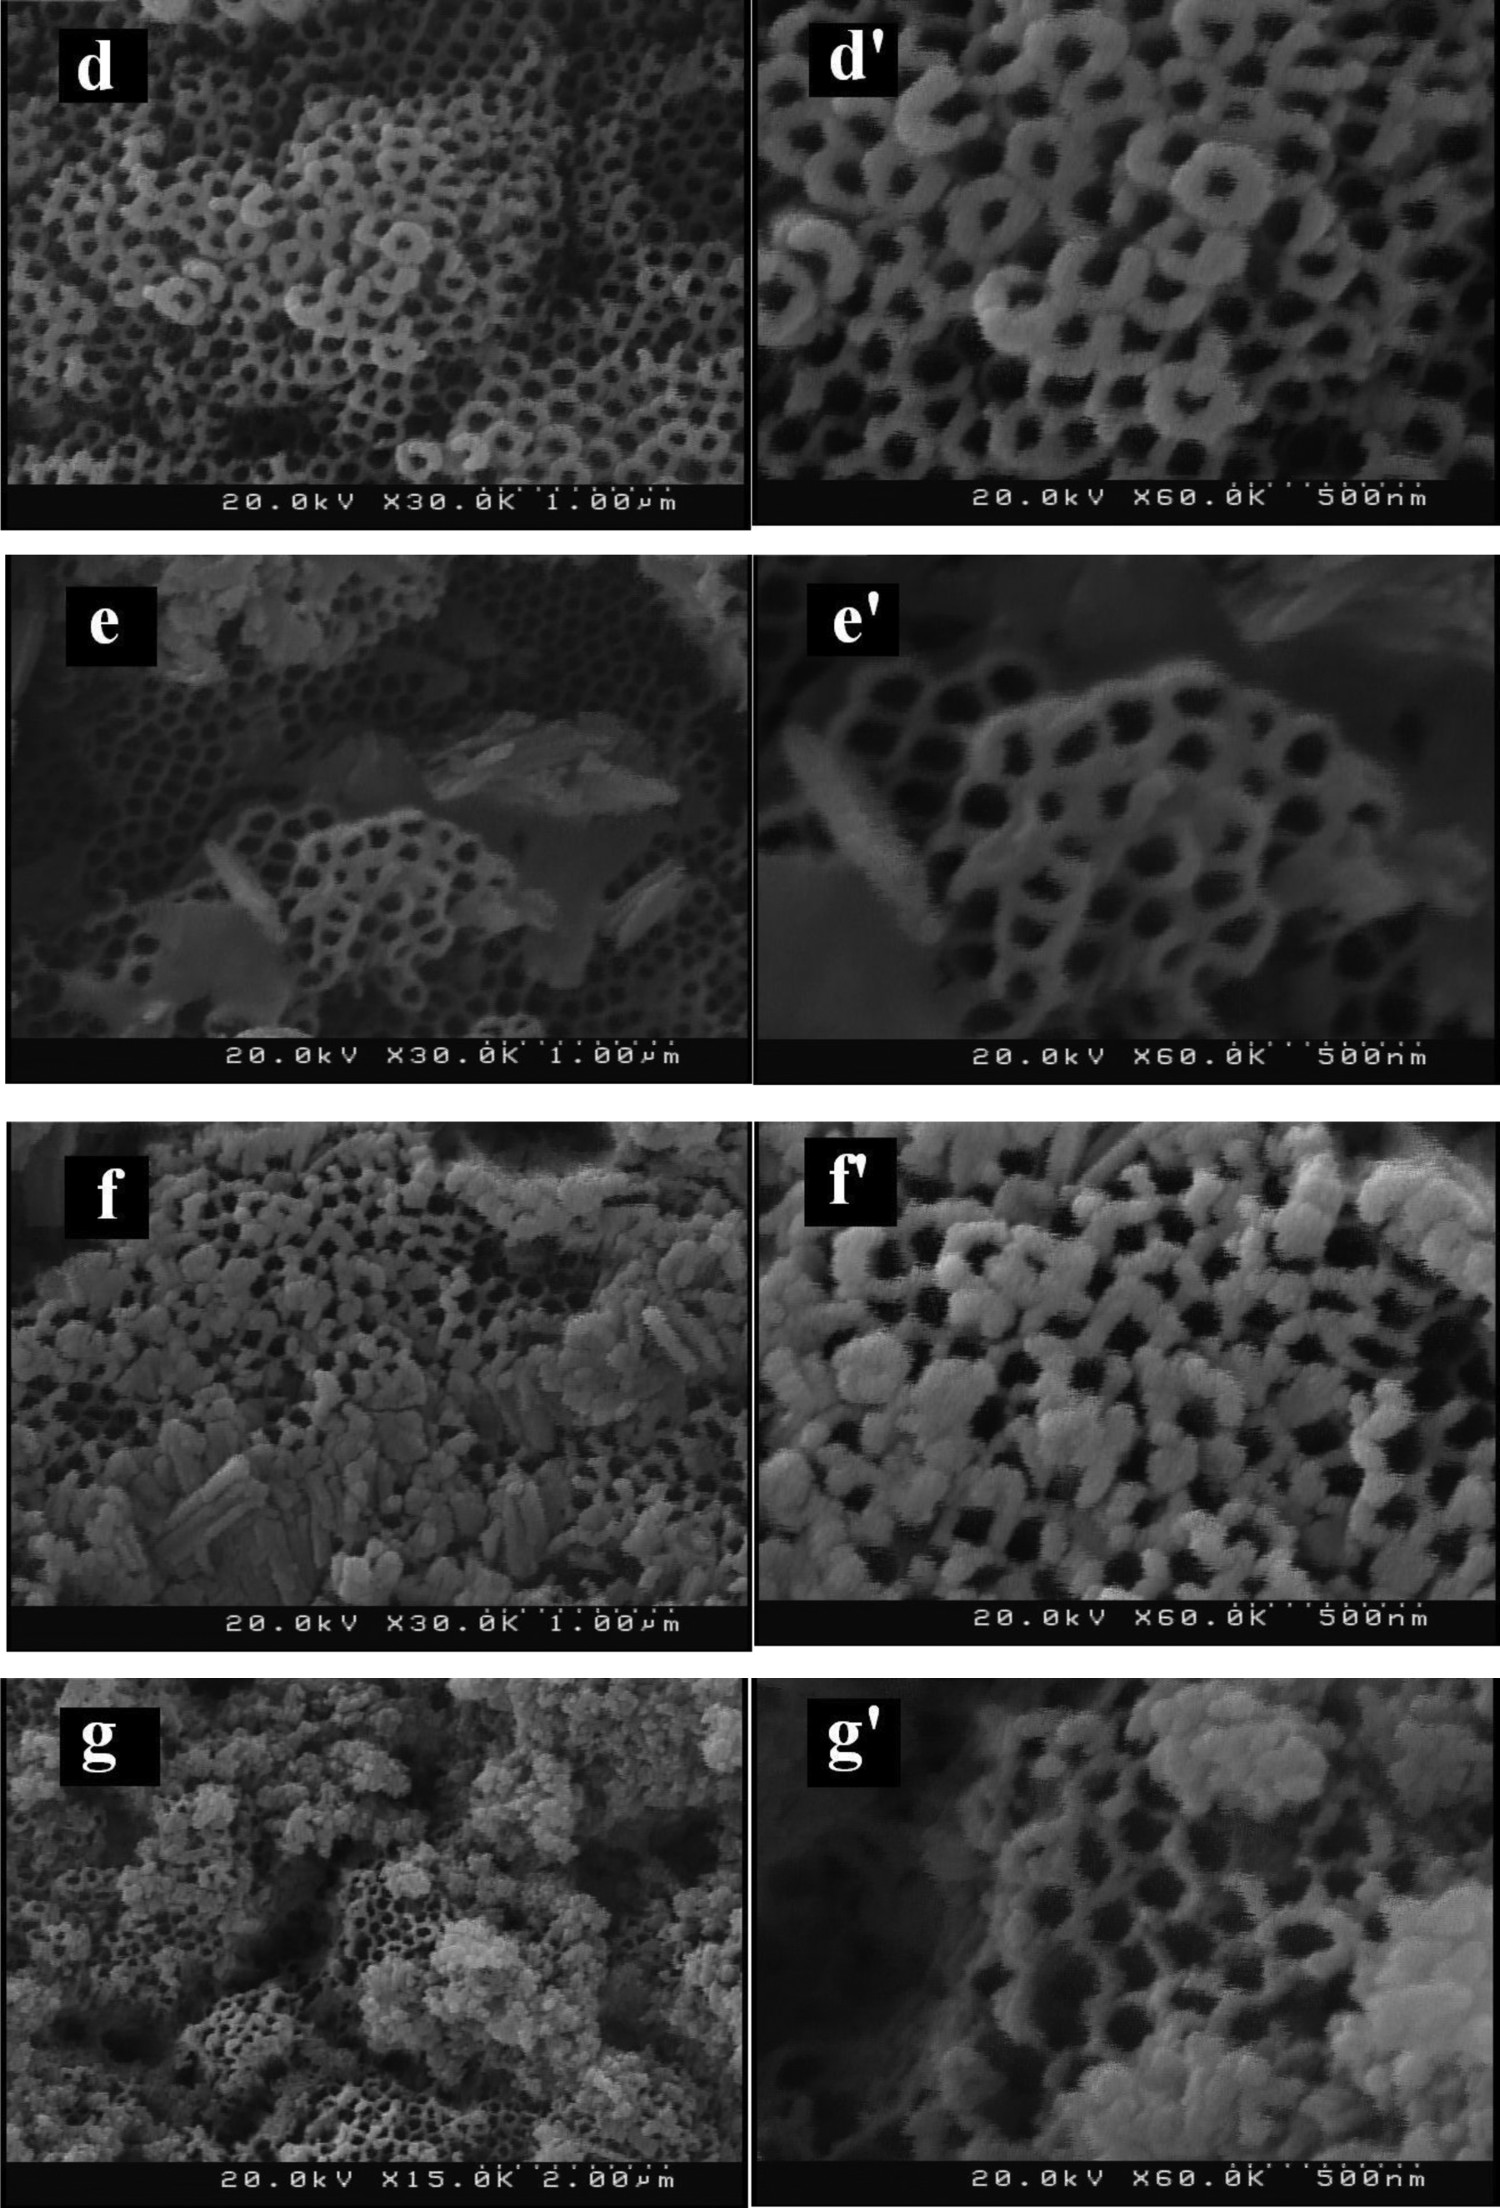
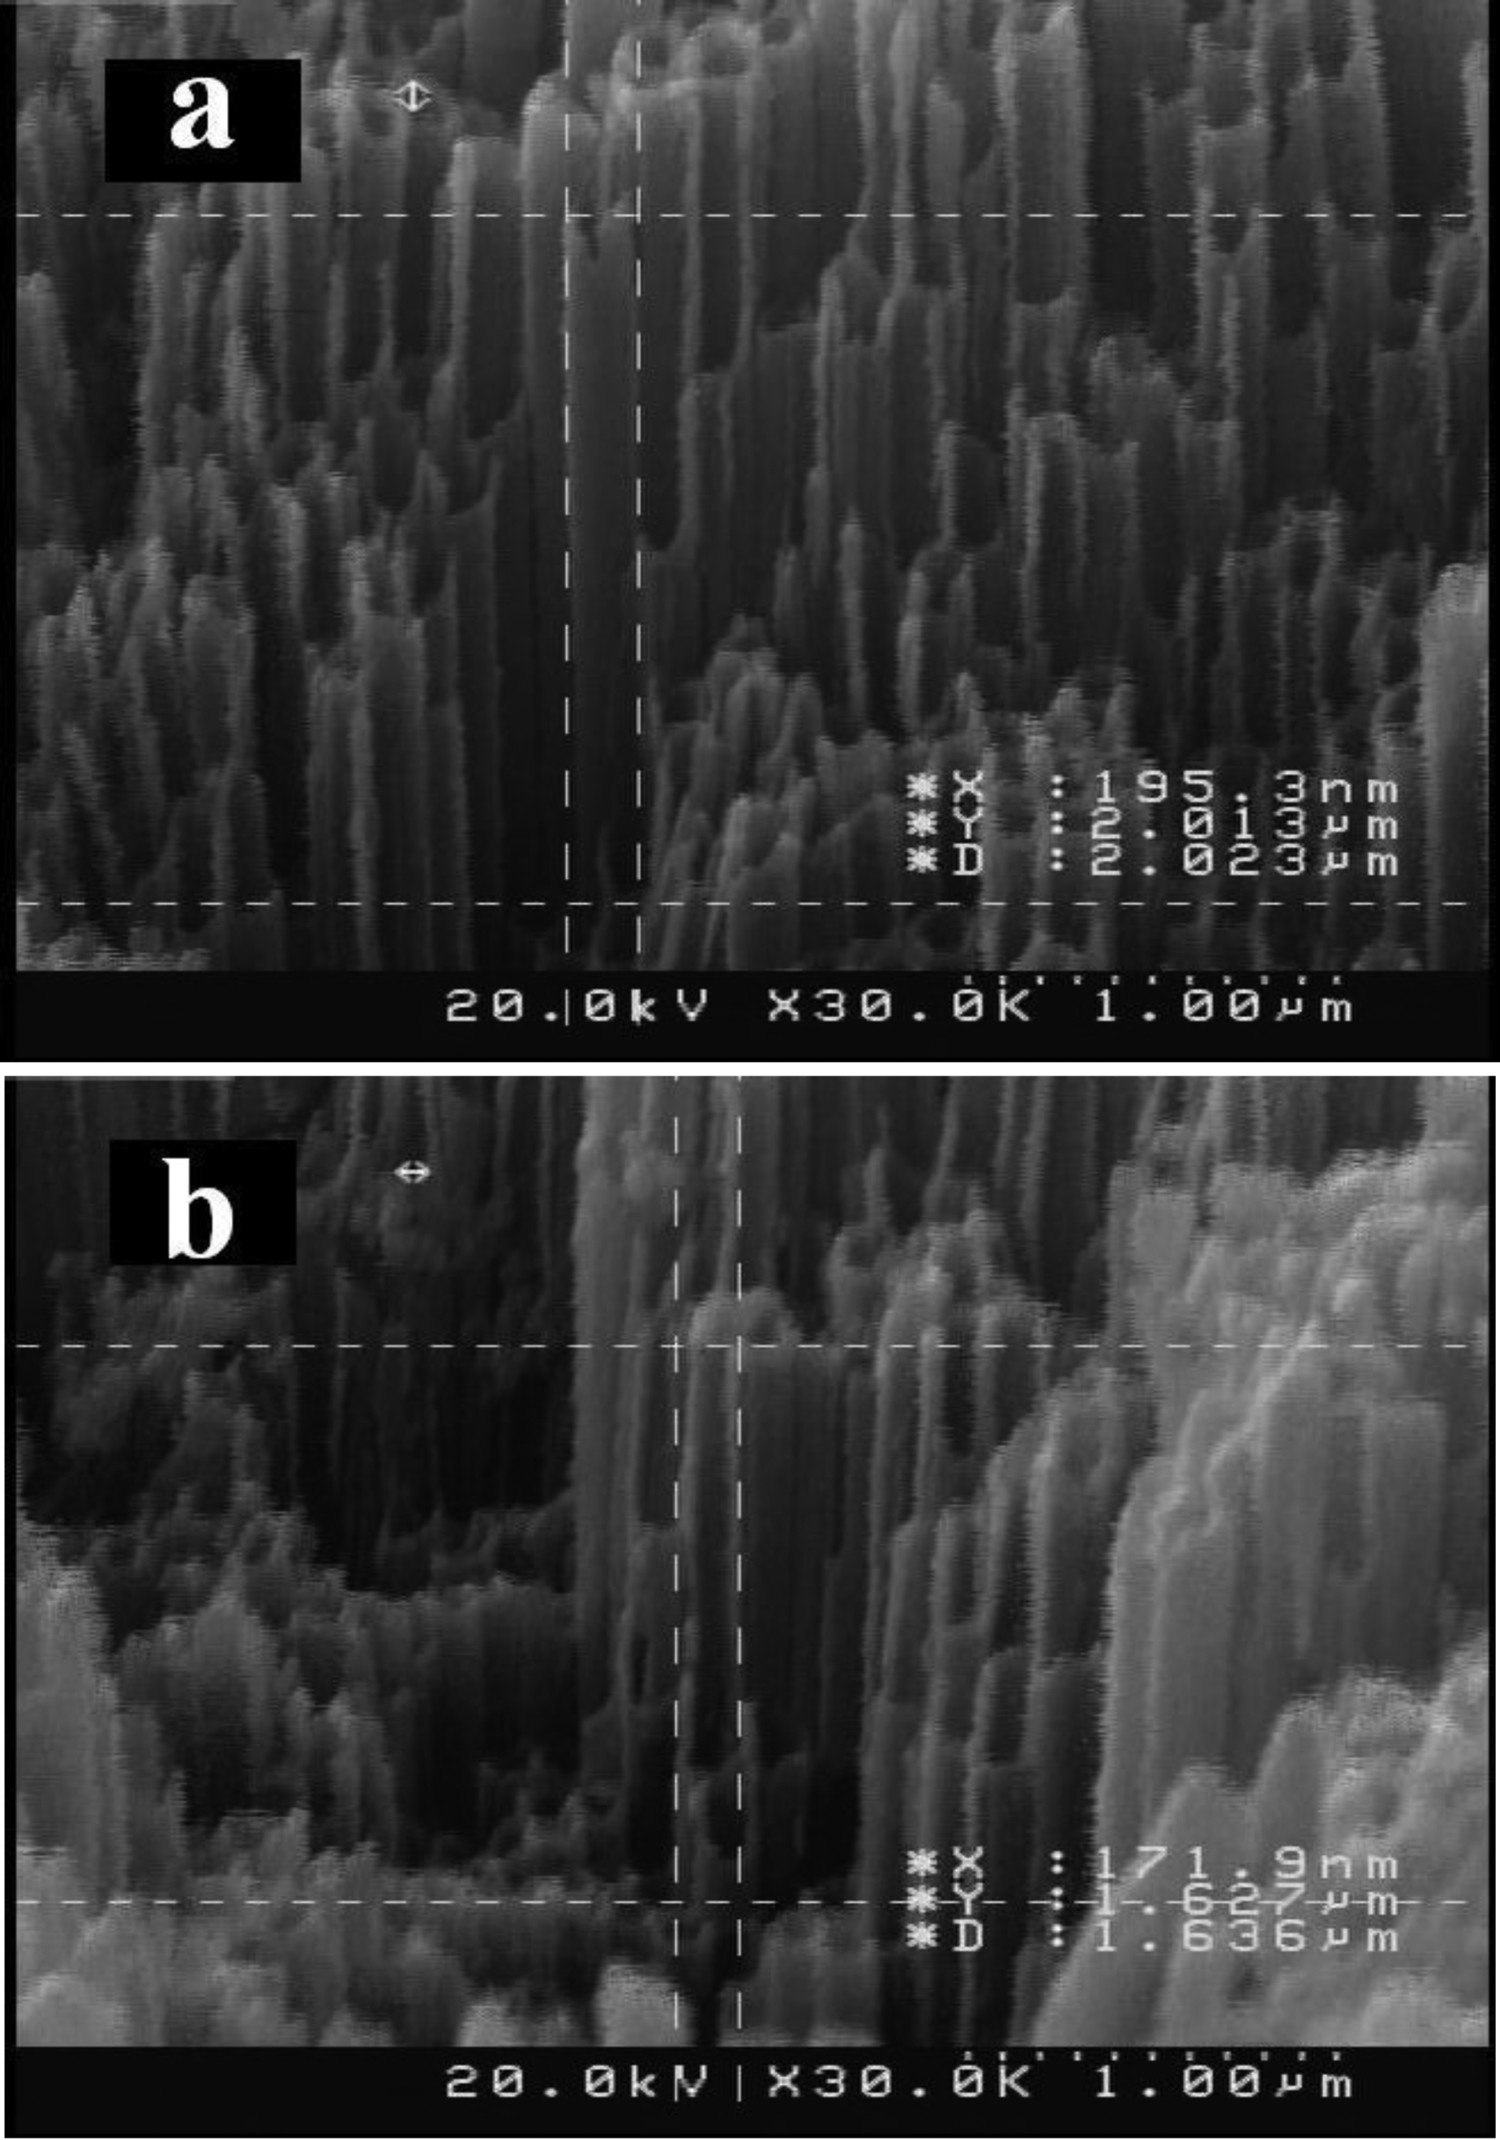
FESEM was used to carry out the surface morphology and cross-sectional studies for different iron–tungsten/TiO2 nanotubes. The FESEM images of these samples are shown in Figure 1. In some samples, large nanoparticles are deposited on the mouth surface of some nanotubes and the aggregations of nanoparticles penetrate into TiO2 nanotube pores, partly blocking the tubes, as observed in Figure 1. Furthermore, some TiO2 nanotube samples display regular and integrated nanotube array morphology with nanotube diameters being about 50–80 nm. Nanoparticles are deposited on both the outside and inside of nanotubes through the CBD process. A uniform porous layer precipitated on the surface of pure TiO2 nanotubes is shown in Figure 1(d). The inner diameter of these pores is about 40–70 nm. The cross-sectional images of some samples in Figure 2 show that the iron–tungsten/TiO2 nanotube films, which exhibit homogeneous structures, consist of a vertically aligned array of many free standing single tubes with an average external diameter of ∼170–190 nm.
SEM top-view images of iron–tungsten/TiO2 nanotube samples with different magnification; a: A1, b: A2, c: A3, d: A4, e: A5, f: A6 and g: A7 sample. Continued. Cross-sectional view of iron–tungsten/TiO2 nanotubes; a: A2 sample and b: A4 sample.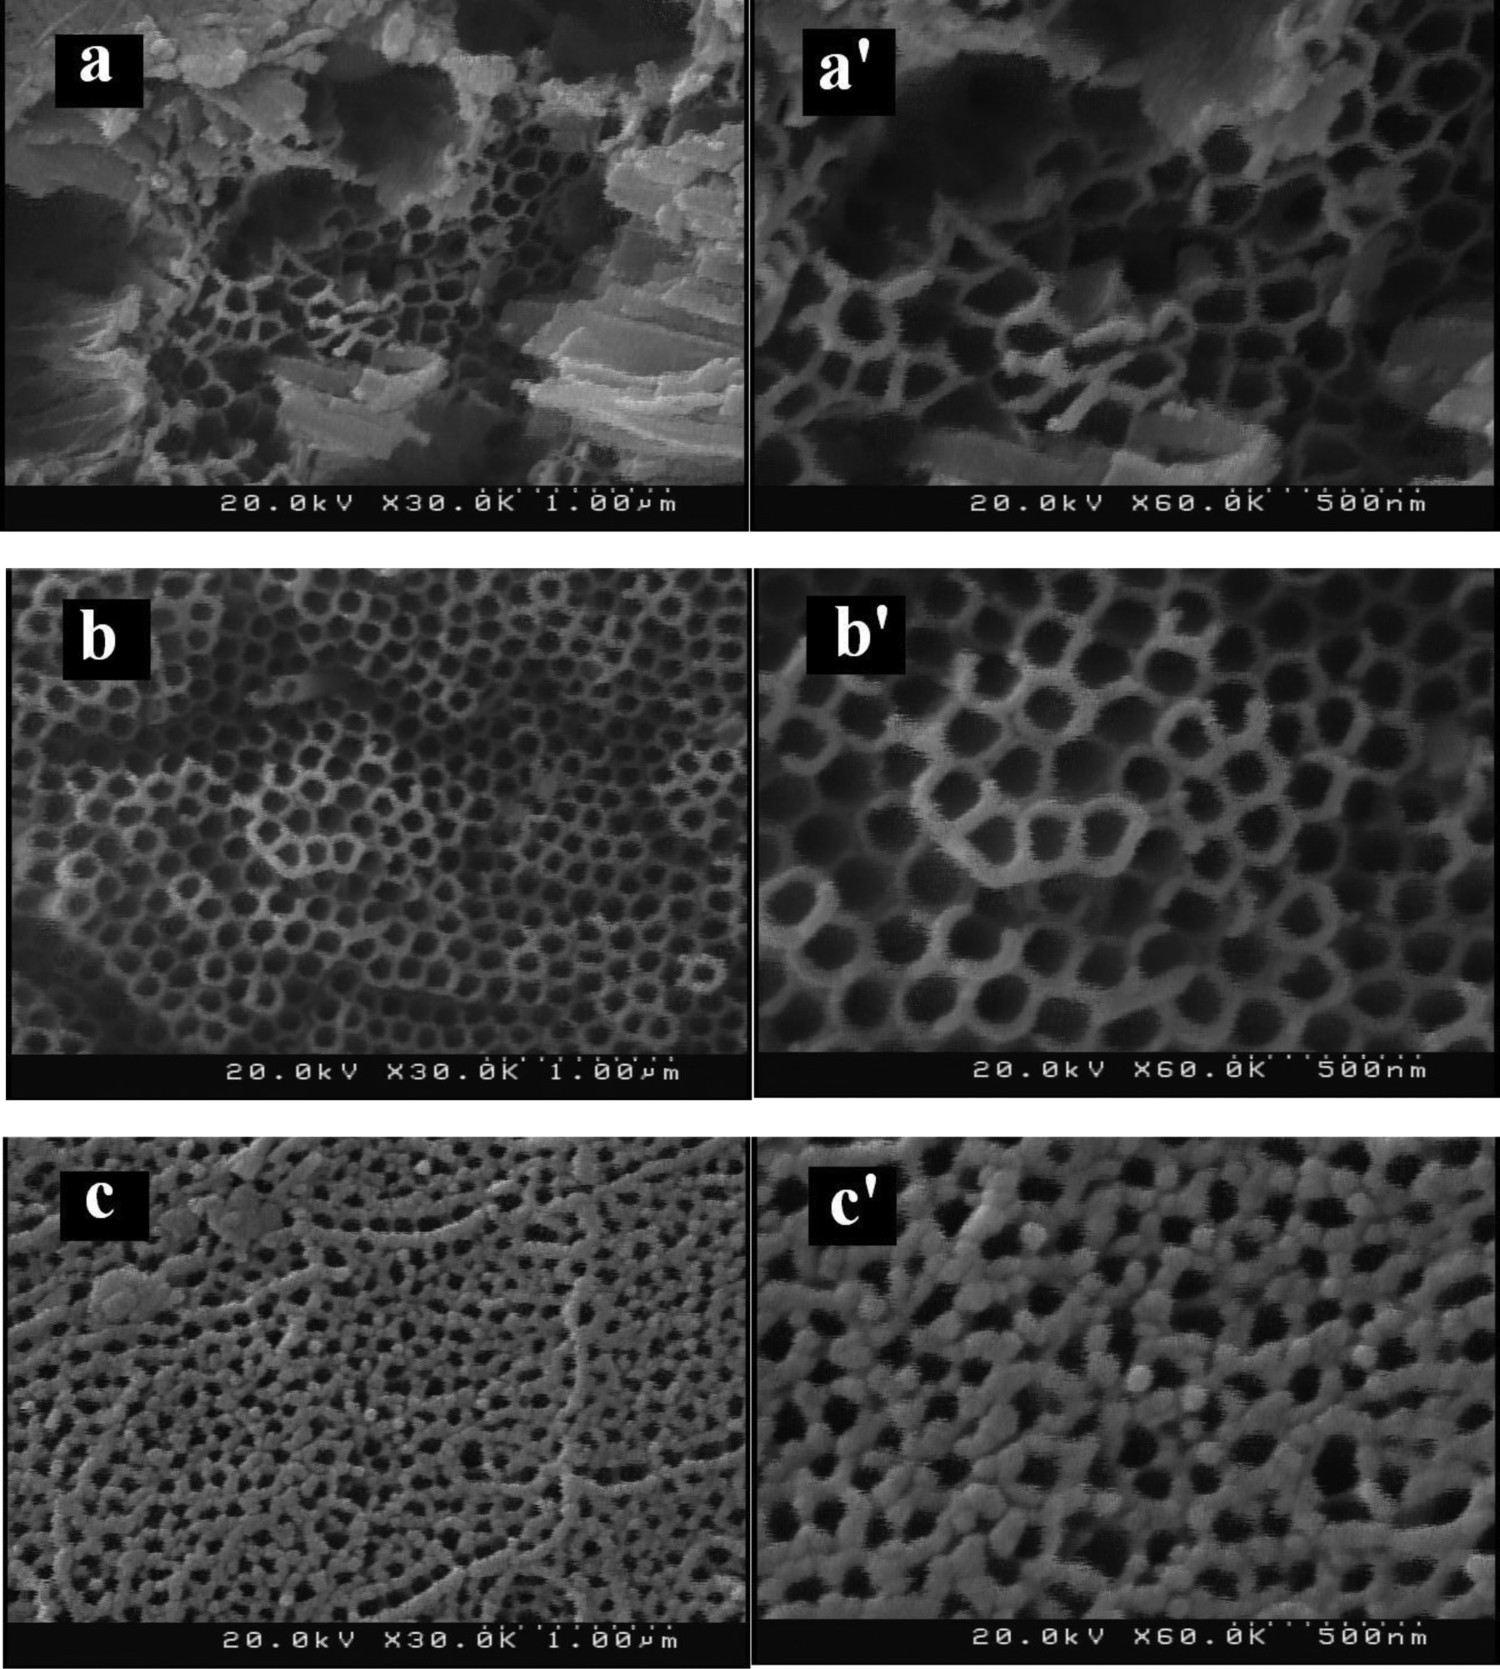
EDX spectroscopy is used to determine the composition of iron–tungsten/TiO2 nanotubes (Figure S2). EDX spectra of these new samples show Fe, W, Ti and O. Trace amounts of contaminants such as Na, N, Cl and F from precursors are also observed. EDX mapping was used in the confirmation of the composition of iron–tungsten/TiO2 nanotube samples (Figure S3). The presence and uniform distribution of W and Fe, along with O, Ti, Na, N, F and C, are revealed by the mapping of these new TiO2 nanotubes.
XRD was used to characterise the structure and phase composition of iron–tungsten/TiO2 nanotube samples heat treated at 400°C. The well crystalline nanotube shows an anatase structure for TiO2, according to Figure 3 (JCPDS No. 73-1764). The anatase phase of TiO2 is well known to possess good catalytic property. Thus, it was found to be beneficial for the PEC water splitting in our experiments. All prepared samples were annealed at 400°C to guarantee the formation of the anatase phase. Rutile phase and brookite phases are not observed in samples. The Ti peaks are associated with the titanium substrate. WO3 and TiO2 diffraction peaks are observed in the XRD pattern of iron–tungsten/TiO2 nanotubes samples. In addition, diffraction peaks are ascribed to the reflections associated with the tungsten oxide (WO3) phase, which is a monoclinic crystal system (JCPDS data file 72-0677). Clear diffraction peaks corresponding to Fe2O3 are shown in the XRD pattern of iron–tungsten/TiO2 nanotubes. All the peaks in the XRD patterns are clearly observed to be consistent with the JCPDS data (No. 39-1346) of the Fe2O3. No detectable diffraction peaks due to possible impurities are observed, which suggests that the product is highly pure.
XRD patterns of different samples annealed at 400°C; a: A2 and b: A6 sample.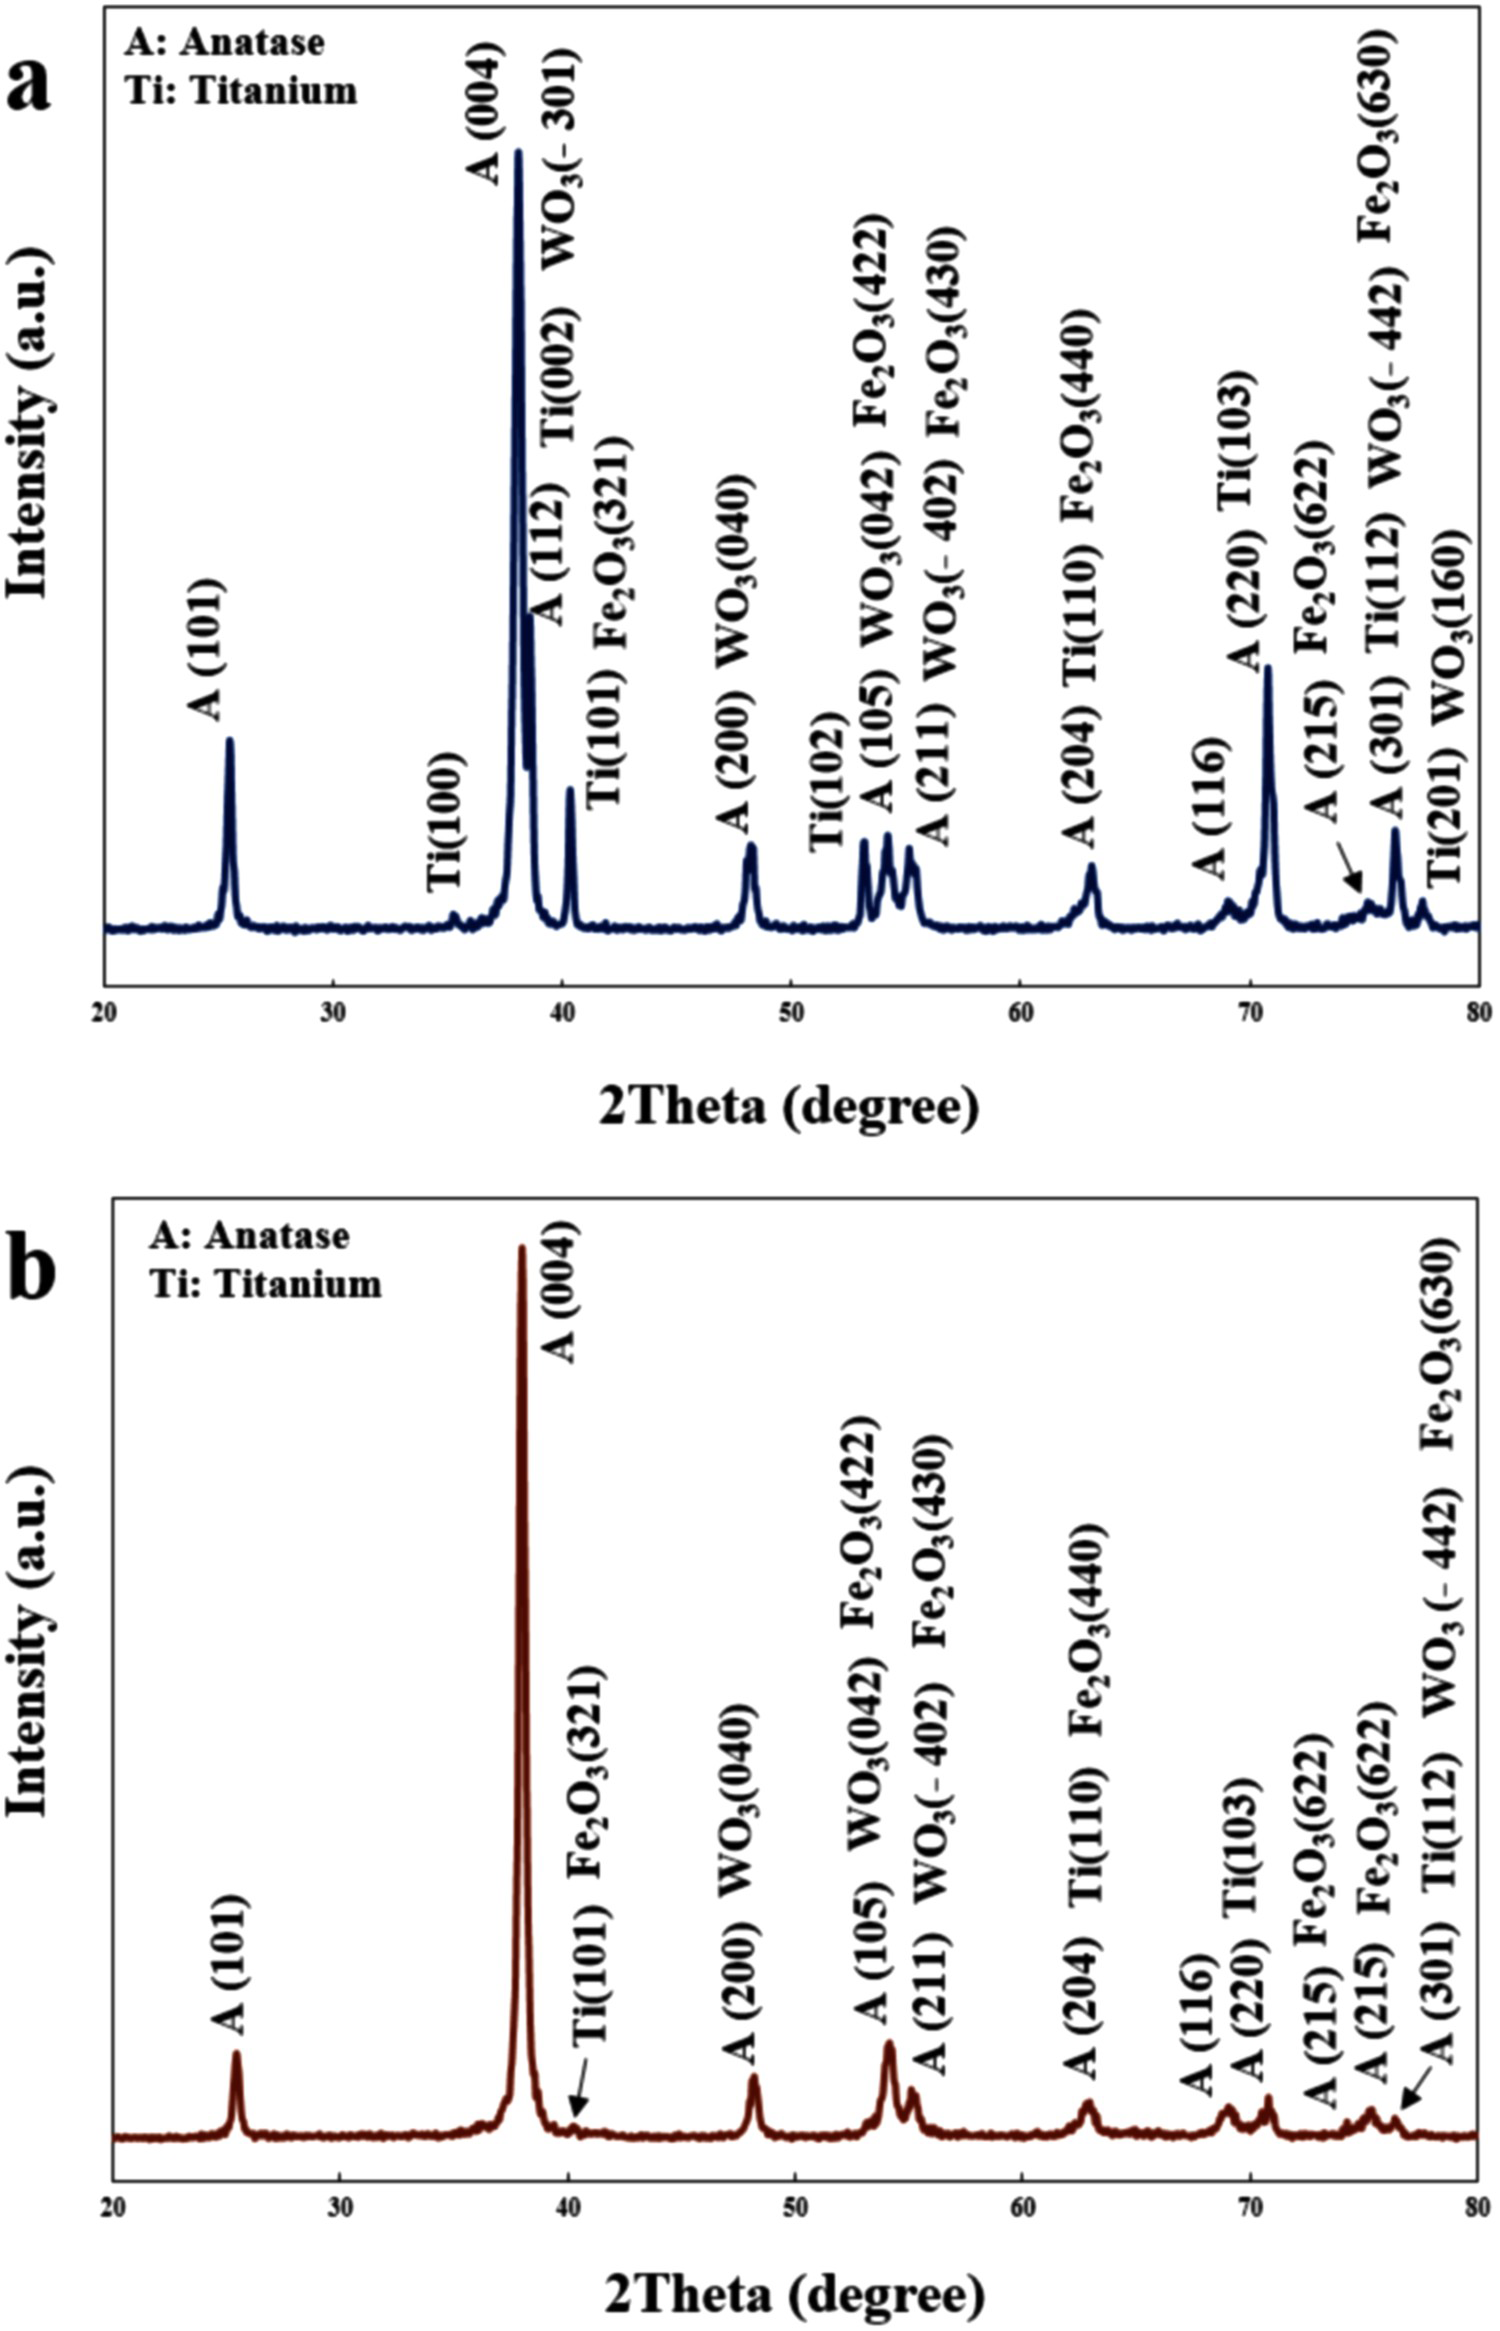
The optical properties of prepared samples were also studied. The transmission spectra, T(λ), absorption spectra, A(λ) and optical band gap energy (Eg) of all iron–tungsten/TiO2 nanotube samples are shown in Figure S4. The absorption and transmission spectra of these films were analysed in the 250–600 nm wavelength range. Different absorption behaviours are shown by iron–tungsten/TiO2 nanotubes in the visible region. The Tauc plot can be used to quantitatively determine the optical band gap via the following equation:
where α, h, υ, A and n are the absorption coefficient, Planck's constant (6.6260 × 10⁻³⁴ J s), the frequency of the radiation, a constant and a number characterising the transition, respectively [3-5]. Band gap values were found to be about 1.8–2.7 eV for different iron–tungsten/TiO2 nanotubes samples by plotting (αhυ)1/2 vs. hυ from the absorption spectra, extrapolating the linear portion to zero on an abscissas axis and using the intersections of the straight lines. As a result, these samples are considered very appropriate visible light-absorbing compounds due to their energy gap.
A three electrode electrochemical set-up for the measurement of the photocurrent response of new electrodes was used to investigate the sensitisation effect on PEC performance of TiO2 nanotubes. Photocurrent measurements were performed in a 1 M KOH aqueous solution containing 5 vol.-% ethylene glycol as the electrolyte under light irradiation, using a 55 W xenon lamp (Figure S5). Current responses in the absence of illumination were also included for the sake of comparison (Figure S6). When light is used to illuminate the pure TiO2 nanotube electrode at bias potential from −1.0 V to + 1.5 V, the photocurrent is relatively low because of TiO2 poor visible light activity. However, great enhancement of photocurrent response is obtained for tungsten–iron/TiO2 nanotube electrodes in comparison with the pure TiO2 nanotube electrodes (Figures S7 and S8). Figure 4 shows the linear sweep voltammograms of different samples recorded under chopped light irradiation. Almost no current response occurs in any of the electrodes without illumination due to the inactivation of electron hole phenomenon, according to this figure. When these electrodes are illuminated by light, great enhancement of photocurrent response is obtained as a result of the triggering of photoinduced electron hole pair separation. Furthermore, prompt and reproducible photocurrent responses with respect to the On–Off cycles of the irradiation signal are shown by these samples, indicating their good PEC performance.
Linear sweep voltammograms for all prepared samples in 1 M KOH, 5 vol.-% ethylene glycol/DI water solution under chopped light irradiation.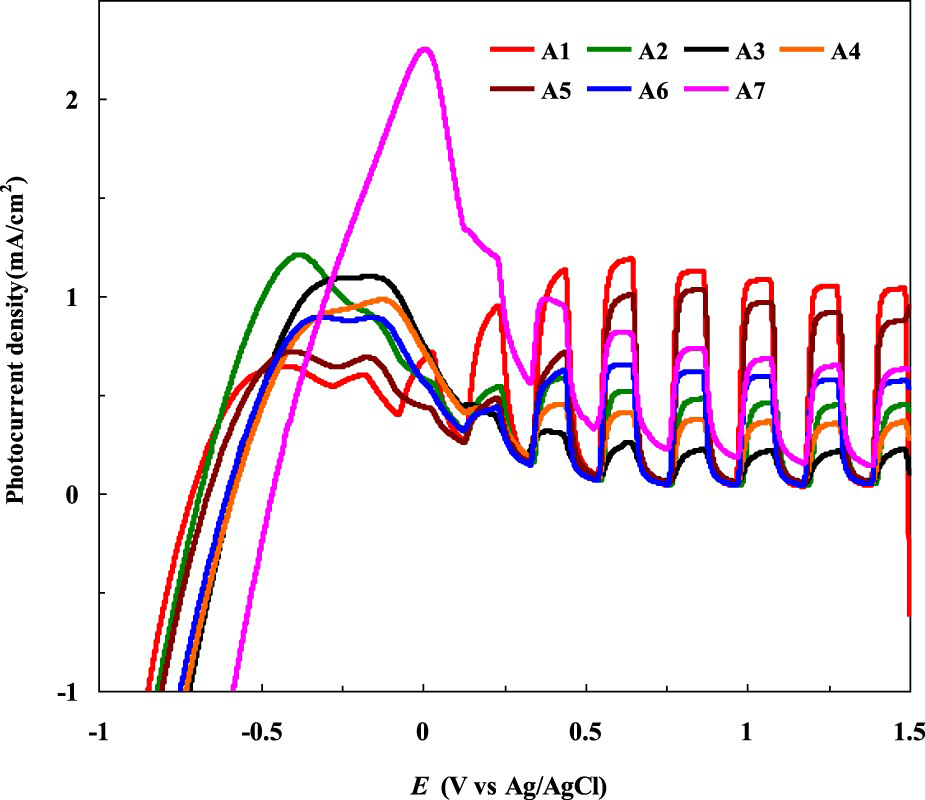
The transient photocurrents of the electrodes in the mentioned electrolyte were also assessed for further investigation of the PEC properties. Photocurrent over time is detected under light illumination with a light On–Off cycle of 20 s at a bias potential of + 0.6 V (Figure 5). In both electrodes, a fast and steady photocurrent response was observed for each switch-on and switch-off and the photocurrent response was completely reversible. According to Figure 5, the photocurrent density sequence of the different electrodes is as follows:
Iph–t curves (On–Off cycles) of different photoelectrodes at an applied potential of 0.6 V vs. Ag/AgCl.
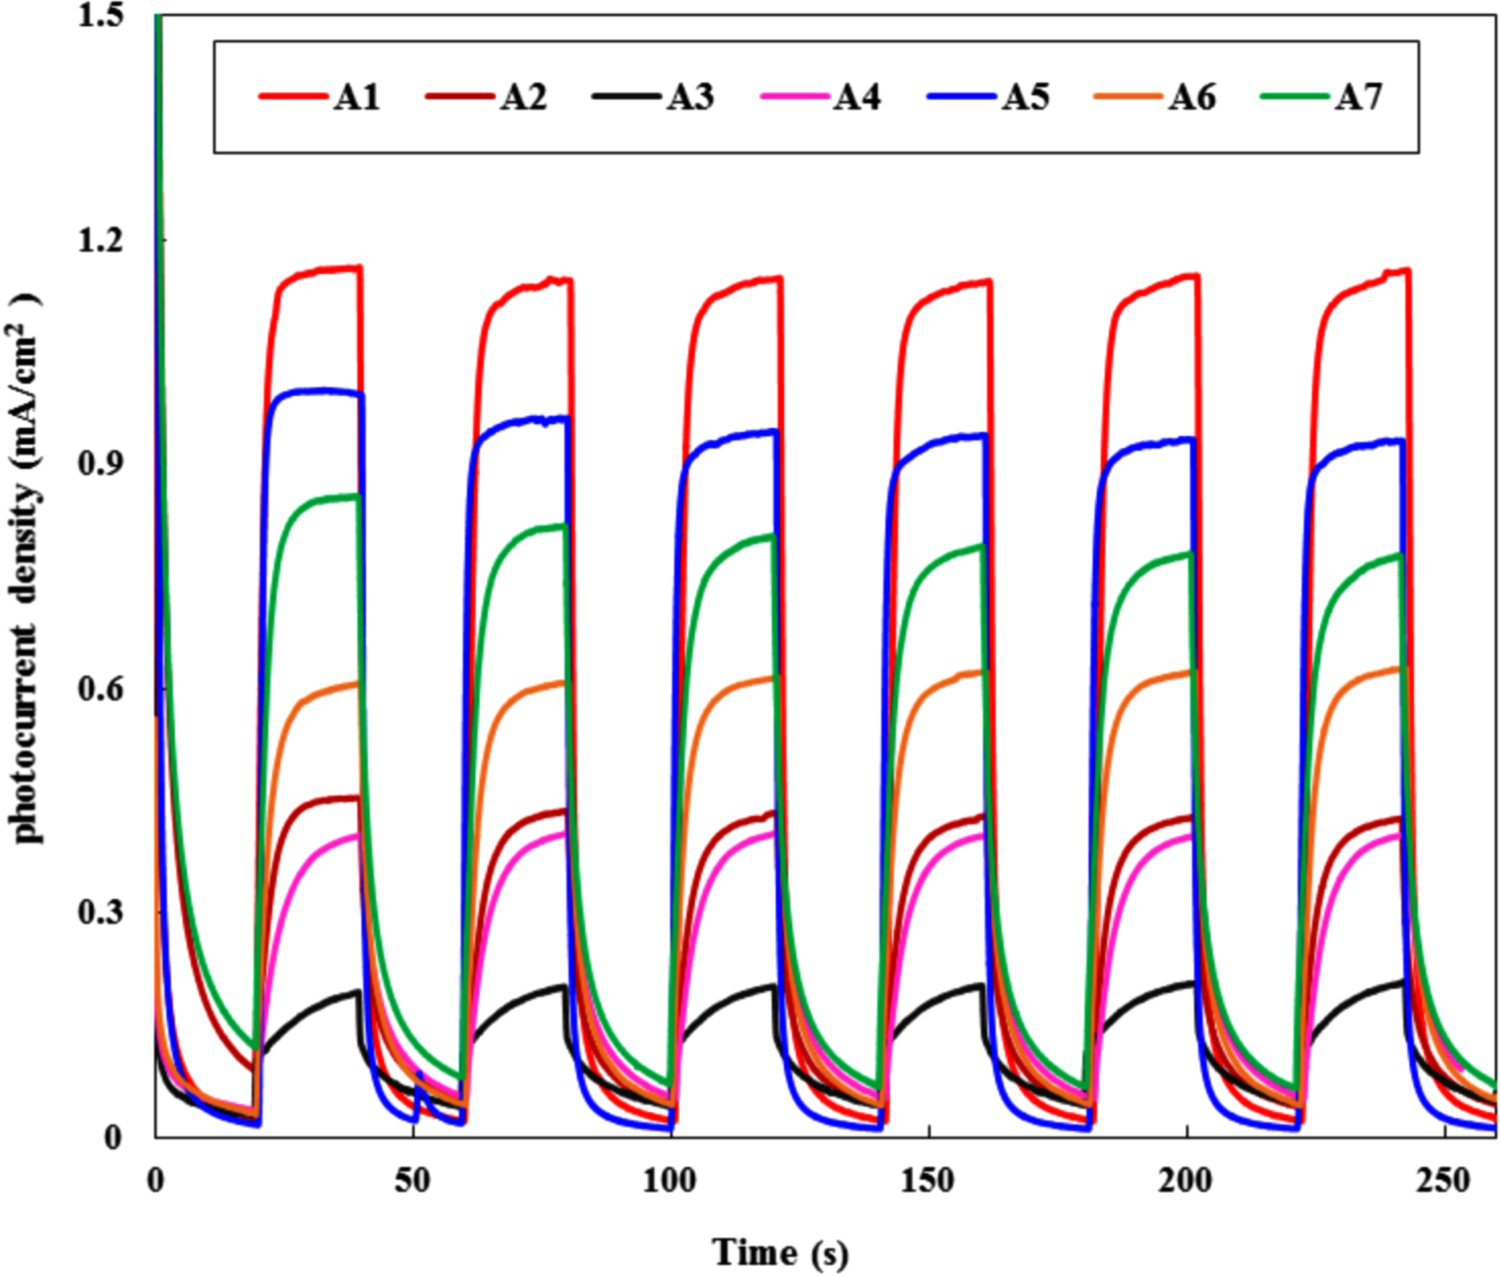
Wider absorption spectrum region and stronger absorption of the iron–tungsten/TiO2 nanotubes compared with pure TiO2 nanotubes and the improved charge separation and transportation efficiency through the interaction between the iron–tungsten oxides and TiO2 nanotubes can be accounted for by the great enhancement of photocurrent.
The estimated hydrogen evolution rate of different photoelectrodes is shown in Figure 6. The working electrode was set at a bias potential of + 0.6 V vs. Ag/AgCl and a xenon lamp light of 200 mW cm–2 were used to provide illumination during the gas evolution process. The electrolyte was a 1 M KOH with 5 vol.-% ethylene glycol aqueous solution at pH = 13.6. The rate of hydrogen evolution on pure TiO2 nanotube electrode is very low, which is attributed to the fact that pure TiO2 cannot be initiated by irradiation of visible light due to its larger band gap. Hydrogen generation rate increased with the coverage of TiO2 nanotubes with tungsten and iron. The A1 electrode recorded the highest hydrogen evolution rate of ∼1.72 mL cm−2 h−1, which is several times higher than that for TiO2 nanotubes, as expected from the photocurrent density values. The hydrogen production rate of A3 electrode was lower than those of other deposited TiO2 nanotube samples. Photocatalyst reusability is a key concern in practical applications. TiO2 nanotubes/Ti photocatalyst is well known to have the advantage of high stability. The photocatalytic water splitting experiments were repeated for four cycles with the A1 electrode under the same experimental conditions to investigate the reusability. The hydrogen evolution rate was almost continued (i.e. dropped only to 2%) after four runs, suggesting the excellent stability and reusability of tungsten–iron/TiO2 nanotube photoelectrodes (Figure S9).
Photoelectrochemical hydrogen evolution amount of new photoelectrodes.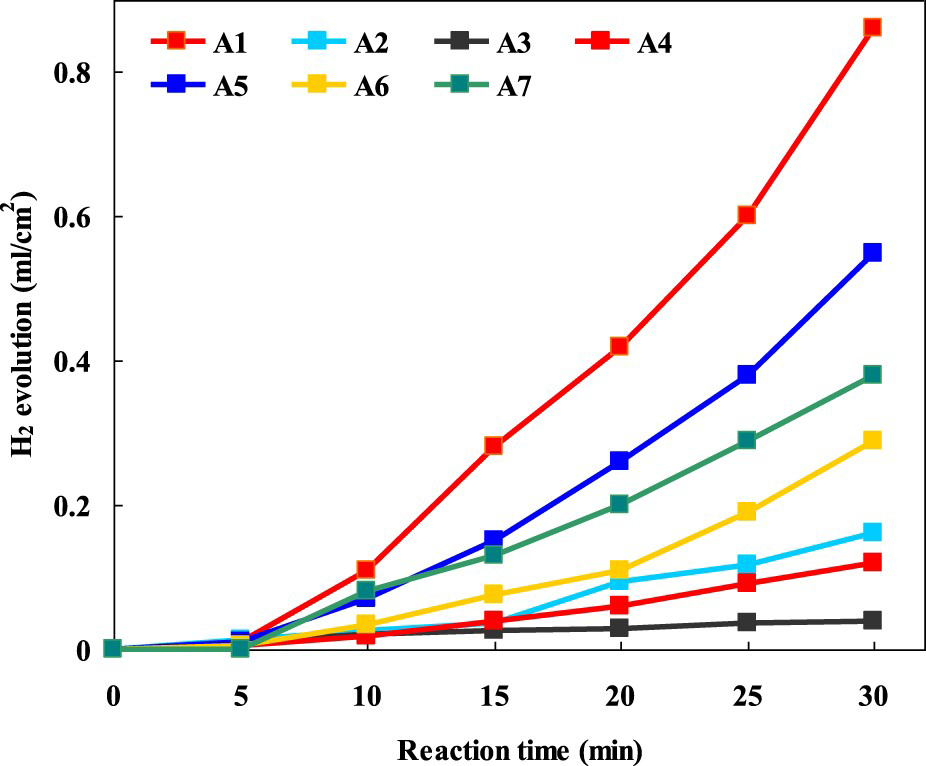
Conclusion
Iron–tungsten/TiO2 nanotube photoelectrodes of good photocatalytic activity have been successfully synthesised by a two-step process; anodic titanium oxidation followed by the chemical bath deposition technique. The surface morphology, phase composition, structural and optical properties of new TiO2 nanotube samples have been investigated. The effects of the ratio of the iron–tungsten on the PEC performance of the samples have been systematically studied and the optimal performance was found with the A1 electrode. In comparison with bare TiO2 nanotube, broad absorption range in visible light, increased absorbance and enhanced photocatalytic performance are shown by iron–tungsten/TiO2 nanotube samples. Considering their large specific surface area, unique morphology, high photocatalytic activity as well as high stability and recyclability, the new iron–tungsten/TiO2 nanotube photocatalysts could be applied in solar cells, water treatment and photoelectrical devices.
Footnotes
Disclosure statement
No potential conflict of interest was reported by the authors.