
Abstract
ABSTRACT
In this study, a chemical reaction process was designed to prepare the endogenous conversion coating on a smooth and clean amorphous alloy surface, solving the problem of non-wetting of the interface between the iron-based amorphous alloy and the resin during the packaging process. The best preparation condition is to react in salt solution at 85°C for 2 h. At this time, the conversion film with a thickness of approximately 1 μm is formed uniformly on the surface of Fe78Si13B9 amorphous alloy. The composition of the designed conversion film was primarily Fe oxide and FeSi complex, and the surface of the conversion film was covered with tiny etched voids and evenly distributed oxidation corrosion circles. This structure is conducive to epoxy resin fully infiltrating the surface of amorphous alloys and achieving good composites with other materials.
Introduction
The atomic structures of amorphous alloys have the characteristics of long-range disorder and short-range order. The amorphous alloys have no grain boundaries and dislocations, and their elements are uniformly distributed (no segregation). Owing to the excellent mechanical properties and soft magnetic properties, amorphous alloys have huge application potential in many fields [1-4]. Iron-based amorphous alloys are generally obtained by rapid cooling and solidification of molten metals. They have the characteristics of low surface energies, weak surface activities, strong water-repellent, and oil-repellent. When the polymer material is used to encapsulate the iron-based amorphous alloy material, there is a serious interface non-wetting problem between the two, which prevents to achieve ideal packaging effect. Hence, improving the wettability is the biggest challenge in the application of iron-based amorphous alloys [5-7].
In order to overcome the problem of insufficient infiltration with resin materials and realise new structural and functional characteristics to expand the applicability of amorphous alloys, it is necessary to solve the problem of interface matching by developing surface treatment processes and methods for iron-based amorphous alloy composite materials. Generally, the wettability of solid substrate is controlled by its surface free energy and surface geometry. Hence, the surface wettability can be adjusted by dynamically changing one of these two factors [8-15].
The current commonly used methods to control surface wettability are to form films with different properties on the surface of amorphous alloy to adjust the surface free energy, design the surface structure, and improve the adhesion between the amorphous alloy and other materials while maintaining the original alloy performance. The primary preparation methods for amorphous alloy surface films are physical vapour deposition (PVD) and anodic oxidation [16,17]. The PVD method is expensive and complex, and it requires large-scale special equipment. The anodic oxidation method requires electrolytes and precise control of Current, Voltage, and Time. In addition, the uniformity of the films formed by these two methods is not easy to control, and the composition of the metal element in the film layer is different from that of the amorphous alloy material matrix. The characteristics of the film layers and the amorphous alloy matrix are different, and the film layer easily peels off, which can even affect the properties of the amorphous alloy matrix. Thus, to obtain good amorphous alloy surface film, the following three conditions should be met. First, it is best to form endogenous conversion coating, not an external deposit, that is, no other metal elements are introduced. Second, the surface film and the substrate interface should be firmly bonded, so the film layer does not detach easily. Third, simple processing and high film-forming efficiency are more ideal methods [18-21].
To improve the surface wettability of Fe-based amorphous alloy, we used wet etching and chemical reaction to design and prepare hydrophilic film on the amorphous alloy surface, forming a nano-micro-scale hierarchical surface structure to improve the interface wettability between the amorphous alloy and polymer resin. The surface treatment process solved the weak relative bonding effect between the amorphous alloy matrix and the surface film, and enhanced the wettability of the amorphous alloy surface with the epoxy resin, which is of great significance for the application of iron-based amorphous alloy composites.
Experimental details
Materials and sample preparation
The experiment in the paper was divided into three parts: (1) degreasing and deoxidising the surface of amorphous alloys, (2) preparation of surface conversion coating by chemical wet etching, and (3) research on surface wettability.
The Fe78Si13B9 amorphous alloy strip, which is a typical amorphous material, was selected for this study. It has good soft magnetic properties and is widely used in various transformer cores. Its Young's modulus is 130–150 GPa, and its tensile strength is approximately 2 GPa. The sample size was 100 mm × 20 mm × 22–25 μm (length × width × height).
The samples were placed in a mixture of absolute ethanol/acetone and ultrasonically treated to remove excess grease and other adsorbents on the surface of the film, after which it was cleaned with deionised water several times to completely expose the amorphous surface of the alloy. A special wet chemical method (wet etching and chemical reaction) was used to form conversion film on the amorphous surface of the iron-based alloy. The optimal preparation condition and properties of conversion coating were studied.
The surface wettability of Fe78Si13B9 amorphous alloy was evaluated by two methods, one was dipping test, and the other was tensile test by single lap method. The Fe78Si13B9 amorphous alloys treated by wet chemical treatment for different times were immersed in glue (the mass ratio of epoxy resin and acetone was 1:1). After being fully wetted, pulled them out slowly and suspended them vertically to observe the surface wettability of amorphous alloys. Untreated amorphous alloys were bonded and formed by a single lap joint (Figure 1), and the amorphous alloys with special chemical treatment were also shaped in the same way. We spread the adhesive evenly on the overlap area and used a glass slide to push out internal bubbles and excess glue. All samples were cured for 48 h at room temperature. The dipping experiment was to test the wettability of the prepared Fe78Si13B9 amorphous alloy surface conversion film and resin glue. The single lap joint test was to test the interfacial bonding strength of surface conversion film to amorphous alloy matrix and resin adhesive. The ratio of epoxy glues used in the two experimental methods was shown in Table 1.
Sample overlap method of interface shear experiment. Glue formula of dipping experiment and single lap joint test.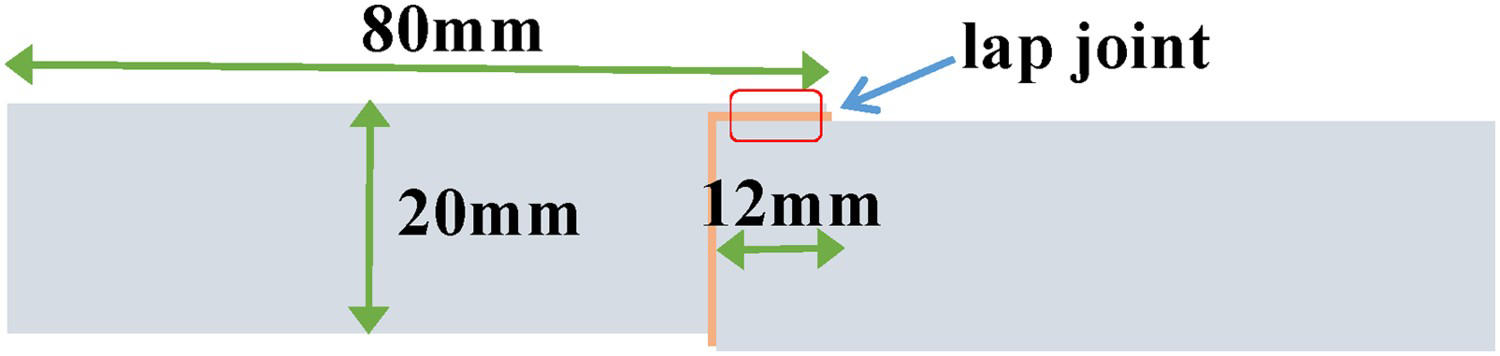

Characterisation
The high-depth optical microscope and metallographic microscope were used to observe the surface state of the alloy. The composition of the surface film was analysed by a German PANalytical X-ray diffraction analyser (XRD, CuKα). The scanning electron microscope (SEM, JEOL JSM-6701F) was used to observe the thickness and composition of the amorphous alloy surface film.
The single lap tensile strength of the Fe78Si13B9 amorphous alloy strips was tested on MTS microcomputer-controlled Electromechanical Universal Testing Machine with the tensile speed of 2 mm/min. The load–displacement curve was recorded for further analysis. The area integral in the load–displacement curve represents the magnitude of the fracture work. Six specimens were repeatedly tested in each group to calculate the average value and deviation.
Results and discussion
The XRD patterns of the Fe78Si13B9 amorphous alloy films with different surface treatment times are shown in Figure 2. In the XRD pattern of each group of samples, the main broad peak of amorphous diffusion was observed at 2θ = 45°, which was the amorphous phase of Fe78Si13B9 alloy. After 20 h of treatment, crystallization peaks corresponding to (002), (004), and (112) crystal planes appeared at 2θ = 13°, 25°, and 35°, respectively. When the treatment time was 50 h, two crystallization peaks were added at 2θ = 64° and 76°, corresponding to (304) and (314) crystal planes, respectively. The appearance of these crystallization peaks may be due to grain boundary segregation and final chemical ordering. These crystallization peaks were iron oxides and iron–silicon complexes Fe3[(FeSi)O4(OH)]5, which were the main components of the endogenous film formed by reacting ≥ 20 h. However, no crystallization peak was evident at 5 h, and the appearance of crystal phase peaks was affected by the thickness of the conversion coating. When the surface film thickness was small, the proportion of the crystalline phase in the material was too low and the diffraction intensity was too weak. As the treatment time increased, the thickness of the surface film produced by the reaction increased, and the diffraction intensity of the crystal phase peak increased.
XRD spectra of Fe78Si13B9 amorphous alloy films with different treatment time.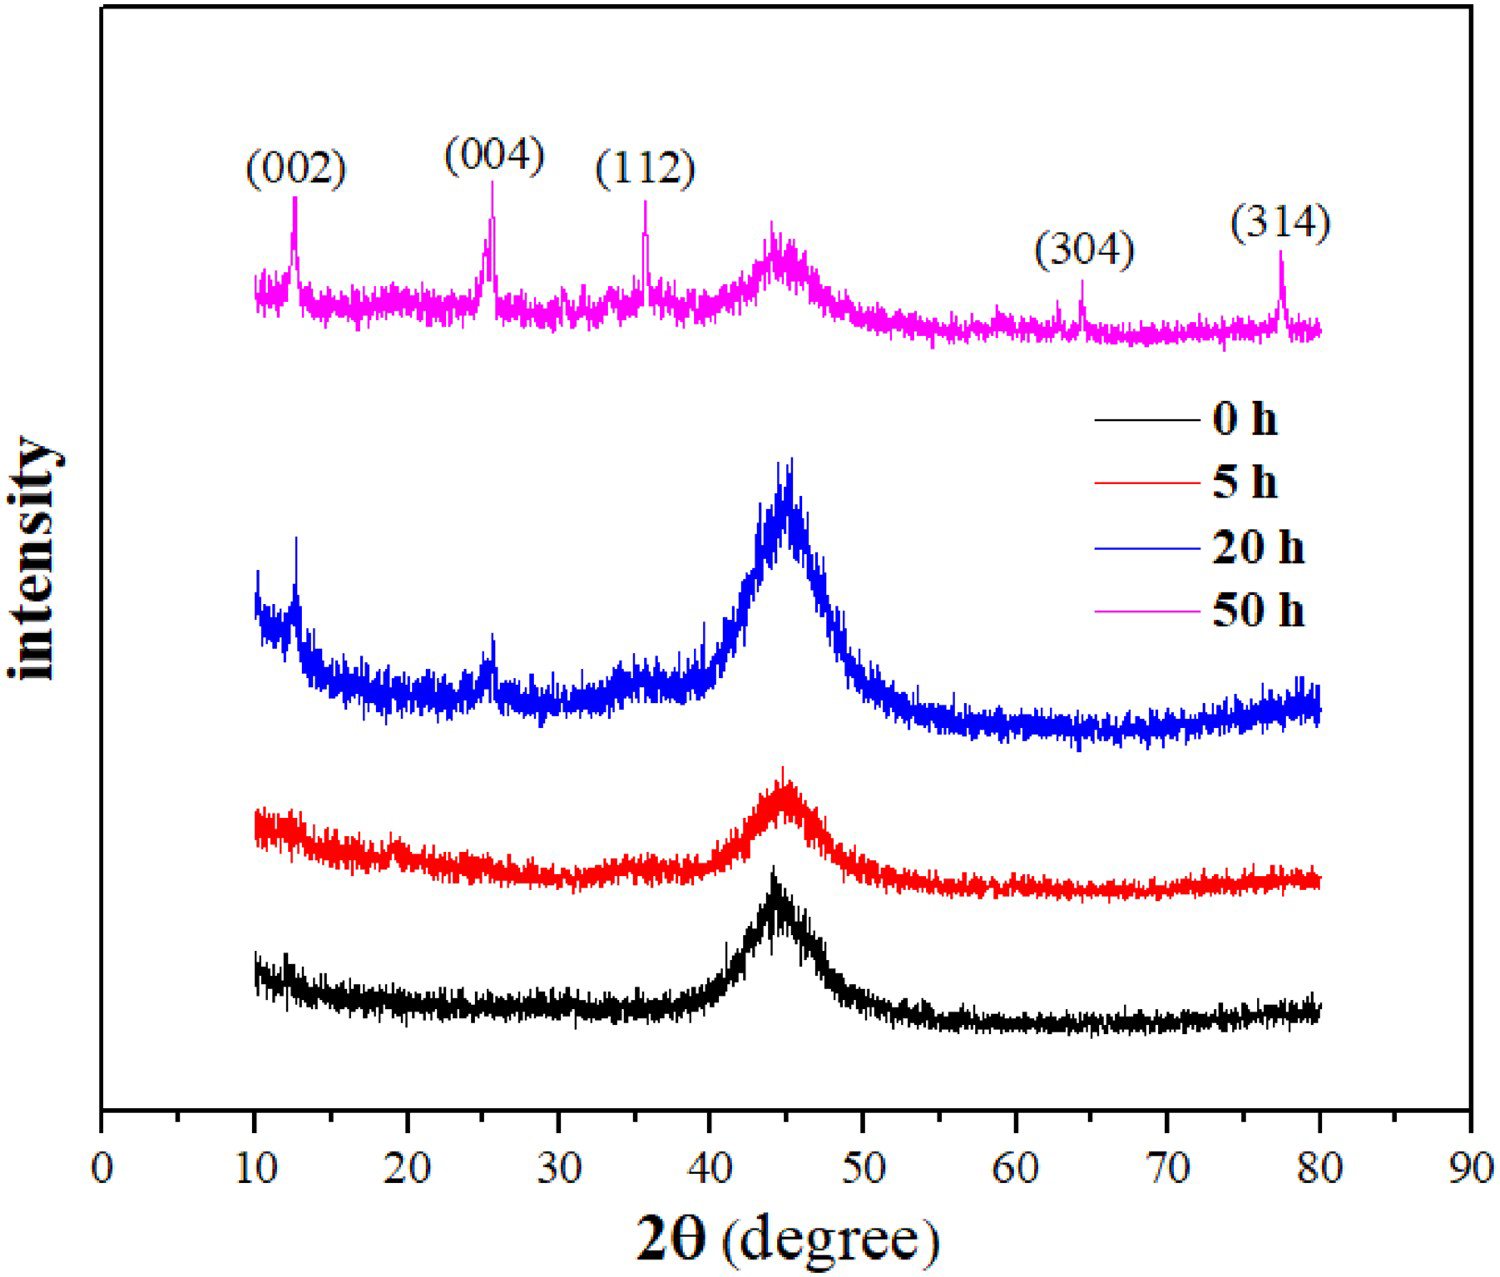
The adhesion characteristics between the alloy and the polymer material largely depend on the morphology of the alloy surface. Increasing the surface roughness can help to improve the mechanical properties and the long-term durability of the alloy–polymer bond. Figure 3 shows the changes in the surface microstructures of the amorphous alloy before and after surface treatment. Uneven corrosion occurred on the surface of the amorphous alloy, the corrosion circles (C) around the point appeared, and the entire surface was etched to form uniform etching gaps. Compared with the untreated amorphous surface, the structure of the etched void (A) and the corrosion circle (C) allowed the resin matrix to fully infiltrate the surface. The resin matrix entered the corrosion circles and the etching gaps so that the resin and the amorphous alloy formed a good mechanical connection. The uncorroded convex structure (B) played a pinning role in the amorphous alloy–polymer bonding interface to further enhance the friction effect.
Surface morphology of film and substrate. (a) Amorphous alloy substrate surface, and (b–d) surface film morphology under different magnifications.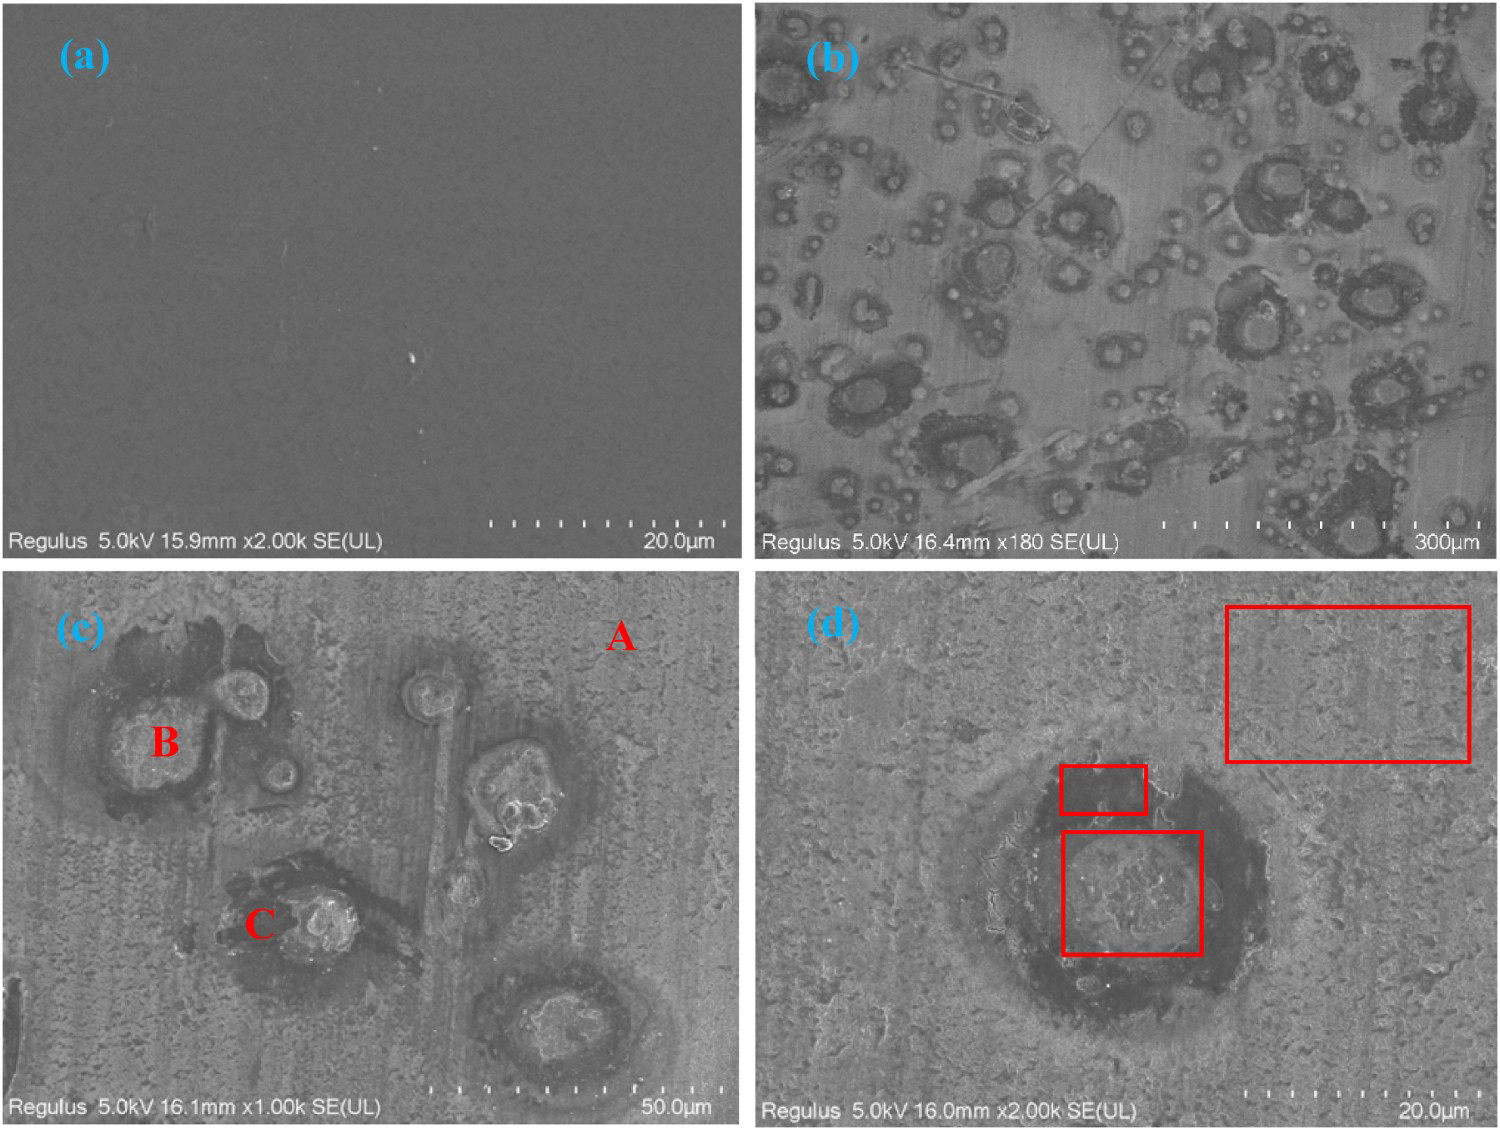
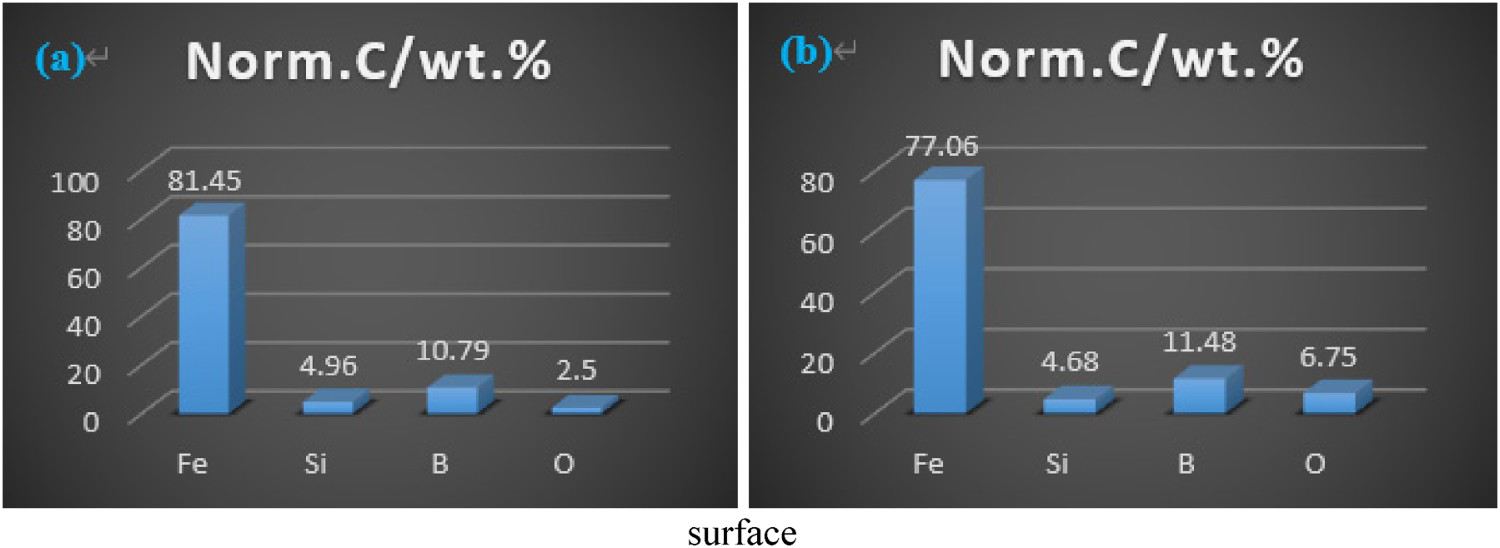
The depth of the energy-dispersive X-ray spectroscopy (EDS) test was tens of nanometres to few microns. According to the analysis of the EDS results (Figures 4 and 5), the composition of the amorphous film surface changed after treatment. The Fe-atom content decreased and the O-atom content increased. The oxidation reaction mainly occurred at the location of the corrosion circle, indicating that some of the Fe atoms were lost during the reaction, and oxide finally appeared in the surface film, which agreed with the XRD results.
Elements distribution of membrane and substrate. (a) Substrate surface and (b) membrane surface. Comparison of elements content between membrane and substrate. (a) Substrate surface and (b) membrane surface.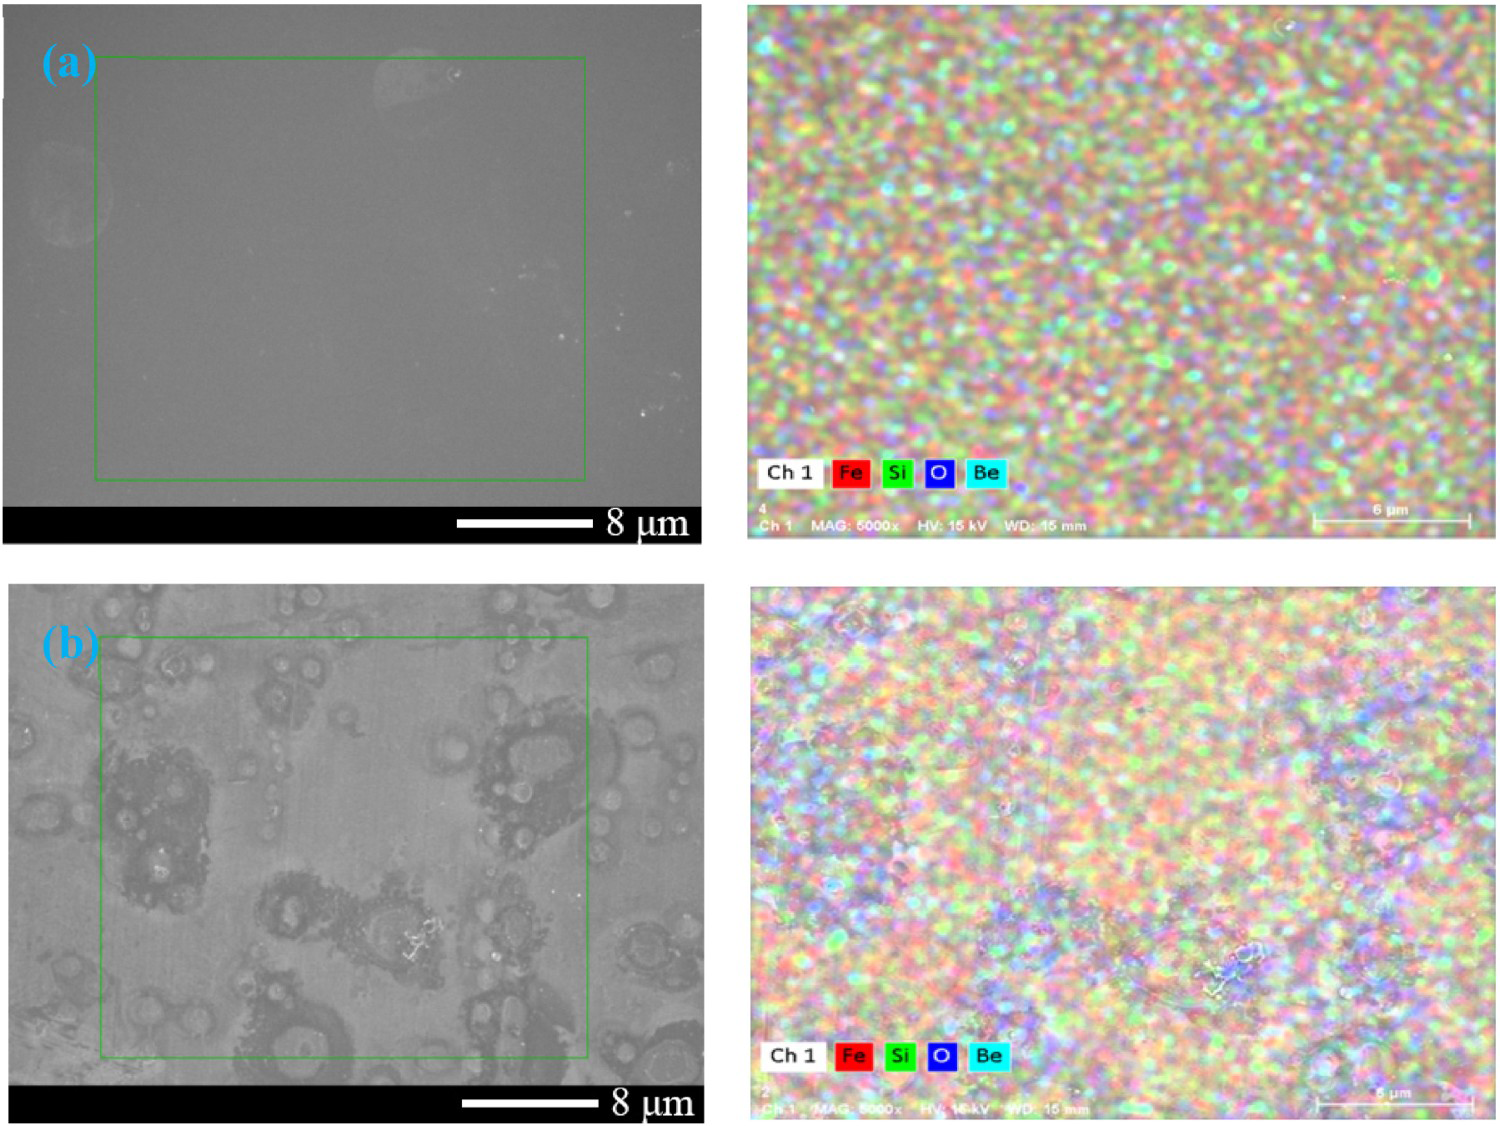
The wettability of solid surface was determined by surface microstructure and chemical properties, and the wettability can be adjusted through a change of the surface microstructure. Figure 6 clearly shows the chemical wet etching reaction process on the Fe78Si13B9 amorphous alloy surface after surface deoxidation. There were a lot of micro-defects on the surface of Fe78Si13B9 amorphous alloy (Figure 7(a,b)). The defect points on the exposed surface lack coordinating atoms, resulting in high atomic activity at the defect points. According to the theory of solid–liquid interface wetting, the free energy of system is given as follows:
Metallographic micrographs of the surface film formed after different reaction times. High depth of field micrograph of the amorphous surface of the iron-based alloy.
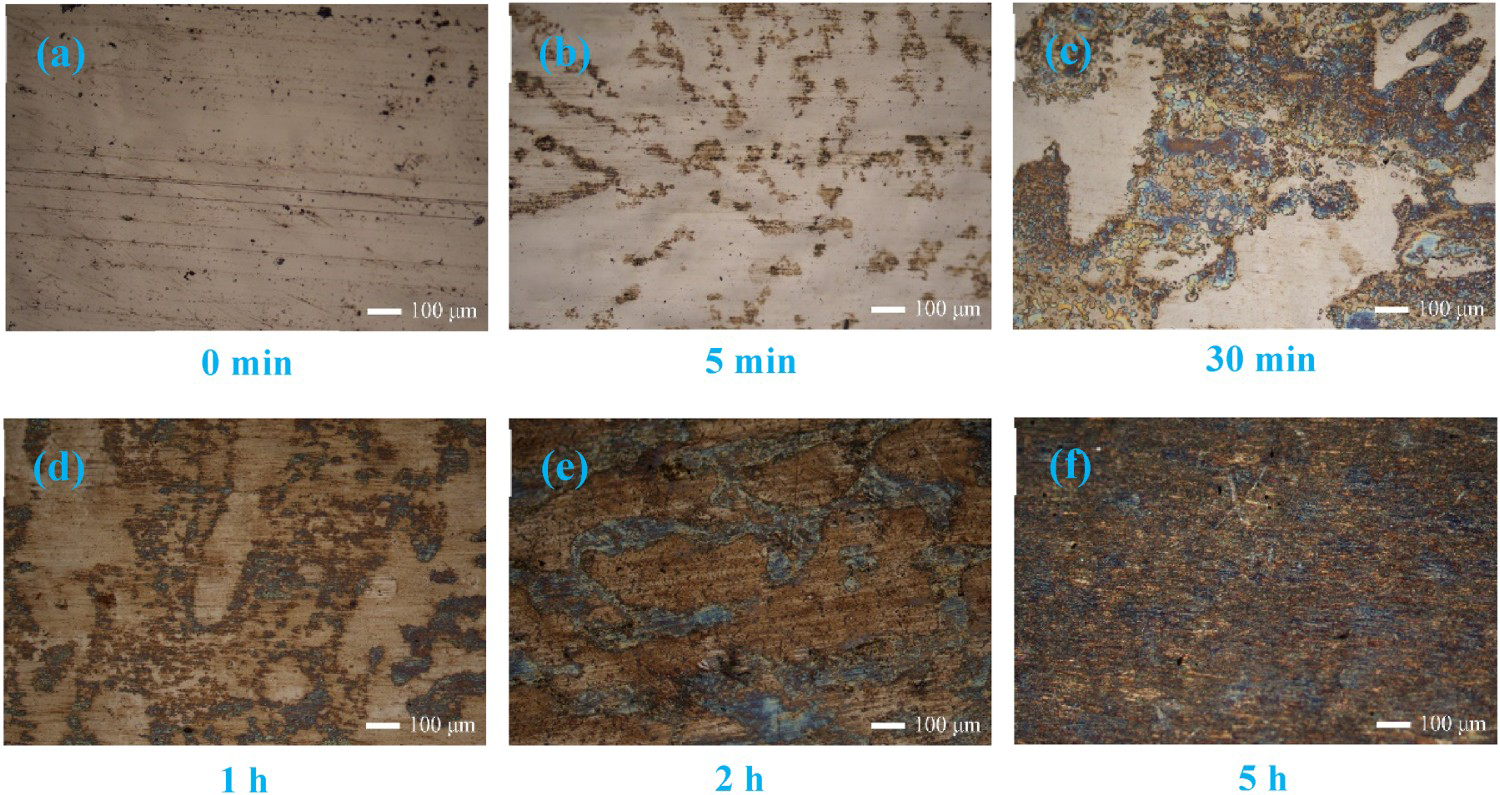
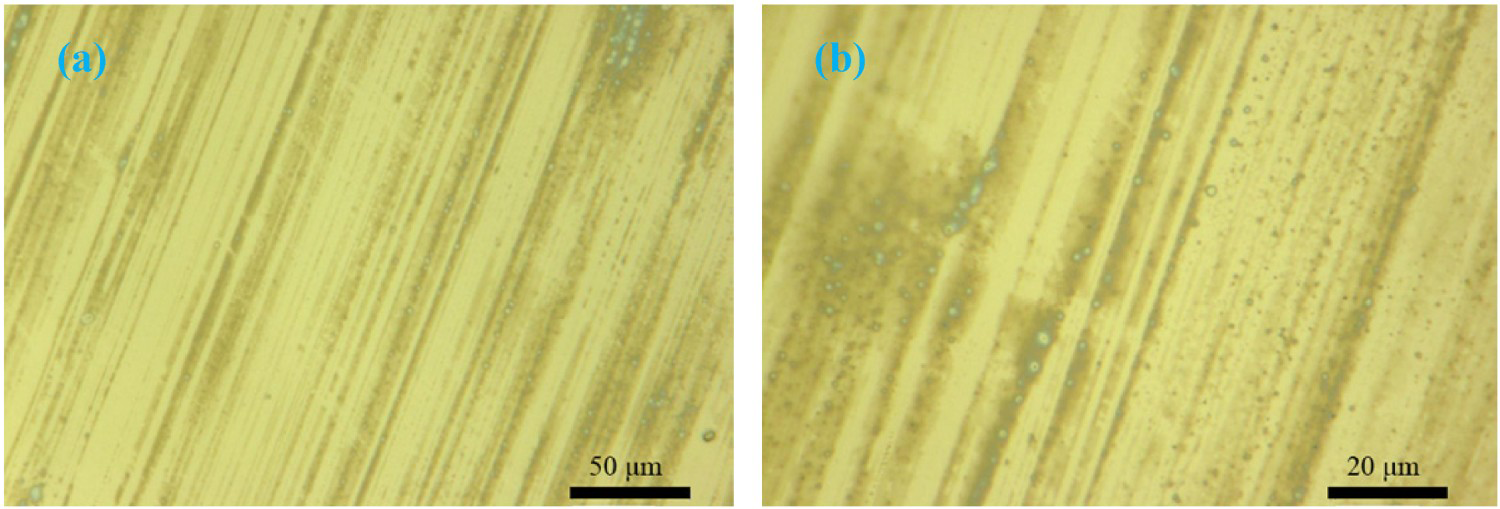
Figure 8 shows that the film with a certain thickness formed on the surface of the treated iron-based amorphous alloy substrate. Table 2 shows that as the reaction time increased, the thickness of the surface film increased, and the thickness of the substrate decreased. The above results indicate that the surface films formed by the reaction were endogenous conversion films. As the thickness of the film increased, the surface film tended to peel off the substrate, and the interface bonding deteriorated.
Surface film changes after (a) 2 h, (b) 5 h, and (c) 20 h of surface treatment. Change of surface film thickness with reaction time.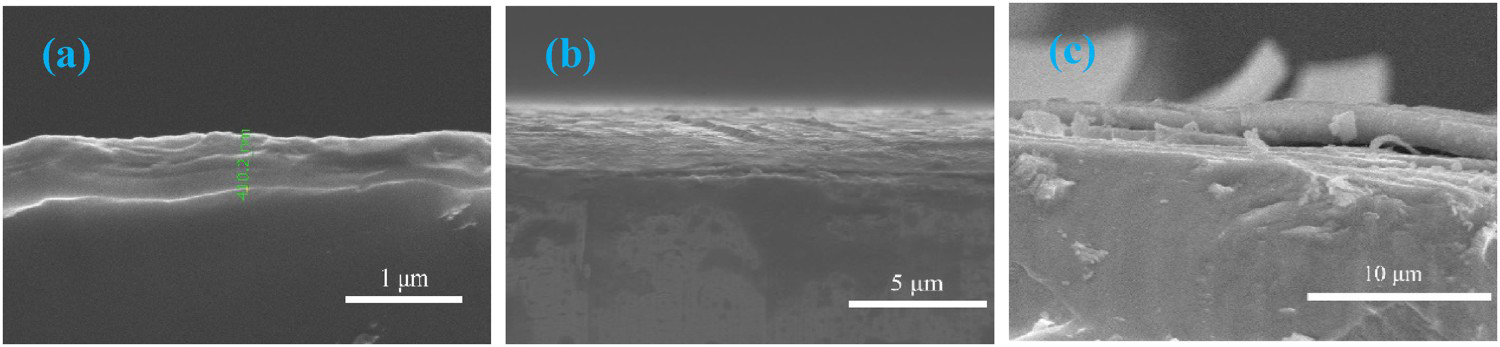

The reason for the deterioration of the interface bonding may have been that the ions in the salt solution firstly adsorbed on local areas on the surface of the amorphous alloy and destroyed the surface. The area where the surface was damaged became galvanic anode, and the undamaged area became cathode. Thus, a passivation-activated battery formed. The area of the anode was smaller than that of the cathode, resulting in a large current density of the anode, and the anode area quickly corroded into small holes. When the corrosion current flowed to the cathode around the small holes, the cathode was protected forming a passivation zone. The anions in the solution migrated into the pores with the flow of current, so that the concentrated solution of metal oxides formed in the pores (corresponding to a decrease in the iron content and an increase in the oxygen content, as shown in Figure 5). The surfaces of the pores continued to remain activated. As the salt continued to hydrolyse, the acid concentration in the pores increases, causing the pores to corrode further until perforation. With the intensification of the pitting corrosion, when layer corrosion was carried out in a structure parallel to the surface and with a certain orientation, the volume of the insoluble corrosion products generated is greater than the volume of consumed amorphous alloy, resulting in a ‘wedging effect’. Insoluble corrosion products propped up the non-corroded amorphous alloy, causing delamination and spalling.
Composite of iron-based amorphous alloy and epoxy
Wettability of iron-based amorphous alloy and epoxy resin
In the experiment, amorphous alloys that underwent surface chemical treatment for different durations were fully immersed in the epoxy resin–acetone mixed solution (the mass ratio of epoxy resin to acetone was 1:1), after which they were slowly removed to observe the surface infiltration of the amorphous alloy. Figure 9 shows a comparative photograph of the 5-h dipping experiment before and after the surface treatment of the amorphous alloy.
Surface wettability test.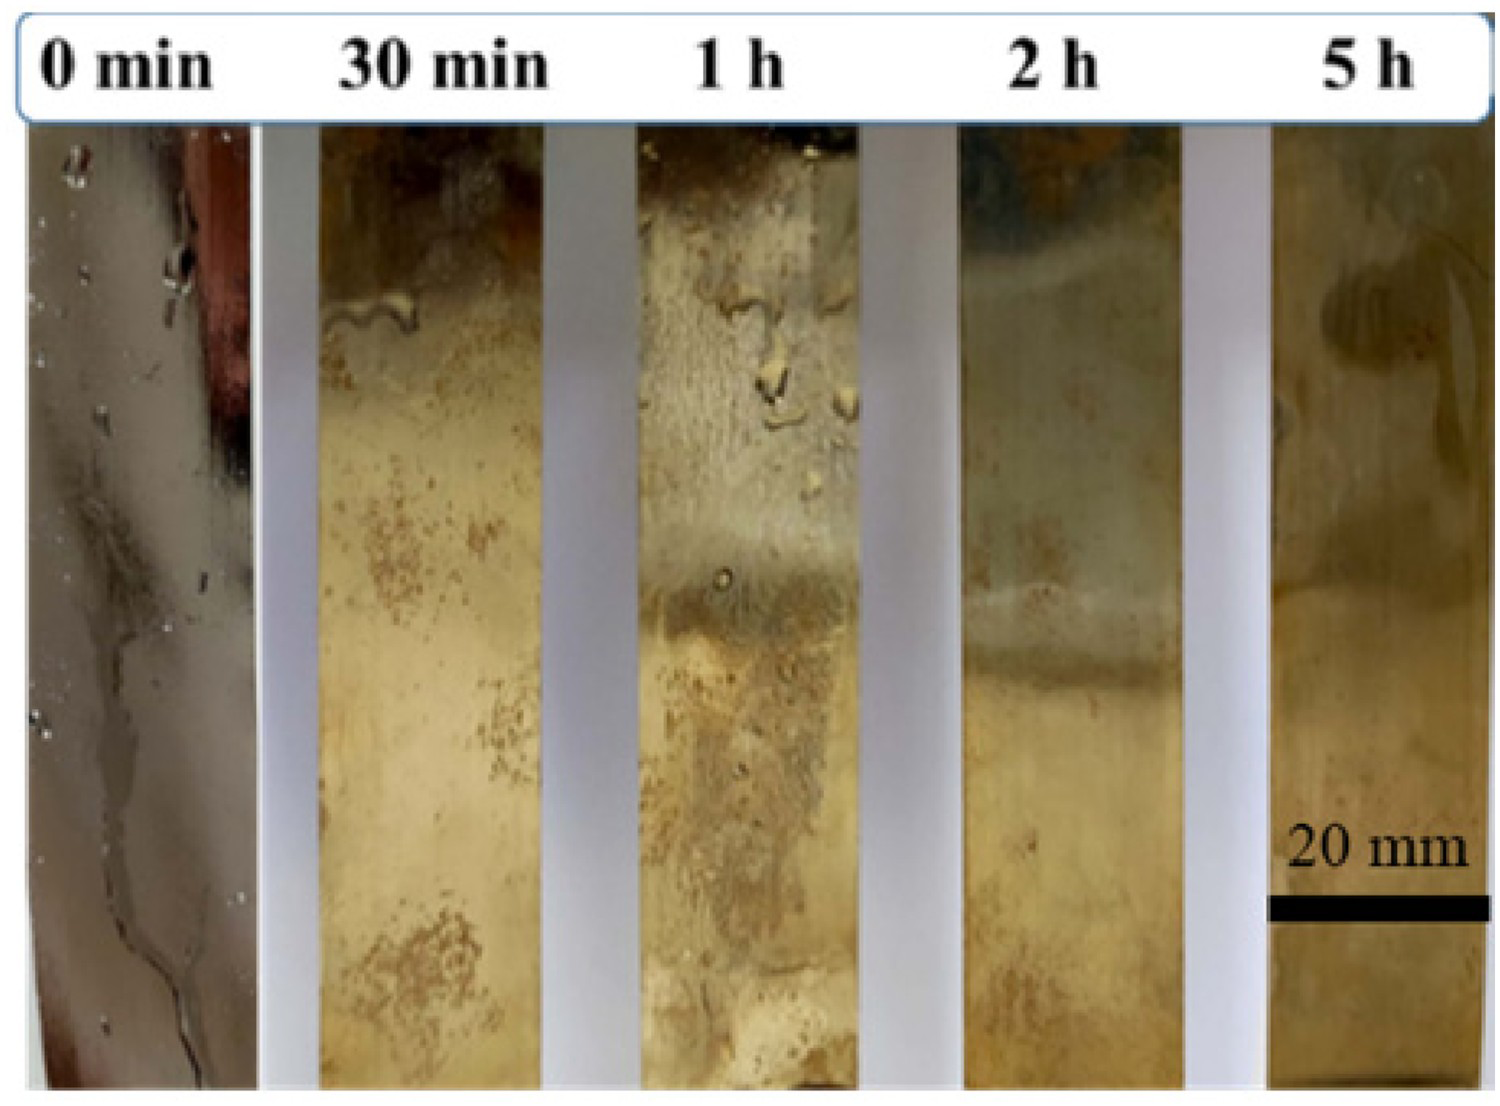
The surface resin of the untreated amorphous alloy shrunk immediately after being removed from the solution, and the shrinking phenomenon became increasingly evident over time. After 1 min, the solution could not completely cover the film surface. After 5 h, only a small amount of solution remained on the surface of the film, and the rest was lost. The amorphous surface treated by the surface reaction showed a good affinity for the test solution and the surface solution did not shrink significantly after removal from the solution. The surface of the amorphous alloy after surface treatment for 30 min and 1 h showed different degrees of shrinkage. However, the surface solutions of the amorphous alloys that were surface treated for 2 and 5 h were evenly distributed without shrinkage, and the distribution of the solution on the surface of the amorphous alloy was still uniform after being suspended for 5 h.
Analysis of conversion coating interface structure
The fracture behaviour of the treated amorphous alloy and epoxy composite was also studied. Figure 10 shows a typical load–displacement curve of a standard single lap. Table 3 shows the shear strength of the interface between the amorphous alloy surface and the epoxy as well as the fracture work of the overlapped samples after different treatment times. The peak load greatly increased after surface treatment. For amorphous alloy samples, the load–displacement curves were divided into three stages: (I) initial elastic deformation stage, (II) plastic deformation stage related to the epoxy resin in the overlap area (uneven plastic deformation exists), and (III) non-linear area deformation and interface peeling stage. Compared with the untreated specimen, the maximum load of the sample increased after surface treatment. After the non-linear region, the failure behaviour in stage (III) and/or the oxide layer caused by the epoxy adhesive was observed.
Typical load-displacement curve. Tensile strength and breaking work of the lap interface of the samples.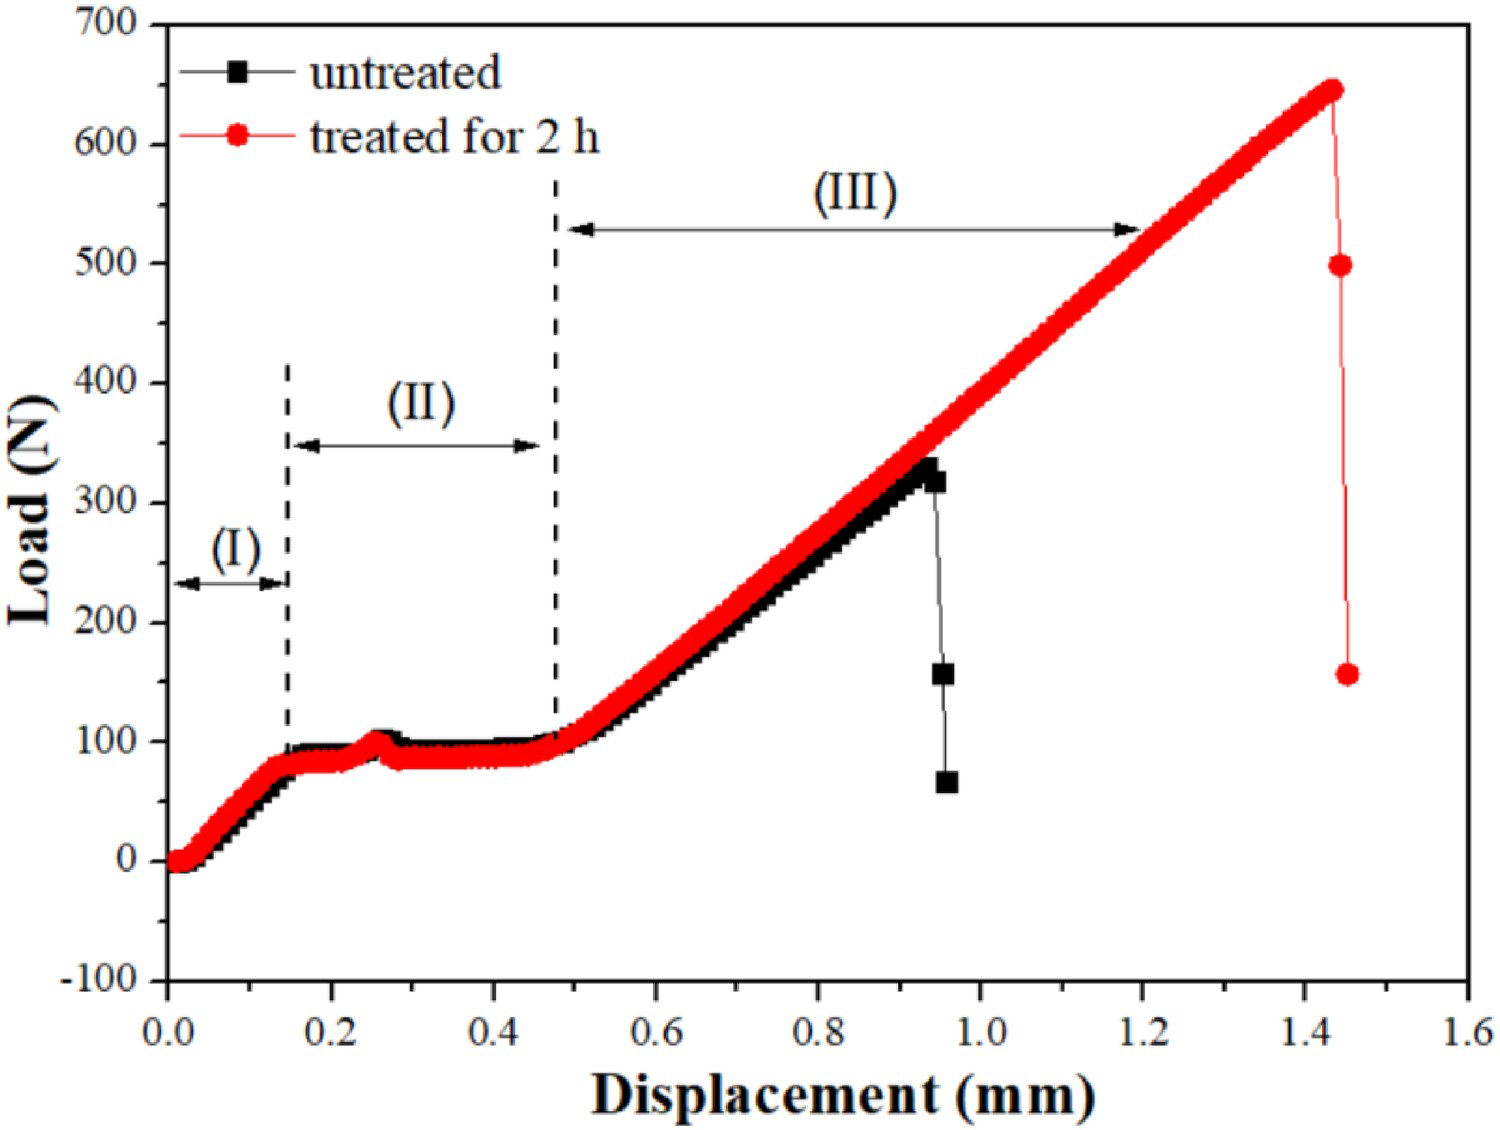

When an external force peeled the epoxy resin from the amorphous alloy, the measured bonding force (Γ) was mainly composed of three parts. The force (Γ0) required for the locking action at the interface to be broken, the force (Γ1) required for the deformation of the endogenous conversion coating of the iron-based amorphous alloy, and the force (Γ2) required for deformation and fracture of the epoxy resin structure at the interface. The measured interface bonding force can be calculated as follows:

Through the salt solution treatment, the surface roughness of the amorphous alloy was improved, and the force (Γ0) required to break the locking action at the interface significantly increased, thereby improving the final interface bonding strength.
Figure 11 shows the surface fracture morphologies of the untreated amorphous alloy and the surface treated 2 h amorphous alloy lap. The failure mode of the lap interface of the untreated amorphous alloy was mainly the debonding of the epoxy and the amorphous interface, and the shear strength and fracture work were 1.38 MPa and 138.56 J m–2, respectively. After surface treatment, the lap interface bonded by the epoxy adhesive was evenly distributed in the bonding area after tensile failure. There was no peeling of the epoxy and amorphous alloy or damage to the surface film. An almost complete epoxy cohesive failure occurred with a high shear strength and fracture work or 2.69 MPa and 395.49 J m–2, respectively. This result showed that the bonding strength between the surface film of the amorphous alloy and the substrate was greater than the bonding strength of the surface film and the epoxy adhesive (there was no separation of the surface conversion film from the amorphous substrate during the experiment).
Fracture morphologies of lap surface of the (a) untreated amorphous alloy and (b) two-hour surface-treated amorphous alloy.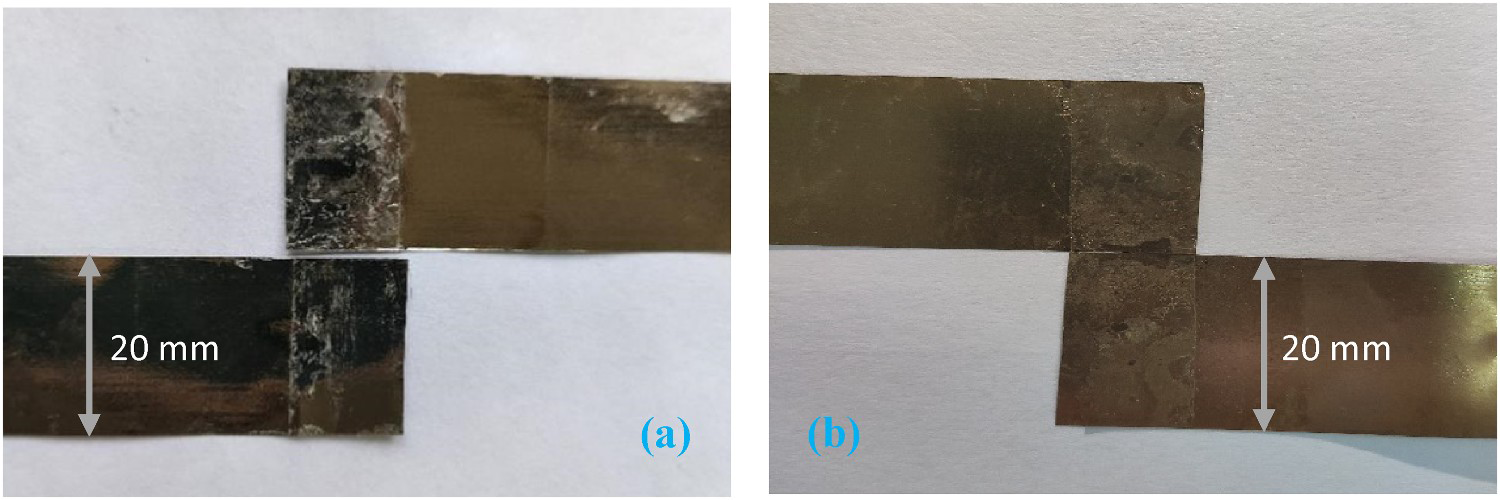
The microstructure image (Figure 12(a)) of the sample after 2 h of surface treatment shows that the surface film structure of the amorphous alloy was uniform and compact, and it was tightly combined with the substrate without voids or peeling. Thus, the amorphous alloy surface film base obtained by the simple and highly repeatable treatment process had a high bonding strength.
(a) Interface structure between the surface film and the amorphous matrix; and (b) bonding interface between the amorphous alloy and the epoxy resin.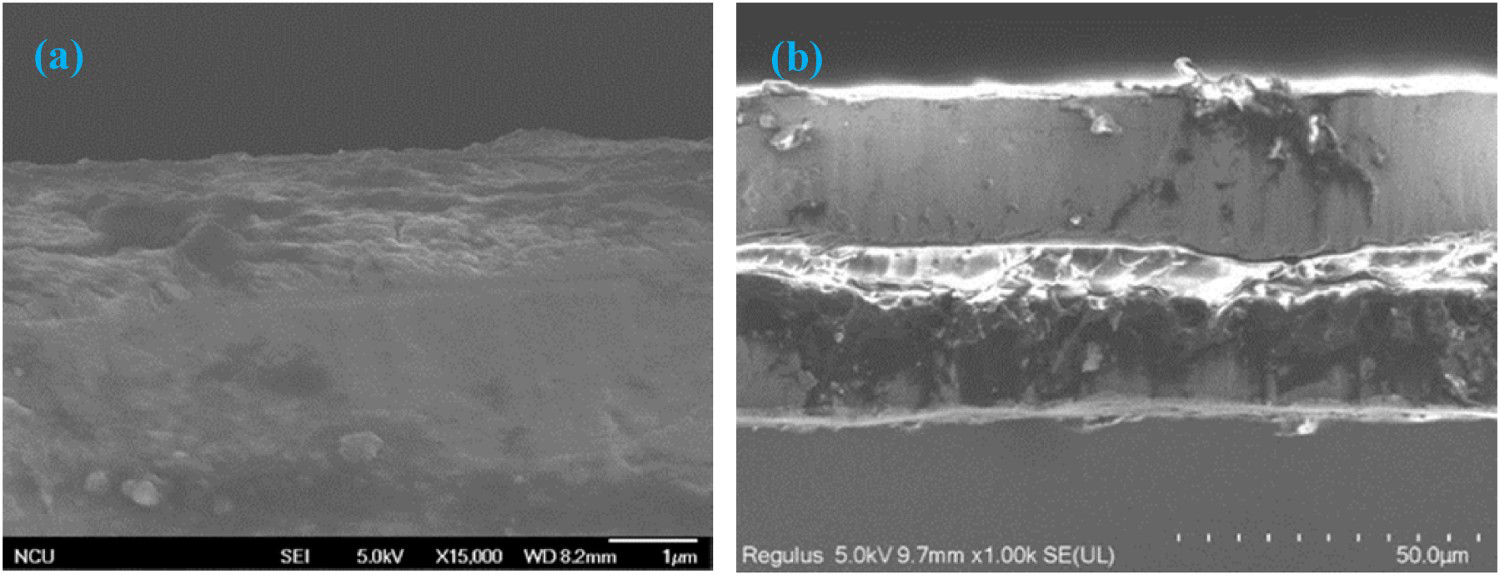
The cross-sectional image (Figure 12(b)) showed that the surface film of the amorphous alloy after the surface treatment was tightly bonded with the epoxy glue, and there was no void delamination.
Conclusion
In this study, an endogenous conversion coating was prepared on a smooth and clean amorphous alloy surface by the combination of wet etching and chemical reaction. The composition of the conversion film was iron oxide and iron–silicon complex Fe3[(FeSi)O4(OH)]5. The conversion film, approximately 1 μm thick, was uniformly attached to the surface of the iron-based amorphous alloy. The conversion film successfully solved the non-wetting problem of the iron-based amorphous alloy and the packaging polymer resin. The iron-based amorphous alloy attached with the conversion coating could be fully wetted by the epoxy resin glue. The tiny etched voids and evenly distributed oxide corrosion circles on the surface of the conversion film increased the interface bonding strength between the iron-based amorphous alloy and the resin, creating a foundation for the application of iron-based amorphous alloy composites with other materials. The surface conversion film was firmly bonded to the interface of the iron-based amorphous alloy matrix. The amorphous alloy ribbon bonded by epoxy glue was interfacially lapped on the experimental surface. The interfacial shear failure was dominated by the cohesive failure of the epoxy. The shear strength and fracture work were 2.69 MPa and 395.49 J m–2, respectively, which were 95% and 185% higher than those of the untreated iron-based amorphous alloy.
Footnotes
Disclosure statement
No potential conflict of interest was reported by the author(s).