





Abstract
Morphology of polyamide/maleic anhydride grafted ethylene-propylene-diene monomer/high density polyethylene (PA6/EPDM-g-MA/HDPE) blend and crystallisation behaviour of HDPE in PA6/EPDM-g-MA/HDPE blend were studied by scanning electron microscopy, transmission electron microscope and differential scanning calorimetry (DSC). Morphology observation revealed that core–shell morphology with shell of EPDM-g-MA and core of HDPE was formed in PA6 matrix. DSC test indicated that unexpected result of HDPE double crystallisation peaks emerged for ternary blend system. Also the low temperature crystallisation peak of HDPE was confirmed to be induced as a result of hindered nucleation of HDPE in fine dispersed core–shell particles and the process of crystalline shrinkage of PA6 matrix during cooling process. Furthermore, the factors influencing the crystallisation behaviour of HDPE were systematically studied in this work. The content of EPDM-g-MA and the time of melt mixing significantly affected the crystallisation behaviour of HDPE while the crystallinity of PA6 had a little effect on the crystallisation behaviour of HDPE. The results demonstrated an intimate relationship between phase morphology and crystallisation behaviour of HDPE.
Introduction
Polymer blending of conventional polymers is economical and sometimes technically necessary materials for various applications.1-3 On the one hand, the morphology of polymer blends is a key factor that determines their properties. So the phase behaviour of polymer blends has been the focus of both theoretical and experimental research in the field.4, 5 On the other hand, molecular architecture includes various amounts of short and long chain branches that strongly influence the crystallinity index of semi-crystallisation polymers. As a direct consequence, a very large panel of mechanical properties from stiff plastics to thermoplastic elastomer is available.6-9 In the past decades, a vast number of studies have been devoted to the study of binary polymer blends and the binary system can exist the dispersed phase-matrix, fibrillar, and co-continuous morphologies.10-15 Ternary A/B/C systems can exist in two possible states. One is known as complete wetting and the other is partial wetting. Complete wetting can result in B and C droplets individually dispersed in an A matrix. In the partial wetting state, all three phases have an interface with each other. Torza and Mason 16 and then Hobbs et al. 17 employed a modified Harkins spreading theory to predict the morphology of a ternary blend. In recent years, much more attention has been paid to the morphology evolution of ternary or multi-component polymer blends. Omonov et al. 18 studied the phase morphology development for blends of polypropylene (PP) and polystyrene (PS) in a polyamide (PA6) matrix. They found that depending on the composition either a dispersed encapsulated (or not) or a co-continuous three phase morphologies are developed. Zhang et al. 19 developed a double-percolated structure in which PS was situated at the interface of HDPE and polymethyl methacrylate (PMMA) by employing Harkins equation and controlling the composition of phases. Valera et al. 20 predicted the morphology of PMMA/PP/PS ternary blends by spreading coefficient, minimum free energy, and dynamic interfacial energy phenomenological models. Most recently, Ravati and Favis 21 had used polyaniline as a conductive polymer to prepare a low percolation threshold conductive device through the control of multiple encapsulation and multiple percolation effects in a five component high density polyethylene/PS/PMMA/polyvinylidene fluoride/polyaniline (HDPE/PS/PMMA/PVDF/PANI) polymer blend system through melt processing and found that percolation threshold in the multi-component polymer blend was sensitive to the morphological continuity of the various encapsulated phase networks.
In the multi-component polymer blends containing both semi-crystalline and non-crystalline components, the crystallisation behaviour and crystal structure of semi-crystalline component can be significantly influenced by the obtained morphology of the multi-component polymer blend.22-25, 18, 26 Tol et al.22-25 systematically studied the relation between the blend phase morphology and the fractionated crystallisation behaviour of PA6 in immiscible PS/PA6 and (polyphenylene oxide/PS)/polyamide (PPE/PS)/PA6 blends with or without compatibilizers. They found that the particles size and size distribution of PA6 droplets significantly affected its crystallisation behaviour. Fractionated crystallisation is strongly enhanced in the submicron-sized PA6 droplets, leading to a delay of crystallisation to very high supercoolings and ultimately to crystallisation at a low temperature. Omonov et al. 18 showed the phase morphology development in a ternary blend based on the PA6, PP and PS. They confirmed that with the PA6 particle size decreased, the crystallisation due to heterogeneous nucleation has completely disappeared and new crystallisation exotherm resulting from homogeneous nucleation emerged. In our laboratory, Li et al. 26 successfully controlled the core–shell morphology with shell of EPDM-g-MA and core of HDPE in PA6/EPDM-g-MA/HDPE ternary blend via applying different processing methods. Double crystallisation exotherm of HDPE was observed and this phenomenon originated from the formation of core–shell morphology of EPDM-g-MA and HDPE.
Based on the previous study in our laboratory, 26 an unusual crystallisation phenomenon of HDPE was found in PA6/EPDM-g-MA/HDPE blends. However, previous work was only qualitative on the formation of unusual crystallisation of EPDM-g-MA and HDPE, the formation mechanism and influence factors of this unusual crystallisation behaviour of HDPE had not been paid sufficient attention. As a consequence, the main goal of the study reported here was to study the effects of EPDM-g-MA content, melt mixing time, and PA6 crystallinity on the crystallisation behaviours of HDPE in PA6/EPDM-g-MA/HDPE ternary blend. Additionally, we tried to prove that the core–shell morphology played a key role on the crystallisation behaviours of HDPE.
Experimental part
Materials
Polyamide 6 (PA6) used here, with the grade AKULON F136-C, was kindly supplied by DSM, Netherland; (Tm = 228°C, Tc = 191°C, a density of 1.13 g cm−3 and a melt viscosity of 547.1 Pa s (240°C, 100 L s−1)) Maleic anhydride grafted ethylene-propylene-diene monomer (EPDM-g-MA), with the trademark Bondyram® 7003, was supplied by Bondyram, Israel, which had been grafted with 0.7 wt-% maleic anhydride group and has a melt viscosity of 396.7 Pa s (240°C, 100 L s−1). HDPE was 6098 grade from Qilu Petrochemical Company Ltd, China having a density of 0.95 g cm−3 and a melt viscosity of 436.9 Pa s (240°C, 100 L s−1). All these materials are commercial available.
Blends preparation
Pure, binary and ternary blend were obtained by mixing the components of the blend simultaneously in an internal mixer of a HAAKE torque rheometer at a temperature of 230°C, with a rotor speed of 30 rpm. Before blending, PA6 was dried in a vacuum oven for 24 hours at 80°C. In order to minimise oxidative degradation of the polymer blend, all experiments were conducted under a nitrogen atmosphere. The mixing time is recorded from the moment all the dry-premixed components were fed into the internal mixer. After blending, the blends were taken out of the mixer and immediately dipped cold water to freeze the morphology. The nomenclature used for the blends used in the following of the text is as follows: X–Y–Z–T corresponds to blend containing X wt-% of PA6, Y wt-% of EPDM-g-MA, Z wt-% of HDPE, and T min of mixing time. For example, the ‘PA6/EPDM-g-MA/HDPE 70/20/10-5’ represents a blend obtained by melt mixing the PA6, EPDM-g-MA, HDPE components for 5 minutes with a composition ratio of 70–20–10.
Tests and characterisations
Phase morphology characterisation
A JEOL JSM-5900LV scanning electron microscopy (SEM, JEOL, Japan) at a 20 kV accelerating voltage was used to observe the phase morphology of the blends. The samples were cryo-fractured in liquid nitrogen and the fractured surfaces were sputtered with gold before observation. Moreover, a transmission electron microscope (TEM) (Model: FEI-Tecnai G2F20, USA) was also used to reveal the phase morphology of ternary blends. Ultra-thin sections having minimum thickness of 60 nm were cut using an ultramicrotome (Model: Leica-EM FC6, German) under the condition of sample temperature −80°C. The sections were stained with OsO4 for 10 minutes in order to enhance contrast.
Differential scanning calorimetry (DSC)
DSC measurements were performed on a TA Instrument model DSC Q20 under nitrogen gas flow. About 6 mg samples encapsulated into aluminium pans were submitted to cooling and heating cycles according to the following procedures.
Common DSC test
Samples were quickly heated to 250°C with a heating rate of 100°C min−1 and held at 250°C for 5 minutes to erase thermal history, and then cooled to 40°C at a rate of 10°C min−1 and held at 40°C for 1 minute. Finally, the samples were heated to 250°C again at a rate of 10°C min−1. The crystallisation curve and the second melting curve were recorded.
Special DSC test
To make the PA6 phase in the blends obtaining different crystallinity and to allow all the cooling curves of HDPE phase in the blends to be comparable, the samples were treated according to the following procedures, then all the samples immediately cooled to 40°C at a rate of 10°C min−1, and then heated to 250°C at a rate of 10°C min−1. (a) the samples were heated to 250°C with 100°C min−1, held for 5 minutes, and then cooled to 170°C at cooling rates of 1, 2.5, 5, 10, 20, and 40°C min−1; (b) the samples were heated to 250°C at a rate of 100°C min−1, held for 5 minutes, and then cooled at a rate of 80°C min−1 to different isothermal crystallisation temperature (203, 201, 199, 197 and 195°C) and held for 15 minutes, and then cooled to 170°C at a rate of 80°C min−1; (c) the samples were heated to and then cooled at a rate of 80°C min−1 to 197°C and held for different periods of 0, 1, 2, 5 and 15 minutes, and then cooled to 170°C at a rate of 80°C min−1; (d) the samples were heated to 250°C at a rate of 100°C min−1, held for 5 minutes, and then cooled at a rate of 80°C min−1 to different annealing temperature (170, 160, 150, 140 and 130°C) and held for 30 minutes; (e) the samples were heated to 250°C at a rate of 100°C min−1, held for 5 minutes, and then cooled at a rate of 80°C min−1 to 170°C and held for different periods of 1, 5, 10, 20 and 40 minutes.
Results and discussion
Phase morphology of PA6/EPDM-g-MA/HDPE blend
SEM experiment was carried out to understand the phase morphology of ternary blends. Figure 1 presents several typical SEM micrographs for PA6/EPDM-g-MA/HDPE ternary blend after selectively etching of EPDM-g-MA phase with xylene. The cryo-fractured surface reveals the existence of encapsulated droplets dispersed in PA6 matrix. The white core particles are confirmed to be HDPE phase while the shell are the etched EPDM-g-MA phase. For PA6/EPDM-g-MA/HDPE blend consisted of different composition ratios of EPDM-g-MA and HDPE, the observed morphology are all typical core–shell particles dispersed in matrix and nearly no significant difference of phase structure between them can be found (seen from Fig. 1a–c).
SEM micrographs of PA6/EPDM-g-MA/HDPE blend with EPDM-g-MA etched by xylene: a PA6/EPDM-g-MA/HDPE 70/10/20-5, b PA6/EPDM-g-MA/HDPE 70/15/15-5, c PA6/EPDM-g-MA/HDPE 70/20/10-5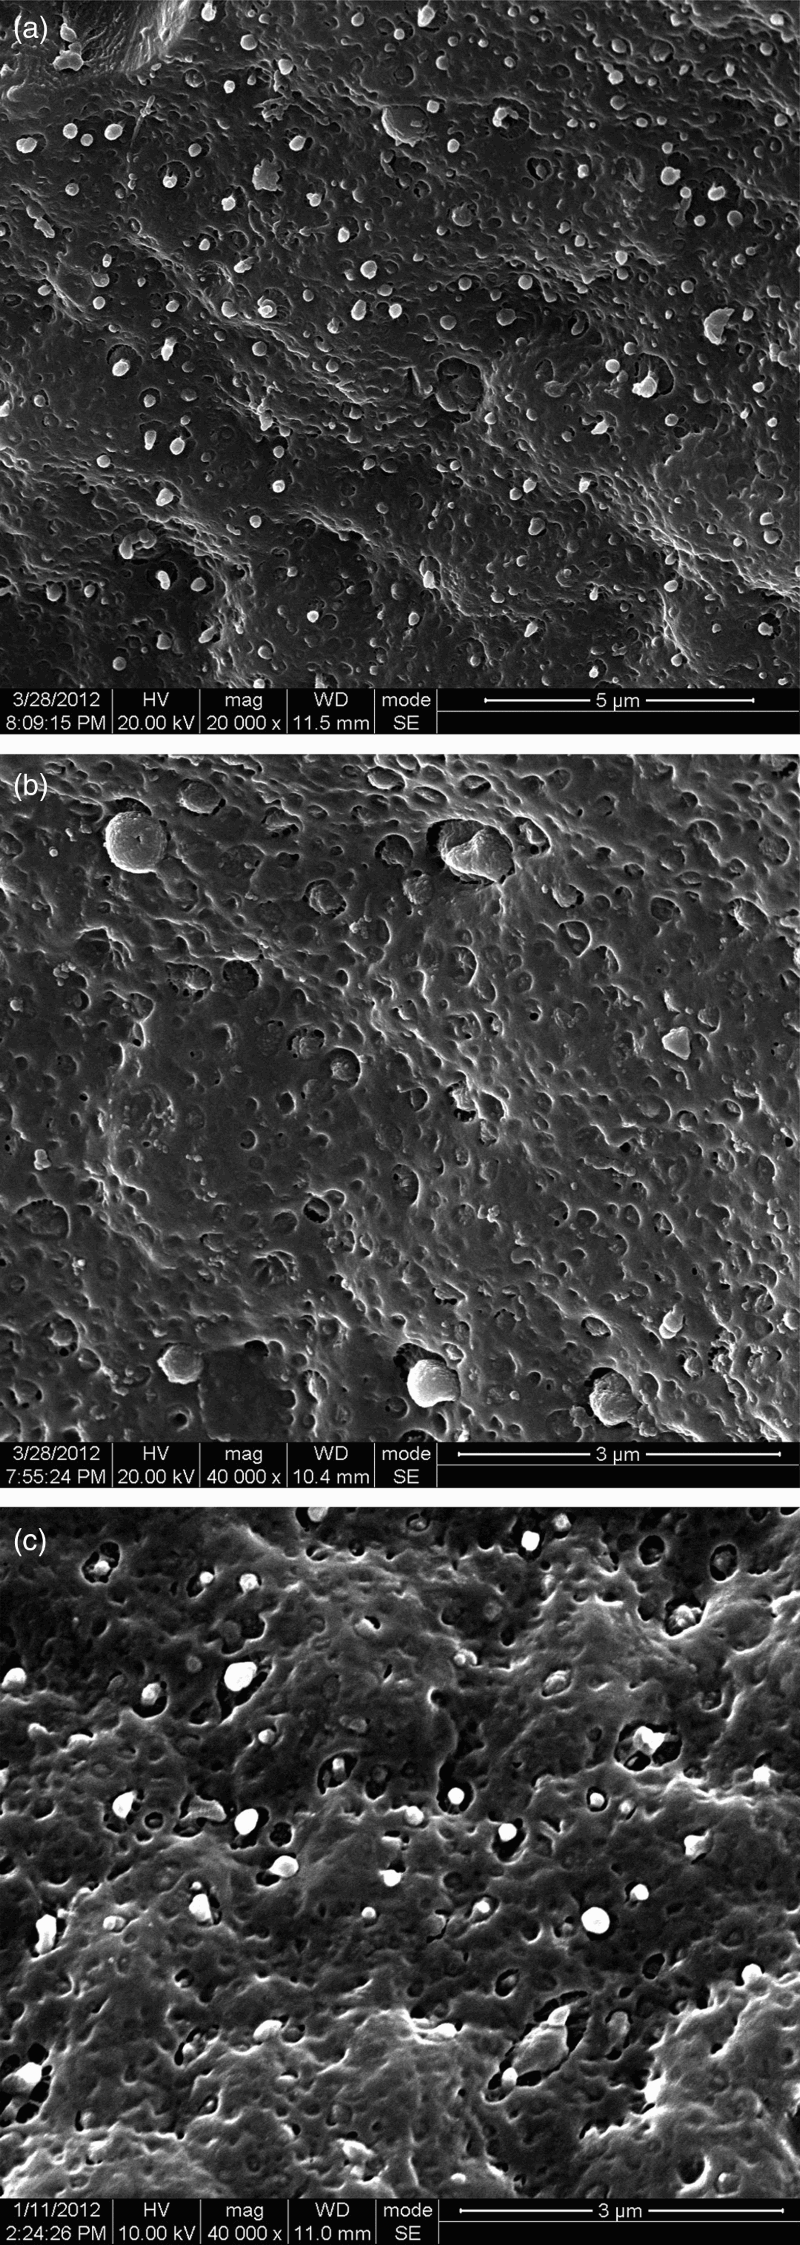
Since the core–shell morphology in ternary blend has not been well characterised via SEM experiment, further TEM experiment has been carried out for the evidence of the formation of core–shell structure (shown in Fig. 2). The dark field represents the rubber phase stained by OSO4. It can be clearly seen that a capsule particle is dispersed in PA6 matrix. Combined with the SEM observation, the core–shell structure with HDPE phase encapsulated by EPDM-g-MA phase was doubtlessly formed in this ternary blend.
TEM micrographs of PA6/EPDM-g-MA/HDPE 70/15/15-5 blend with EPDM-g-MA stained by OSO4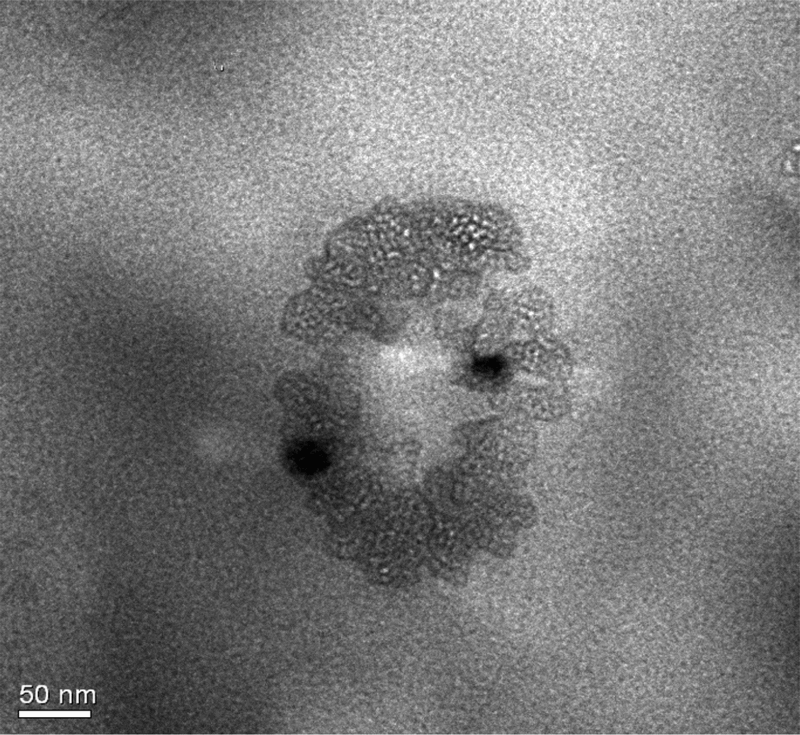
Interfacial tensions and spreading coefficients of the ternary blend components



Contact angle and surface tension results of PA6, HDPE and EPDM-g-MA

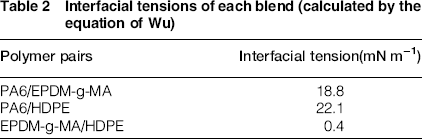
Interfacial tensions of each blend (calculated by the equation of Wu)
As is well known, the phase structure can be stabilised when the system being the one with the lowest interfacial free energy. Hobbs et al.
17
rewrote the Harkin's equation for a ternary system by substituting the appropriate interfacial tensions for the surface tensions values

 ,
,
 and
and
 are the interfacial tension for each component pair, and
 is the spreading coefficient for component 3 (shell) to encapsulate component 1 (core). The index 2 refers to the matrix.
 must be positive for 1 to be encapsulated by 3. They successfully demonstrated the usefulness of the spreading coefficient concept to predict the various morphologies which were formed, and in particular the encapsulation effect.
In our ternary system,
 had a positive value of 2.9 that calculated by equation (4), in which suggested that a core–shell structure with shell of EPDM-g-MA and core of HDPE should be obtained in PA6/EPDM-g-MA/HDPE ternary blends. The above analyses were consistent with the real morphology of ternary blends (shown in Fig. 2).
Crystallisation of HDPE in binary and ternary blend
In general, there is a remarkable relationship between morphology and crystallisation behaviour. The crystallisation behaviour of dispersed droplets of minor phase can be clearly affected by its microstructure and size.18, 22 So the effect of morphology evolution on the crystallisation behaviour should be elucidated clearly.
Figure 3 shows the crystallisation curves of pure PA6, pure HDPE, pure EPDM-g-MA, EPDM-g-MA/HDPE and PA6/EPDM-g-MA/HDPE blends. It can be found that the bulk crystallisation temperature (Tc) of the HDPE and PA6 homopolymers are 115 and 190°C, respectively. These values have not changed in binary EPDM-g-MA/HDPE blend as well as ternary PA6/EPDM-g-MA/HDPE blends. However, interestingly, in addition to Tc1 (Tc) of HDPE, a new crystallisation peak (Tc2) at lower temperature of about 100°C has been observed in the blends of PA6/EPDM-g-MA/HDPE. This seems to be induced by the co-existence of two different HDPE crystal structures or the different crystalline morphologies existing between the bulk of HDPE and the phase interface of HDPE/EPDM-g-MA. To get more insight into the formation of Tc2, much effort had already been done in our previous work
26
and we had already proved that the unusual crystallisation phenomenon of HDPE was not caused by the HDPE crystal structure change. This kind of HDPE unusual crystallisation is caused by some other reasons. First, from Fig. 3a, it is clear that the low temperature crystallisation peak of HDPE phase only exists in PA6/EPDM-g-MA/HDPE ternary blends. And for PA6/HDPE and EPDM-g-MA/HDPE binary blends, there is no observation of low temperature crystallisation peak which means that the core–shell structure plays a key role on the formation of low temperature crystallisation peak. However, from Fig. 3b we can find that after we extract the PA6 phase out of ternary blends, only the bulk crystallisation peak appears for HDPE phase and the low temperature crystallisation peak cannot be observed. Form the above analysis, it can be concluded that not only the core–shell structure but the PA6 matrix both determine the formation of low temperature crystallisation peak of HDPE.
DSC cooling curves of a PA6, HDPE, EPDM-g-MA, EPDM-g-MA/HDPE and PA6/EPDM-g-MA/HDPE blend and b PA6/HDPE blends, and PA6/EPDM-g-MA/HDPE with and without PA6 phase etched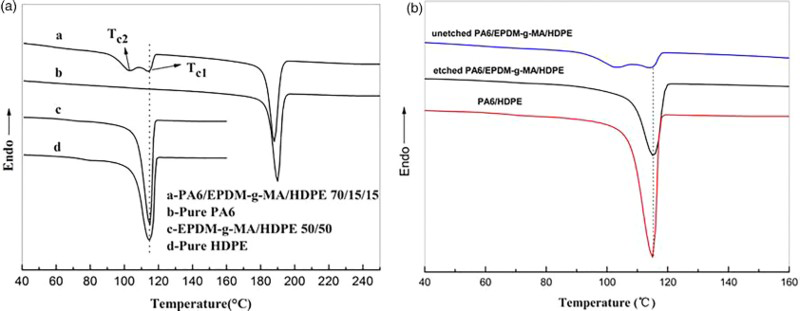
The formation mechanism of unusual crystallisation behaviours can be described as follows: In our system, during cooling, the melted core–shell droplets will subject to external pressure being produced from the process of crystalline shrinkage of PA6 matrix because of its high crystallisation temperature. Owing to the strong interfacial adhesion between PA6 and EPDM-g-MA, the pressure cannot be released through the phase interface by the formation of interfacial cracks. Under the effect of interface pressure between PA6 and EPDM-g-MA, the aggravation of interfacial entanglement of EPDM-g-MA and HDPE molecule chains cannot be freely released and combining a fine dispersion of core–shell particles in PA6 matrix, a hinder nucleation of HDPE will be happened. Therefore, the crystallisation ability for HDPE will be largely influenced and the crystallisation temperature decreases about 10°C compared with that of neat HDPE.
Effects of EPDM-g-MA content on crystallisation behaviour of HDPE
The crystallisation behaviour of HDPE and PA6 in PA6/HDPE/EPDM-g-MA blends was investigated as a function of the concentration of EPDM-g-MA in the blends. In Fig. 4a the DSC cooling curves are shown as a function of the blend composition. It turns out that HDPE crystallisation strongly dependent on the composition ratio of HDPE/EPDM-g-MA while PA6 exhibits a strong crystallisation peak at a constant value of 189°C
30
for all three ternary blends. No significant changes in the bulk crystallisation temperature (Tc1) of HDPE are observed. However, with the EPDM-g-MA content increases, the intensity of the crystallisation exotherm (Tc2) becomes stronger and Tc2 gradually declines to a lower value. From Fig. 4b we can see that the melting temperature of HDPE keeps almost constant for all the blends which indicates that crystal structure has not changed. The above results indicate that low temperature crystallisation peak of HDPE is formed and further affected by EPDM-g-MA content. As confirmed in our previous work,
26
the unusual crystallisation in ternary blend formed at the ‘miscible interface’ between EPDM-g-MA shell and HDPE core, and it was believed that when EPDM-g-MA content in the ternary blend increased, thicker miscible interface could be obtained, leading to more entanglement interface formed. These analysis agree with the change tendency of low temperature peak (Tc2) in Fig. 4a.
The DSC cooling a and melting b curves of PA6/EPDM-g-MA/HDPE blend with a mixing time of 8 minutes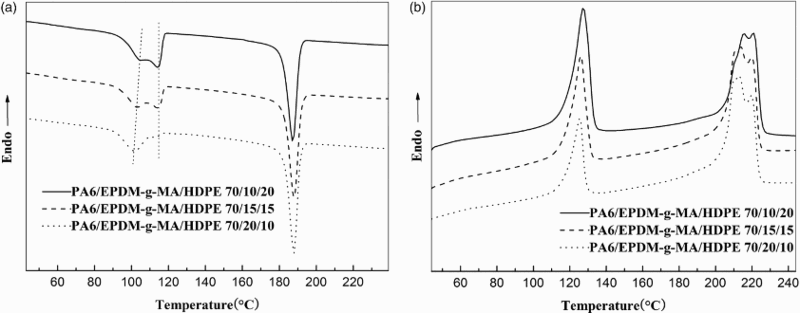
Effects of mixing time on crystallisation behaviour of HDPE
In order to obtain more information about low temperature crystallisation peak of HDPE, another experiment that indicates the strong effect of mixing time on the crystallisation behaviour of HDPE in blends is presented in Fig. 5a. Significant changes in the Tc2 peaks related to unusual crystallisation of HDPE/EPDM-g-MA can be observed during melt mixing different duration time. With the mixing time changed in a range of 2–15 minutes, the amount of Tc2 crystallisation of HDPE increases at the expense of bulk crystallisation at 115°C. The quantitatively change of the Tc1/Tc2 peak area ratio (defined as parameter K) as a function of mixing time was shown in Fig. 5b. It can be noted that at the first time range of 2–5 minutes, the peak area ratio K is far lower than 1 meaning low degree of low temperature crystallisation compared with HDPE bulk crystallisation. As the mixing time extended to 8 min, K increases sharply to … exceeded 1 and keeps about this value even melt mixing 15 minutes. The probable interpretation is that the mixing time can affect the molten-mixing degree which related to the interface thickness of EPDM-g-MA and HDPE. On one thing, the short mixing duration restricts EPDM-g-MA phase to migrate to the PA6/HDPE interface. For another, when the morphology reaches to thermodynamics steady state, more time mixing may has a negligible effect, so K will keep constant after a long time mixing shown in Fig. 5b.
The DSC cooling a curve of PA6/EPDM-g-MA/HDPE 70/20/10 blend for mixing different periods and b Tc2 peak area percentage (%: based on the double crystallisation peaks area of HDPE) as a function of annealing time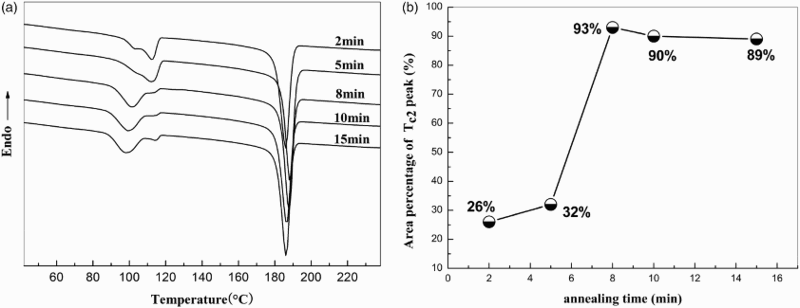
Effects of crystallinity of PA6 on crystallisation behaviour of HDPE
In comparison to the crystallisation curves of the pure HDPE and EPDM-g-MA/HDPE blend, the double crystallisation exotherm of HDPE only emerged in PA6/EPDM-g-MA/HDPE blend (seen in Fig. 3). It may indicate that PA6 matrix has played a crucial role on the formation of the double crystallisation exotherm of HDPE. Here we proposed a hypothesis to explain the double peak crystallisation behaviour of HDPE in our ternary blend system. As is well known, shrinkage stresses can be induced in the process of crystallisation for semi-crystalline polymer in which has been reported by many researchers. In our system, during cooling process the melted core–shell droplets will subject to external pressure being produced from crystalline shrinkage of PA6 matrix because of its high crystallisation temperature (seen in Fig. 3). Owing to the strong interfacial adhesion between PA6 and EPDM-g-MA, the pressure cannot be released by a dewetting process of the interfacial phase and by the formation of interfacial cracks. So under this ambient pressure conditions, the free volume between the molecule chains will be squeezed out leading to reduction of chains motion ability and aggravation of interfacial entanglement of EPDM-g-MA and HDPE phase. Along with subsequently cooling, the interfacial entanglement cannot be timely relaxed and the crystallisation temperature of HDPE phase will be largely restricted and decreased. Based on this hypothesis, and also because the crystallinity of PA6 can be easily controlled by its thermal history. 31 We performs a series of experiments through controlling cooling rate, crystallisation temperature, crystallisation time, annealing temperature and annealing time were used to change the crystallinity of PA6 phase, further investigates whether the HDPE crystallisation behaviour could be affected by PA6 crystallinity. We selected the sample of PA6/EPDM-g-MA/HDPE 70/15/15-8 blend as an example for all PA6/EPDM-g-MA/HDPE ternary blend.
The degree of mass crystallinity (Xc) of PA6 in ternary blend was calculated using the following equation
32
:

 is the heating enthalpy of fusion from the recorded heating scan, Ψ is the PA6 content percentage in the PA6/EPDM-g-MA/HDPE blend, and
 is the heat of fusion of 100% crystalline PA6. Since PA6 falls into two types, α-phase crystal and γ-phase crystal, and for this reason, an average melting enthalpy of 190 J g−1 has been chosen for
 .
33
.
33
Figure 6 shows the DSC crystallisation and melting curves of HDPE phase in the PA6/EPDM-g-MA/HDPE blend after PA6 phase undergoing different cooling rate and the crystallisation and melting characteristics are listed in Table 3. Generally speaking, with the increase of cooling rate, the crystallinity of polymer decreases.
34
It can be seen from Table 3 that Xc of PA6 decreased from 33.6 to 27.6% during the cooling rate changes in a range of 1–40°C min−1 and the Tc2 of HDPE increases from 101.0 to 102.5°C, which suggests that the crystallinity of PA6 may play a role on the enhancement of crystallisation ability. However, the intensity of low temperature peak (Tc2) changed little and also the bulk crystallisation temperature (Tc1) of HDPE still keeps constant.
The DSC crystallisation a and melting b curves of PA6/EPDM-g-MA/HDPE blend after PA6 phase cooled at different cooling rate The crystallisation and melting data of PA6/EPDM-g-MA/HDPE blend after PA6 undergoing different thermal history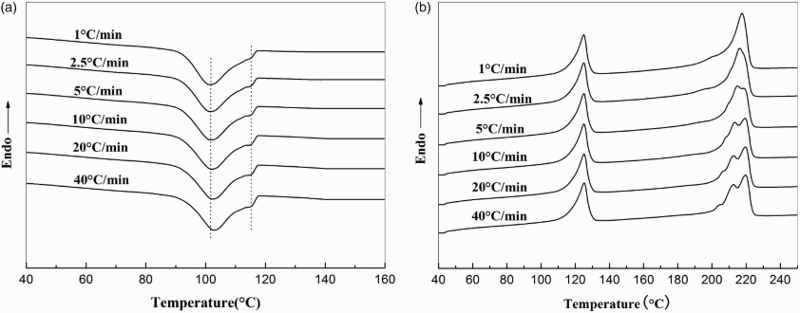
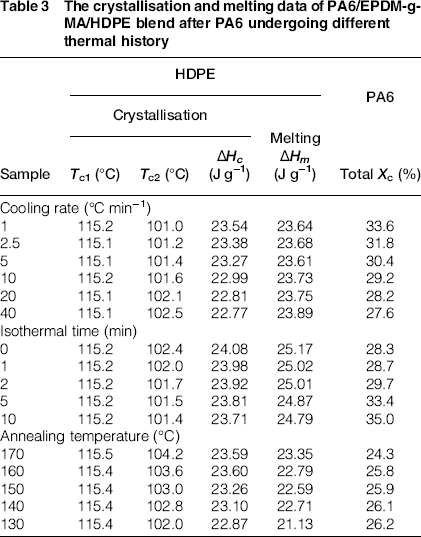
The isothermal crystallisation conditions of polymer melt can also affect the crystallinity of the polymer. Figure 7 presents the DSC crystallisation and melting curves of HDPE in PA6/EPDM-g-MA/HDPE blend after crystallising isothermally at 197°C for different duration, and the detail data are listed in Table 3. Obviously, the increment of Xc of PA6 is about 6.7% when the isothermal time increases from 0 to 10 minutes while Tc2 of HDPE declines about 1°C. It implied that with the Xc of PA6 increased, the Tc2 of HDPE reached a lower value. This result further proved that the increase of the crystallinity of PA6 phase can weaken the crystallisation ability of HDPE. Moreover, the intensity of Tc2 peak has not been obviously changed during the process of isothermal crystallisation. To comprehensively clarify the effect of crystallinity of PA6 on the crystallisation behaviour of HDPE, annealing experiments were carried out. Figure 8 displays the thermal behaviour of PA6/EPDM-g-MA/HDPE blend that has been respectively annealed at different temperature for 30 minutes. The detail data are also listed in Table 3. In order to insure HDPE phase kept melt during annealing experiment, the annealing temperature range was defined from 130 to 170°C. It can be seen in Fig. 8 that Tc2 of HDPE gradually declines with the annealing temperature declines and Tc1 still keeps constant no matter which anneal temperature carries out. In Table 3, it is obviously that Tc2 of HDPE of the blend annealing at 170°C is 2.2°C higher than that annealing at 130°C and meanwhile Xc of PA6 increases about 2% when annealing temperature changes from 170 to 130°C.
The DSC crystallisation a and the melting b curves of PA6/EPDM-g-MA/HDPE blend after PA6 phase crystallised at 197°C for different time The DSC crystallisation a and the melting b curves of PA6/EPDM-g-MA/HDPE blend after PA6 phase annealed at different temperature for 30 minutes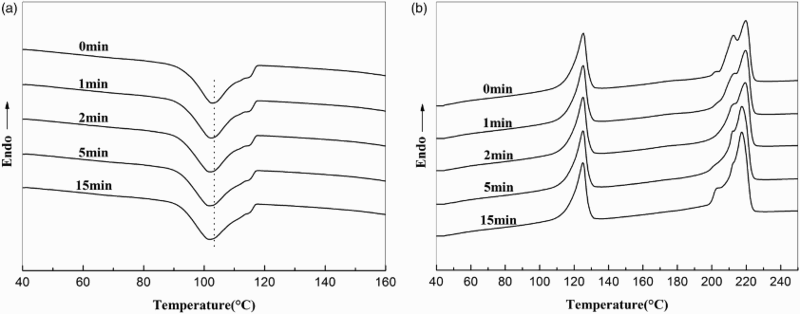
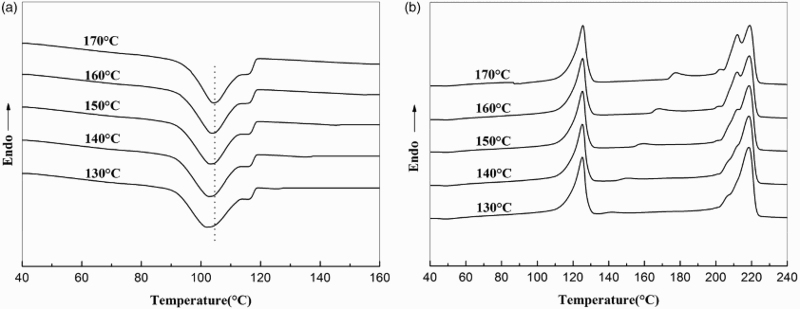
All in all, based on the results obtained from Figs. 6–8 and Table 3, it is indicated that the crystallinity of PA6 play a little effect on the formation of low temperature peak (Tc2). Only some remarkable changes in the value of Tc2 are found when PA6 undergoing different thermal history. Therefore, we believe that the formation of low temperature peak of HDPE is induced by the miscible interfacial phase of EPDM-g-MA shell and HDPE core in PA6 matrix. It is the space restriction of core–shell particles and molecules entanglement of EPDM-g-MA/HDPE rather than the crystallinity of PA6 that make responsibility for the formation of low temperature peak of HDPE.
Conclusions
Melt-mixed blend of PA6/EPDM-g-MA/HDPE were prepared using an internal mixer. The effects of EPDM-g-MA content, melt mixing time, and PA6 crystallinity on the crystallisation behaviour of HDPE were studied. For PA6/EPDM-g-MA/HDPE ternary blend, DSC results showed two crystallisation exotherm for HDPE. With either the EPDM-g-MA content or the melt mixing time increased, the intensity of the crystallisation exotherm (Tc2) became stronger and the Tc2 gradually declined to a lower value. However, the change of PA6 crystallinity did not remarkably alter the crystallisation behaviour of HDPE, and the effect of PA6 crystallinity on the crystallisation behaviour of HDPE was still controversial. Moreover, it should be confirmed that it was the core–shell morphology with shell of EPDM-g-MA and core of HDPE that induced the double crystallisation peak/shoulder of HDPE in PA6/EPDM-g-MA/HDPE blend. The PA6 matrix, regarding as a role of space constriction, facilitated the formation of low temperature peak of HDPE.
Footnotes
Acknowledgements
The authors gratefully acknowledge the financial support from the National Natural Science Foundation of China (Contract No. 51273219), the National Key Basic Research Program of China (973 Program, No. 2012CB025902) and the Fundamental Research Funds for the Central Universities (No. 2013SCU04A03).