
Abstract
The ongoing overdose crisis is largely fueled by unregulated opioids; therefore, harm reduction measures like drug checking are forced to adapt to the changing supply. Even at low concentrations, fentanyl and its analogues can induce potent effects, particularly when present together. We found that the three most common fentanyl analogues occur individually and in mixtures of each other, and most often below 5% w/w, under the limit of consistent detection by Fourier transform infrared spectroscopy. Using surface-enhanced Raman scattering and random forest binary classifiers, we detected fentanyl (0.2–29.4% w/w), para-fluorofentanyl (0.2–20.0% w/w), and ortho-methyl fentanyl (0.8–27.4% w/w) in real-world samples with high accuracy (0.93, 0.85, 0.93) and precision (0.96, 0.90, 0.96), an improvement over Fourier transform infrared spectroscopy paired with random forest. However, while the surface-enhanced Raman scattering-based model performed exceptionally well for samples with only one target analyte, mixtures of analogues resulted in the suppression of signals from analytes at lower concentrations, complicating their identification. Overall, this demonstrates the need for the detection and distinction of fentanyl analogues below 5% w/w, the applicability of surface-enhanced Raman scattering and random forest classification for real-world samples involving one fentanyl analogue, and the need for future research in competitive binding of fentanyl analogues in mixtures.
This is a visual representation of the abstract.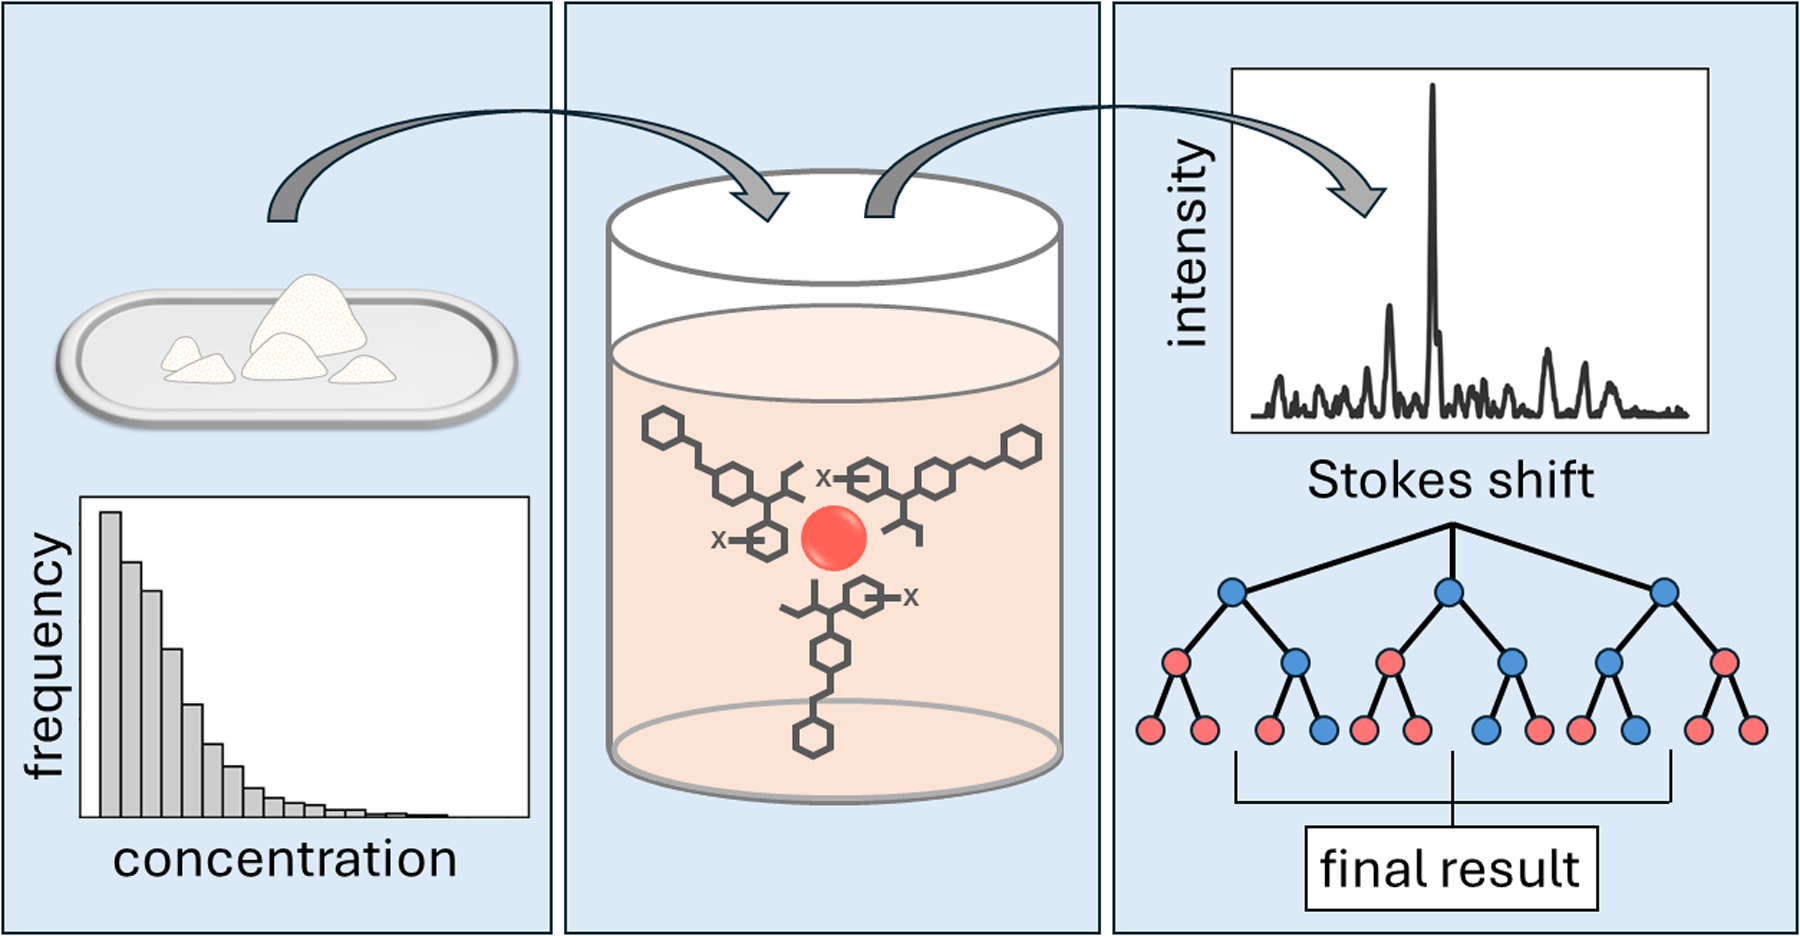
Keywords
Introduction
Illicit drug deaths continue to impact communities worldwide.1,2 A major contributor to overdoses is the unpredictable and toxic drug supply, 3 to the extent that unregulated drug toxicity results in nearly 300 deaths per day in the United States. 4 Since 2016, over 50 000 opioid-related deaths have been recorded in Canada, with fentanyl and its analogues involved in the majority of these cases. 5 As a result, fentanyl and its analogues are a point of interest for harm reduction initiatives. Among these analogues, para-fluorofentanyl (pFF) and ortho-methyl fentanyl (oMF) are currently the most common. 6 The potency of pFF has not been defined, with research finding it weaker, comparable, or stronger than fentanyl,7–9 but pFF has been determined to increase hypothermic response and antinociception compared to fentanyl. 9 Additionally, fentanyl and pFF can increase toxic effects relative to an equal dose of either drug alone. 10 Because oMF is thought to have emerged in the drug supply around 2023, 11 as a new designer fentanyl analogue, little is known about its potency. 6 oMF is suggested to induce comparable effects to fentanyl, 11 but no in vivo studies have investigated oMF or the co-consumption of oMF with fentanyl or pFF. 12 Given the potency of fentanyl and its analogues and the unknown interactions between multiple analogues in a single sample, identifying and differentiating these fentanyls is an important component of overdose prevention efforts.
Drug checking services have been implemented as a harm reduction strategy to address the unregulated drug supply by providing detailed breakdowns of drug sample components.13,14 These services typically employ techniques such as immunoassay test strips, Fourier transform infrared (FT-IR) spectroscopy, and mass spectrometry.15,16 Currently, immunoassay test strips and FT-IR are used widely in North America because both are cost-effective, portable, and simple, making them easily accessible for community drug checking.16–20 Depending on the brand, fentanyl test strips can be sensitive down to 100–200 ng/mL (0.005–0.01% w/w if prepared using 10 mg sample in 5 mL water),17,21 while FT-IR can broadly search for unexpected components. 16 However, fentanyl test strips cannot distinguish between fentanyl analogues, and FT-IR is considered to have limited detection beginning at 3–10% w/w for mixtures of this nature.16,17,22–24 Mass spectrometry can fill the gap in trace analyte identification, but its cost and complexity can make it unattainable for most point-of-care drug checking sites. 25 Therefore, a technique that is affordable and simple but can identify and distinguish trace components in opioid mixtures is needed.
Surface-enhanced Raman scattering (SERS) is a cost-effective and sensitive method that can overcome the limitations of traditional Raman spectroscopy.15,26–28 While normal Raman spectroscopy has been used for drug checking and fentanyl detection, its sensitivity is insufficient for identifying trace components, and opioids and impurities can produce strong fluorescence signals.15,25,28–32 SERS leverages surface plasmon resonance of metal nanoparticles to enhance Raman signals and suppress fluorescence.26,27,32,33 Previous research using laboratory samples has demonstrated that SERS is capable of identifying fentanyl and its analogues, including at low quantities.34–42 However, real-world opioid samples are often complex mixtures that include many components such as benzodiazepines and tranquillizers, different cutting agents, impurities, etc.,6,43,44 Ott et al. successfully employed electrochemical-SERS for the detection of fentanyl or fentanyl analogues in authentic illicit drug mixtures with an accuracy of 88% for samples averaging 6–9% w/w, achieving improved identification over colour test methods. 45 However, the results do not distinguish between fentanyl analogues. Erkok et al. have demonstrated the possibility of distinguishing fentanyl analogues in counterfeit tablets through peak analysis, 42 but there remains a lack of research using SERS for the distinction of fentanyl and analogues in real-world samples that includes chemometric approaches.
Manual interpretation of SERS spectra is challenging, especially for samples with complex matrices, such as real-world opioid mixtures.46,47 As a result, multivariate analysis is often used with SERS.40,47,48 Supervised machine learning methods, such as random forest (RF), support vector machine (SVM), and k-nearest neighbours (k-NN), have been effective for spectral analysis of drug samples due to their ability to handle high-complexity data and identify trace components in contrast to unsupervised methods.39,47,49–54 SERS combined with RF has successfully detected trace components in real-world opioid mixtures 49 and outperformed SVM and k-NN for identifying trace adulterants. 50 RF classification is an ensemble learning technique that fits multiple decision tree classifiers on subgroups of the training data, then combines the results using majority voting. 55 By employing many decision trees, RF improves accuracy and reduces the chances of over-fitting. 55 RF could assist SERS interpretation of fentanyl and analogues while improving sensitivity, specificity, and ease of use.
In this work, we apply binary RF classifiers to SERS spectra of real-world opioid samples to detect and distinguish fentanyl, pFF, and oMF, both individually and in mixtures of each other. Our findings indicate that SERS outperforms FT-IR both in terms of precision and accuracy. This demonstrates that SERS is a viable and practical method for point-of-care analysis of complex opioid samples.
Methods
Sample Selection
The drug samples used in this study were collected from Substance, a drug checking site in Victoria, British Columbia, Canada.
56
As part of this service, samples were analyzed with benzodiazepine immunoassay test strips (Rapid Response, BTNX), paper spray mass spectrometry, and FT-IR for confirmatory testing. All expected fentanyl samples analyzed and quantified at Substance from January 2023 to August 2025, which contained fentanyl, pFF, or oMF (
Samples containing fentanyl, pFF, or oMF below 30% w/w with at least 1.5 mg remaining after confirmatory tests were selected weekly by Substance staff for additional SERS testing (
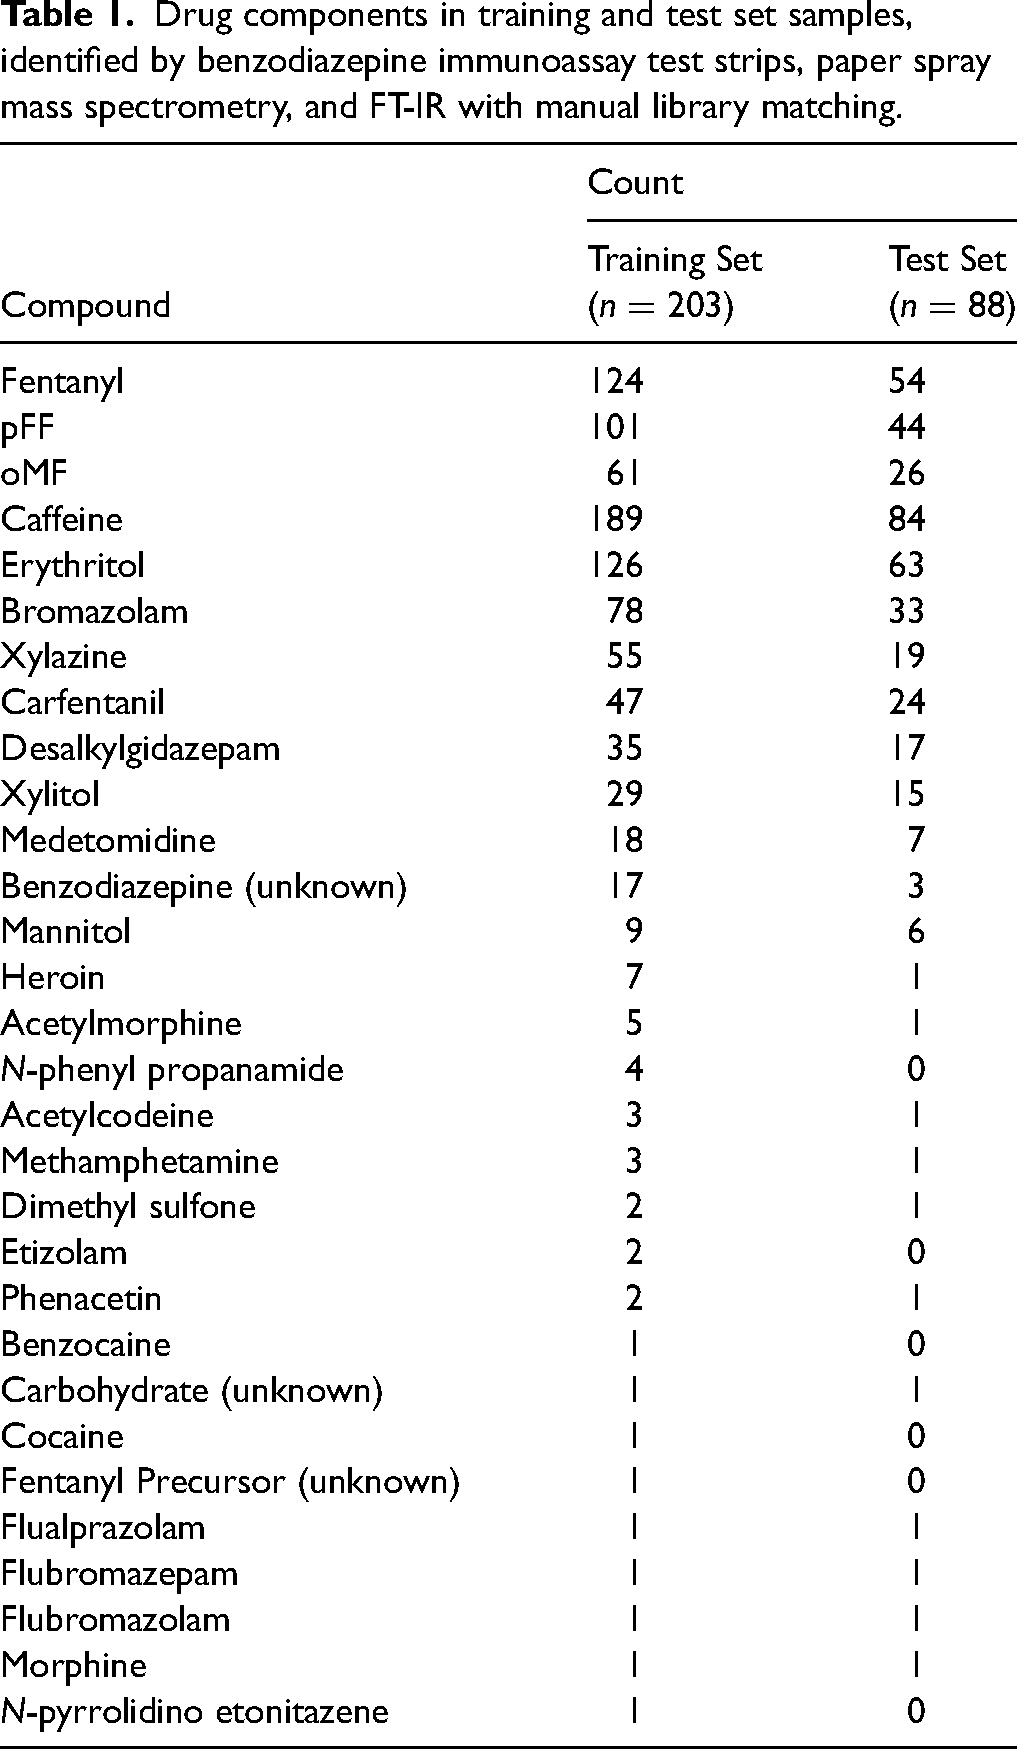
Drug components in training and test set samples, identified by benzodiazepine immunoassay test strips, paper spray mass spectrometry, and FT-IR with manual library matching.
High-noise SERS spectra were removed using a fast Fourier transform and the squared amplitude at each frequency to assign high-frequency scores. Spectra with scores higher than typical, determined using the third quartile of score distributions plus two times the interquartile range, were excluded (
Measurements
SERS measurements were collected using a portable Raman spectrometer (Resolve, Agilent Technologies, Santa Clara, USA) with an 830 nm excitation source. Details of the method and instrumentation are described previously.36,49,50,57 Briefly, powdered samples were suspended in deionized water (18.2 M
FT-IR measurements of powdered samples were collected using a portable ATR-FT-IR spectrometer (Agilent 4500a, USA) with a 45
All samples used in this study were analyzed using a TSQ Fortis triple quadrupole mass spectrometer equipped with a VeriSpray paper spray ion source (Thermo Fisher Scientific, USA). Details of the method and data analysis are previously described.58–62 The current calibration curves for fentanyl, pFF, and oMF cannot accurately quantify above 50% w/w, so samples with concentrations above this limit are set to 50% w/w.
Data Analysis
SERS spectra were corrected for common baseline subtraction artifacts using a median filter with a window size of 10, then each spectrum was min-max normalized. Outlier detection on training set samples was performed separately for SERS and IR data. In the first step of outlier detection, training set spectra were standardized by subtracting the mean and scaling to unit variance. Local outlier factor was used for outlier detection on the first two principal components of each spectrum. The local density around a data point was estimated based on its 20 nearest neighbours, and samples with the lowest 2.5% of density scores were identified as outliers and removed. SERS and IR outliers primarily included spectra with anomalies induced by uncommon components like mannitol, acetylmorphine, and medetomidine. After outlier removal, the final training sets (
Separate RF binary classifiers were developed for each of fentanyl, pFF, and oMF using SERS or IR data. 63 The spectral derivative and four RF hyperparameters were tuned: the number of decision trees, the maximum depth, the minimum samples per leaf, and the minimum samples per split. Hyperparameters were optimized using a five-fold grid search with cross-validation, which evaluates every combination of hyperparameter values for multiple splits of the data. The combination that achieved the highest F1 score for training set predictions was selected, and the final models were trained using these optimal hyperparameters. The grid search values, optimized hyperparameters, and performance metrics for the training of SERS- and IR-based models are shown in Table S1. The decision threshold for test set predictions was set to 0.5.
Results and Discussion
Trends in the Illicit Drug Supply
We analyzed trends in co-occurrence and w/w percentage distributions of expected-opioid samples (
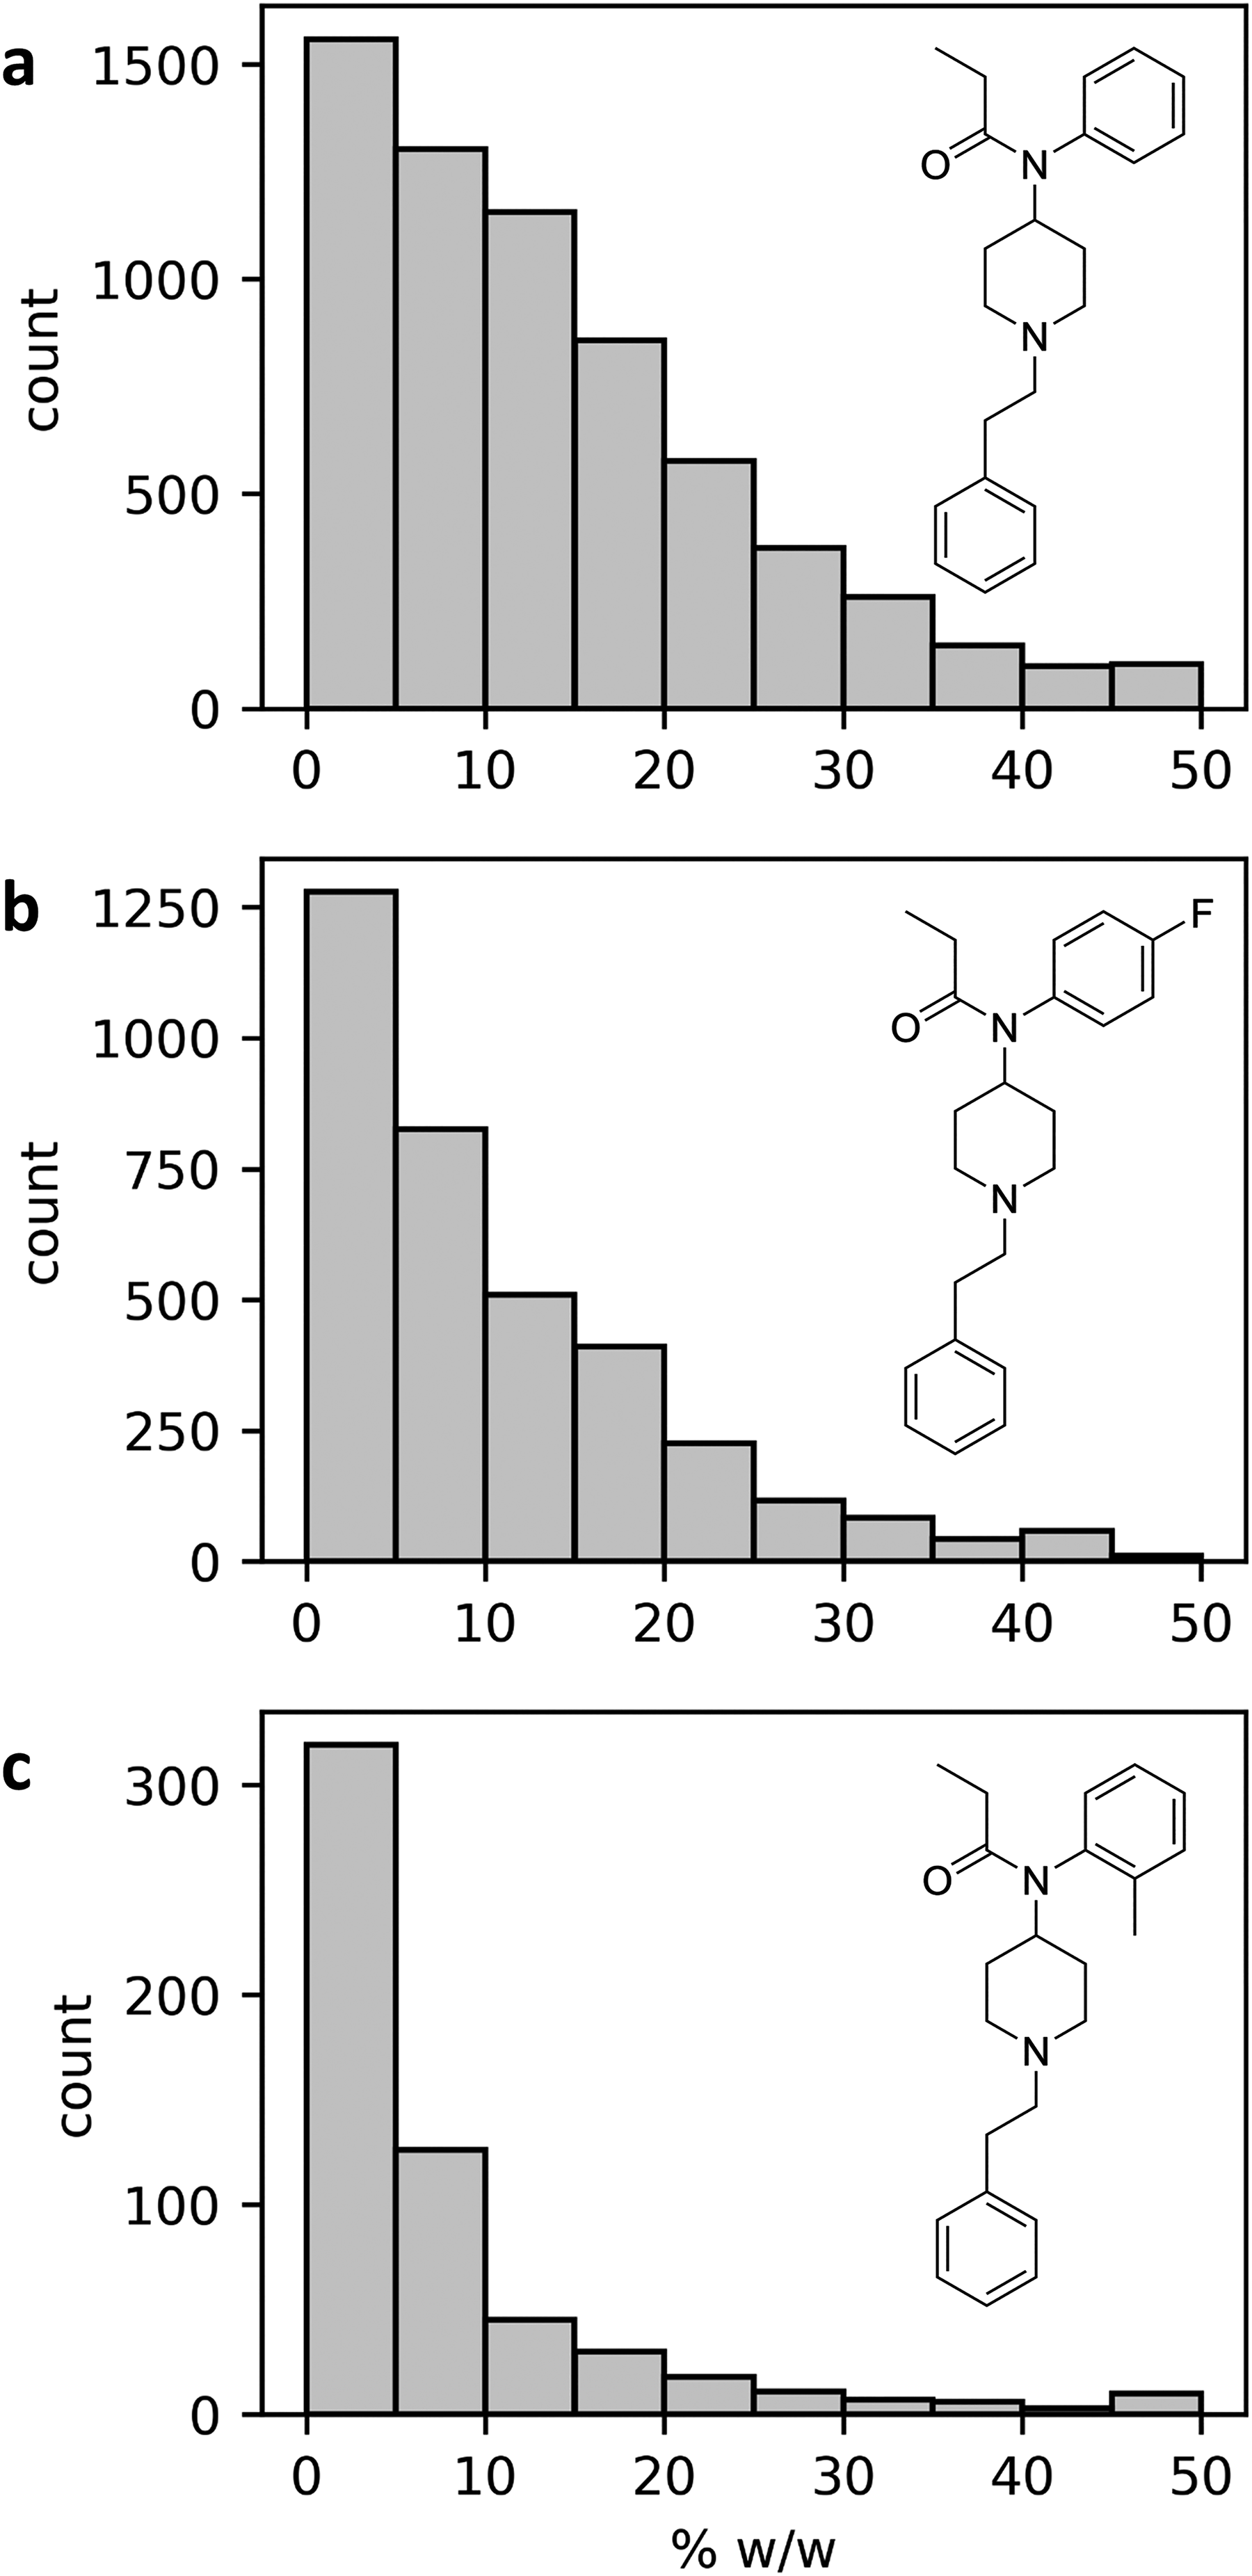
Frequency of fentanyl, pFF, and oMF in expected-opioid samples tested by Substance from January 2023 to August 2025 (
Figure S1 shows the distribution of w/w percentages for single-fentanyl samples (
In contrast, multi-fentanyl samples (
In general, low concentrations of the three analogues were observed most frequently, which highlights the need for more sensitive detection methods than FT-IR. In addition, the high prevalence of multiple, low-concentration fentanyl analogues in a single sample further underscores the need for sensitive techniques capable of differentiating analogues in mixtures.
Feature Importance
The 10 spectral features that the SERS-based models identified as most important for the classification of each fentanyl are shown in Figure 2. The highlighted features in the fentanyl spectrum shown in Figure 2a clustered around the 745 cm−1 peak, which corresponds to CH
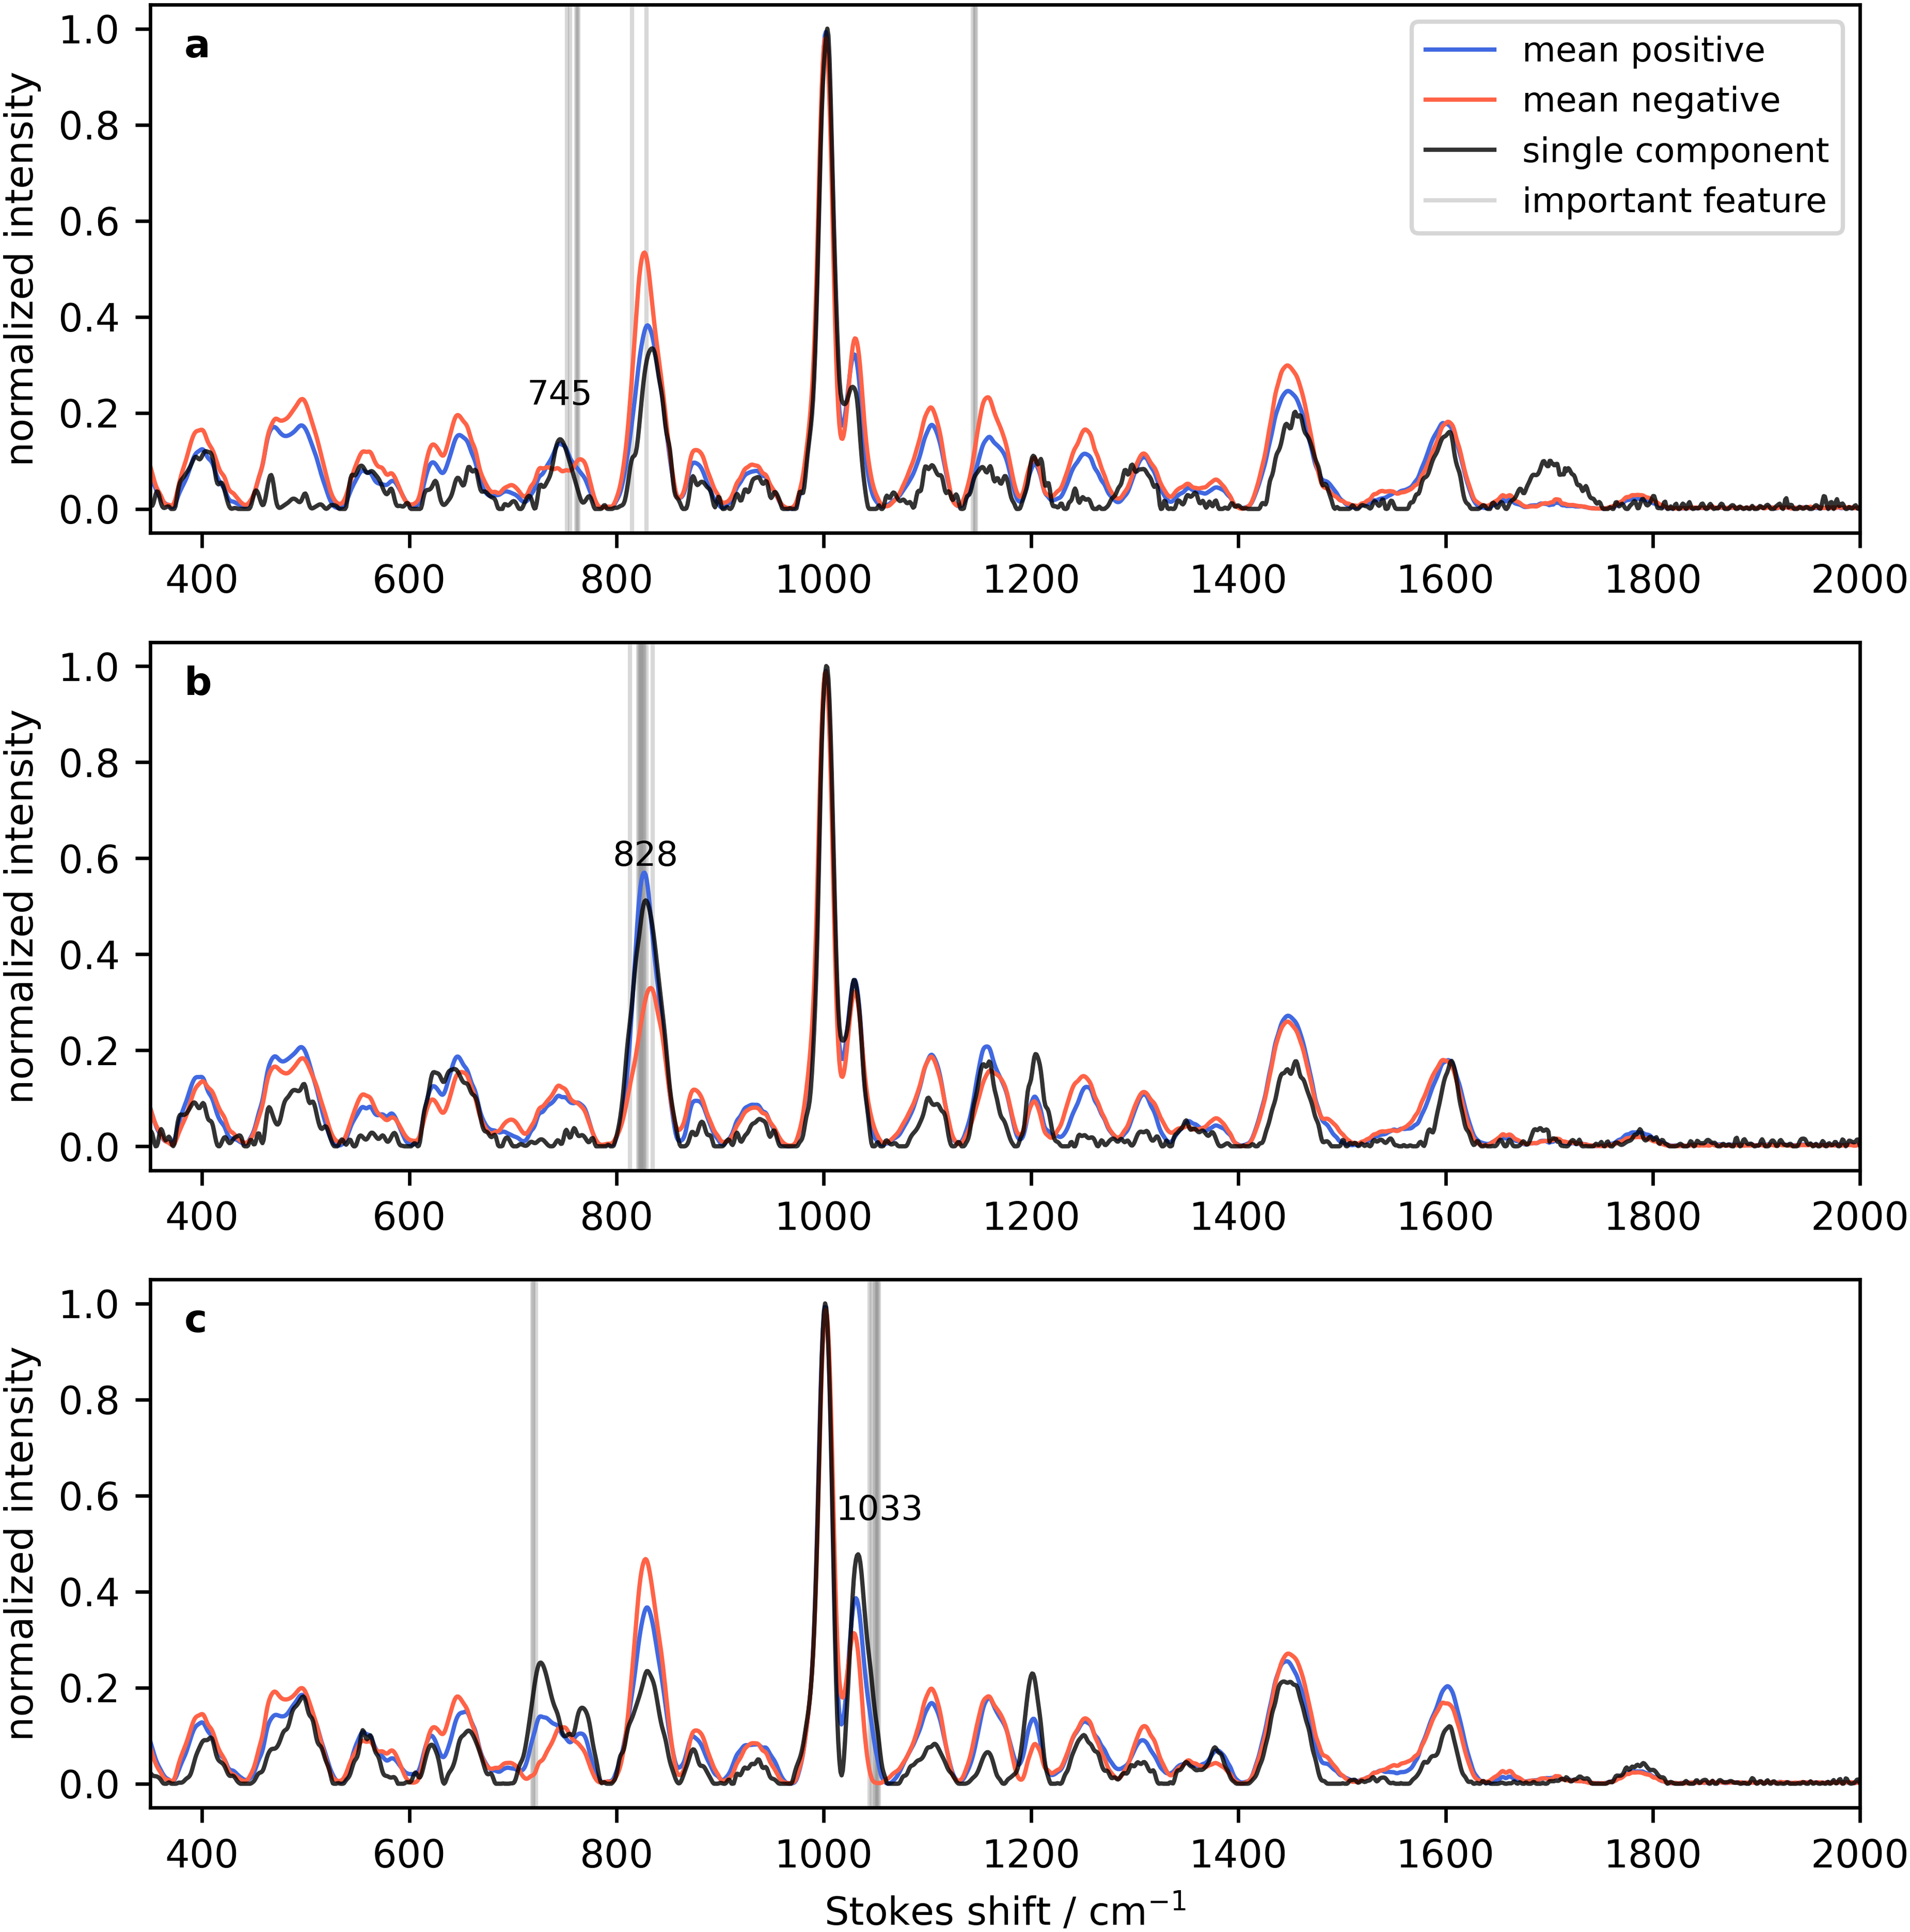
Mean SERS spectra of positive and negative samples, and a single component spectrum with the top 10 most important wavenumbers highlighted by the model: (a) fentanyl, (b) pFF, (c) oMF. Peaks with the majority of highlighted features are labelled. “Single component” refers to samples tested at Substance that were not found to contain any other compounds.
FT-IR spectra were also highlighted with their top 10 features as shown in Figure S4. The highlighted wavenumbers for the fentanyl spectrum were distributed throughout the fingerprint region and the 2500–3000 cm−1 region, none of which identified a single characteristic peak. The majority (six) pFF features highlighted a strong peak at 1506 cm−1, which falls in an area mostly free of bands from cutting agents or other common sample components, making this an ideal peak for classification.68,69 This peak has previously been identified as relevant for the characterization of pFF using an RF algorithm. 53 Half of the oMF features highlighted wavenumbers in the fingerprint region, with the other half highlighting bands in the 2500–3500 region cm−1, none of which identified a clear characteristic peak. 68 Other than pFF, the majority of important features could not be attributed to one strong peak, potentially complicating the classification of fentanyl and oMF.
Model Performance
F1 scores were used to assess the quality of model training. An F1 score takes the product of recall (sensitivity) and precision multiplied by two and divides it by their sum. In hyperparameter tuning, F1 scores are calculated based on the training data, which are displayed in Table S1. The SERS-based models returned the highest F1 scores of 0.84, 0.94, and 0.80, respectively, while the IR-based scores were 0.78, 0.84, and 0.58. This is likely because the SERS models were provided with more spectral features to leverage. 70 This is particularly apparent for oMF, which lacked clear distinguishing features in its IR spectrum, and returned a low F1 score of 0.58. Aside from the F1 score of the oMF-IR model, the SERS- and IR-based models yielded relatively high scores otherwise, indicating suitable training for the other target analytes.
SERS also demonstrated improved performance over IR during model validation. Precision-recall curves for test set predictions are shown in Figure S5 and display results across a range of thresholds. Average precision (AP) values from precision-recall curves were used to assess prediction quality (Figure S5). The SERS-based model returned the highest AP values of 0.99, 0.95, and 0.95 for fentanyl, pFF, and oMF, respectively, while IR-based AP scores were 0.88, 0.94, and 0.67. Although the SERS-based models returned improved AP scores, the AP score of the pFF-IR model was also high. This is likely because of the strong, characteristic pFF peak at 1506 cm−1 in the IR spectrum and higher quality training of the pFF-IR model. In contrast, the low AP score of the oMF-IR model may be attributed to its lack of strong characteristic features and the poorly trained model. Overall, these results support the enhanced detection of fentanyl, pFF, and oMF using SERS compared to IR, and the ability of machine learning to predict the presence of these fentanyls using spectral data with clear characteristic features.
The sensitivity, specificity, accuracy, precision, F1 score, and Matthew’s correlation coefficient (MCC) of test set predictions are shown in Table II. The SERS-based models outperformed the IR models in sensitivity, accuracy, F1, and MCC. Although the pFF-IR returned slightly higher specificity and precision than the pFF-SERS model, the specificity and precision of the SERS-based models were high for all components (specificity: 0.94, 0.91, 0.98; precision: 0.96, 0.90, 0.96 for fentanyl, pFF, and oMF, respectively). Additionally, in drug checking contexts, the sensitivity of a technique is more significant than the specificity, because false negative results have more serious implications. 71 Poorer sensitivity of IR models is expected, given that the median w/w percentages of target components were between 3.8–4.3% in the test set.16,53 The SERS-based models were able to detect target components below the limit of consistent detection of FT-IR, as shown in Table S2. Considering the complexity of the samples being evaluated,43,44 the ability for the SERS models to detect fentanyl and pFF as low as 0.2% w/w (200 ng/mL) is considerable (Table S2). oMF was also successfully detected at its lowest concentrations in the dataset (0.8% w/w (800 ng/mL). These results also suggest that SERS with RF can distinguish between fentanyl analogues despite structural similarities and detect them below the detection limit of typical vibrational technologies such as FT-IR and Raman.16,17,25,29
Summary of prediction metrics for fentanyl, pFF, and oMF from SERS- and IR-based models for all test set samples, the single-fentanyl subset, and the multi-fentanyl subset of binary and ternary mixtures.
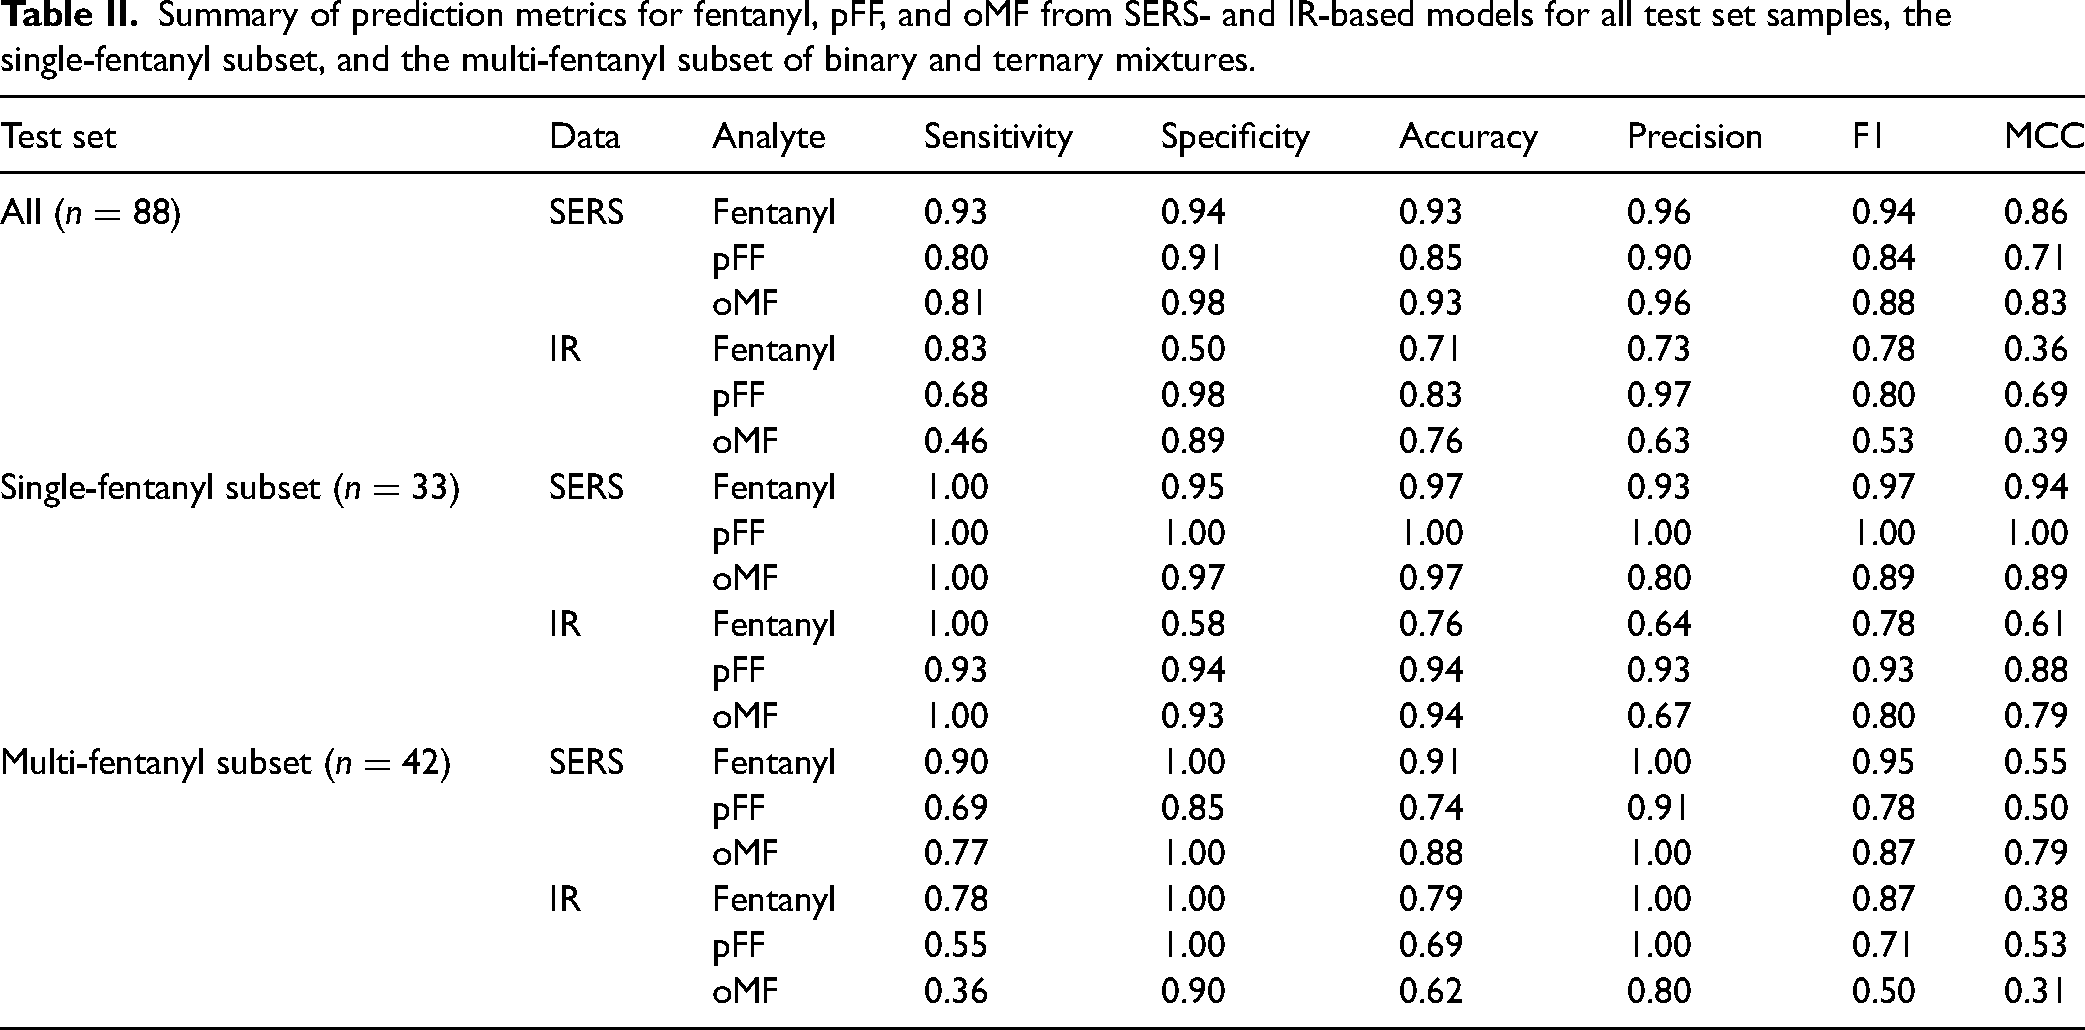
Although the sensitivity of target component detection was improved by using SERS data (SERS: 93%, 80%, 81%; IR: 83%, 68%, 46%), false negative results were investigated to identify methods of further enhancing the sensitivity of the SERS-based models. Single-fentanyl samples (samples with only one of fentanyl, pFF, and oMF, plus any other number of cutting agents, other analogues, or psychoactive substances) appeared to be outperforming binary or ternary multi-fentanyl mixtures of fentanyl, pFF, and oMF (Table S2). Therefore, single-fentanyl samples (
For single-fentanyl samples, SERS outperformed IR in all metrics, as shown in Table II. The SERS-based models were 100% sensitive for all target analytes, higher than in the overall test set (93%, 80%, 81%) (Table II). A similar trend was observed between the sensitivity of IR model predictions of single-fentanyl samples (100%, 93%, 100%) and the overall test set (83%, 68%, 46%). Although IR models also demonstrated high sensitivity, the specificity of the fentanyl-IR model was low (58%), indicating overprediction. The pFF-IR and oMF-IR models demonstrated both high sensitivity (93%, 100%) and high specificity (94%, 93%), suggesting an enhancement of pFF and oMF identification, but not to the extent of the pFF-SERS and oMF-SERS models. However, the pFF-IR model correctly identified pFF at 1.9% w/w, below the limit of consistent detection by IR with library matching.16,17 Enhanced detection by SERS and IR models for single-fentanyl samples suggests that these fentanyls are readily detected in the absence of other target analogues and can be reliably detected at lower concentrations, especially using SERS data. Additionally, these results demonstrate that machine learning can improve analyte identification using SERS or IR data, and they support the expectation that SERS offers higher sensitivity for low-concentration fentanyls than IR.
The sensitivity of all models decreased for binary and ternary multi-fentanyl mixtures, as shown in Table II. Predictions by SERS-based models continued to be more sensitive and accurate with higher F1 and MCC scores than IR models. While specificity and precision were high for both SERS and IR models, comparatively lower sensitivities (SERS: 90%, 69%, 77%; IR: 78%, 55%, 36%) and accuracies (SERS: 91%, 74%, 88%; IR: 79%, 69%, 62%) highlighted a discrepancy between single-fentanyl and multi-fentanyl sample predictions. While SERS-based models outperformed IR models, neither approach was able to consistently detect all fentanyls in a mixture. For SERS, false negative results were more frequent for target fentanyls at lower w/w percentage relative to another (Table S2), a trend previously identified for fentanyl.36,42,57 The SERS models performed best when fentanyls were present at similar concentrations, which is also when identifying each analyte is most relevant, as fentanyl and pFF are known to exert synergistic effects at equal doses. 10 In contrast, the degree of synergism is unknown when these fentanyls are at unequal ratios. 72 The RF-SERS approach would be valuable in drug checking contexts for characterizing mixtures of fentanyl, pFF, and oMF at comparable levels, or identifying the predominant fentanyl.
The decreased sensitivity of SERS model predictions in mixtures of fentanyl, pFF, and oMF, compared with single-fentanyl samples, could be attributed to the complexity of sample matrices and properties of analyte–nanoparticle interactions. Spectral interferences from other sample components can obscure characteristic peaks, an issue also observed in IR-based analysis, which contributes to the limited detection between 3–10% w/w for FT-IR.15–17 In multi-fentanyl samples, the increased number of components could lead to overlapping spectral peaks, further reducing the distinctiveness of analyte features. Also, preferential binding to nanoparticles would influence the detection of components over others. Higher-concentration analytes can outcompete trace analytes for binding sites on the nanoparticle surface,36,57 and differences in the binding affinities of fentanyl, pFF, and oMF may further influence these interactions.15,73,74 Although understanding these interactions could inform the functionalization of nanoparticles or analytical protocols, a single, reliable substrate and method is preferred for implementing SERS in drug checking settings. 15 Instead, the spectra generated by the colloidal gold nanoparticle method were analyzed to investigate the observed sensitivity differences between multi-fentanyl and single-fentanyl samples.
SERS spectra were overlaid at characteristic regions, 745 cm−1 for fentanyl, 828 cm−1 for pFF, and 1033 cm−1 for oMF (Figure 3). For the fentanyl peak at 745 cm−1, the variability in the surrounding peaks contributed to the difficulty of discerning a clear trend. The intensity of the 745 cm−1 peak generally decreased, but the shape varied with increasing quantities of pFF and oMF. The pFF peak at 828 cm−1 diminished in intensity and shifted to higher wavenumbers as the combined fentanyl and oMF concentration increased. Similarly, the oMF peak at 1033 cm−1 decreased in intensity and shifted to lower wavenumbers with increasing concentrations of other fentanyls. The pFF and oMF peaks were not significantly obstructed by other bands or altered in shape; rather, their intensities and shifts were affected. This effect could explain the diminished sensitivity of the SERS-based model predictions in multi-fentanyl mixtures relative to single-fentanyl samples. With these observations in mind, future machine learning algorithms may be designed to handle variations in characteristic features to improve the detection of fentanyl, pFF, and oMF, specifically in multi-fentanyl samples.
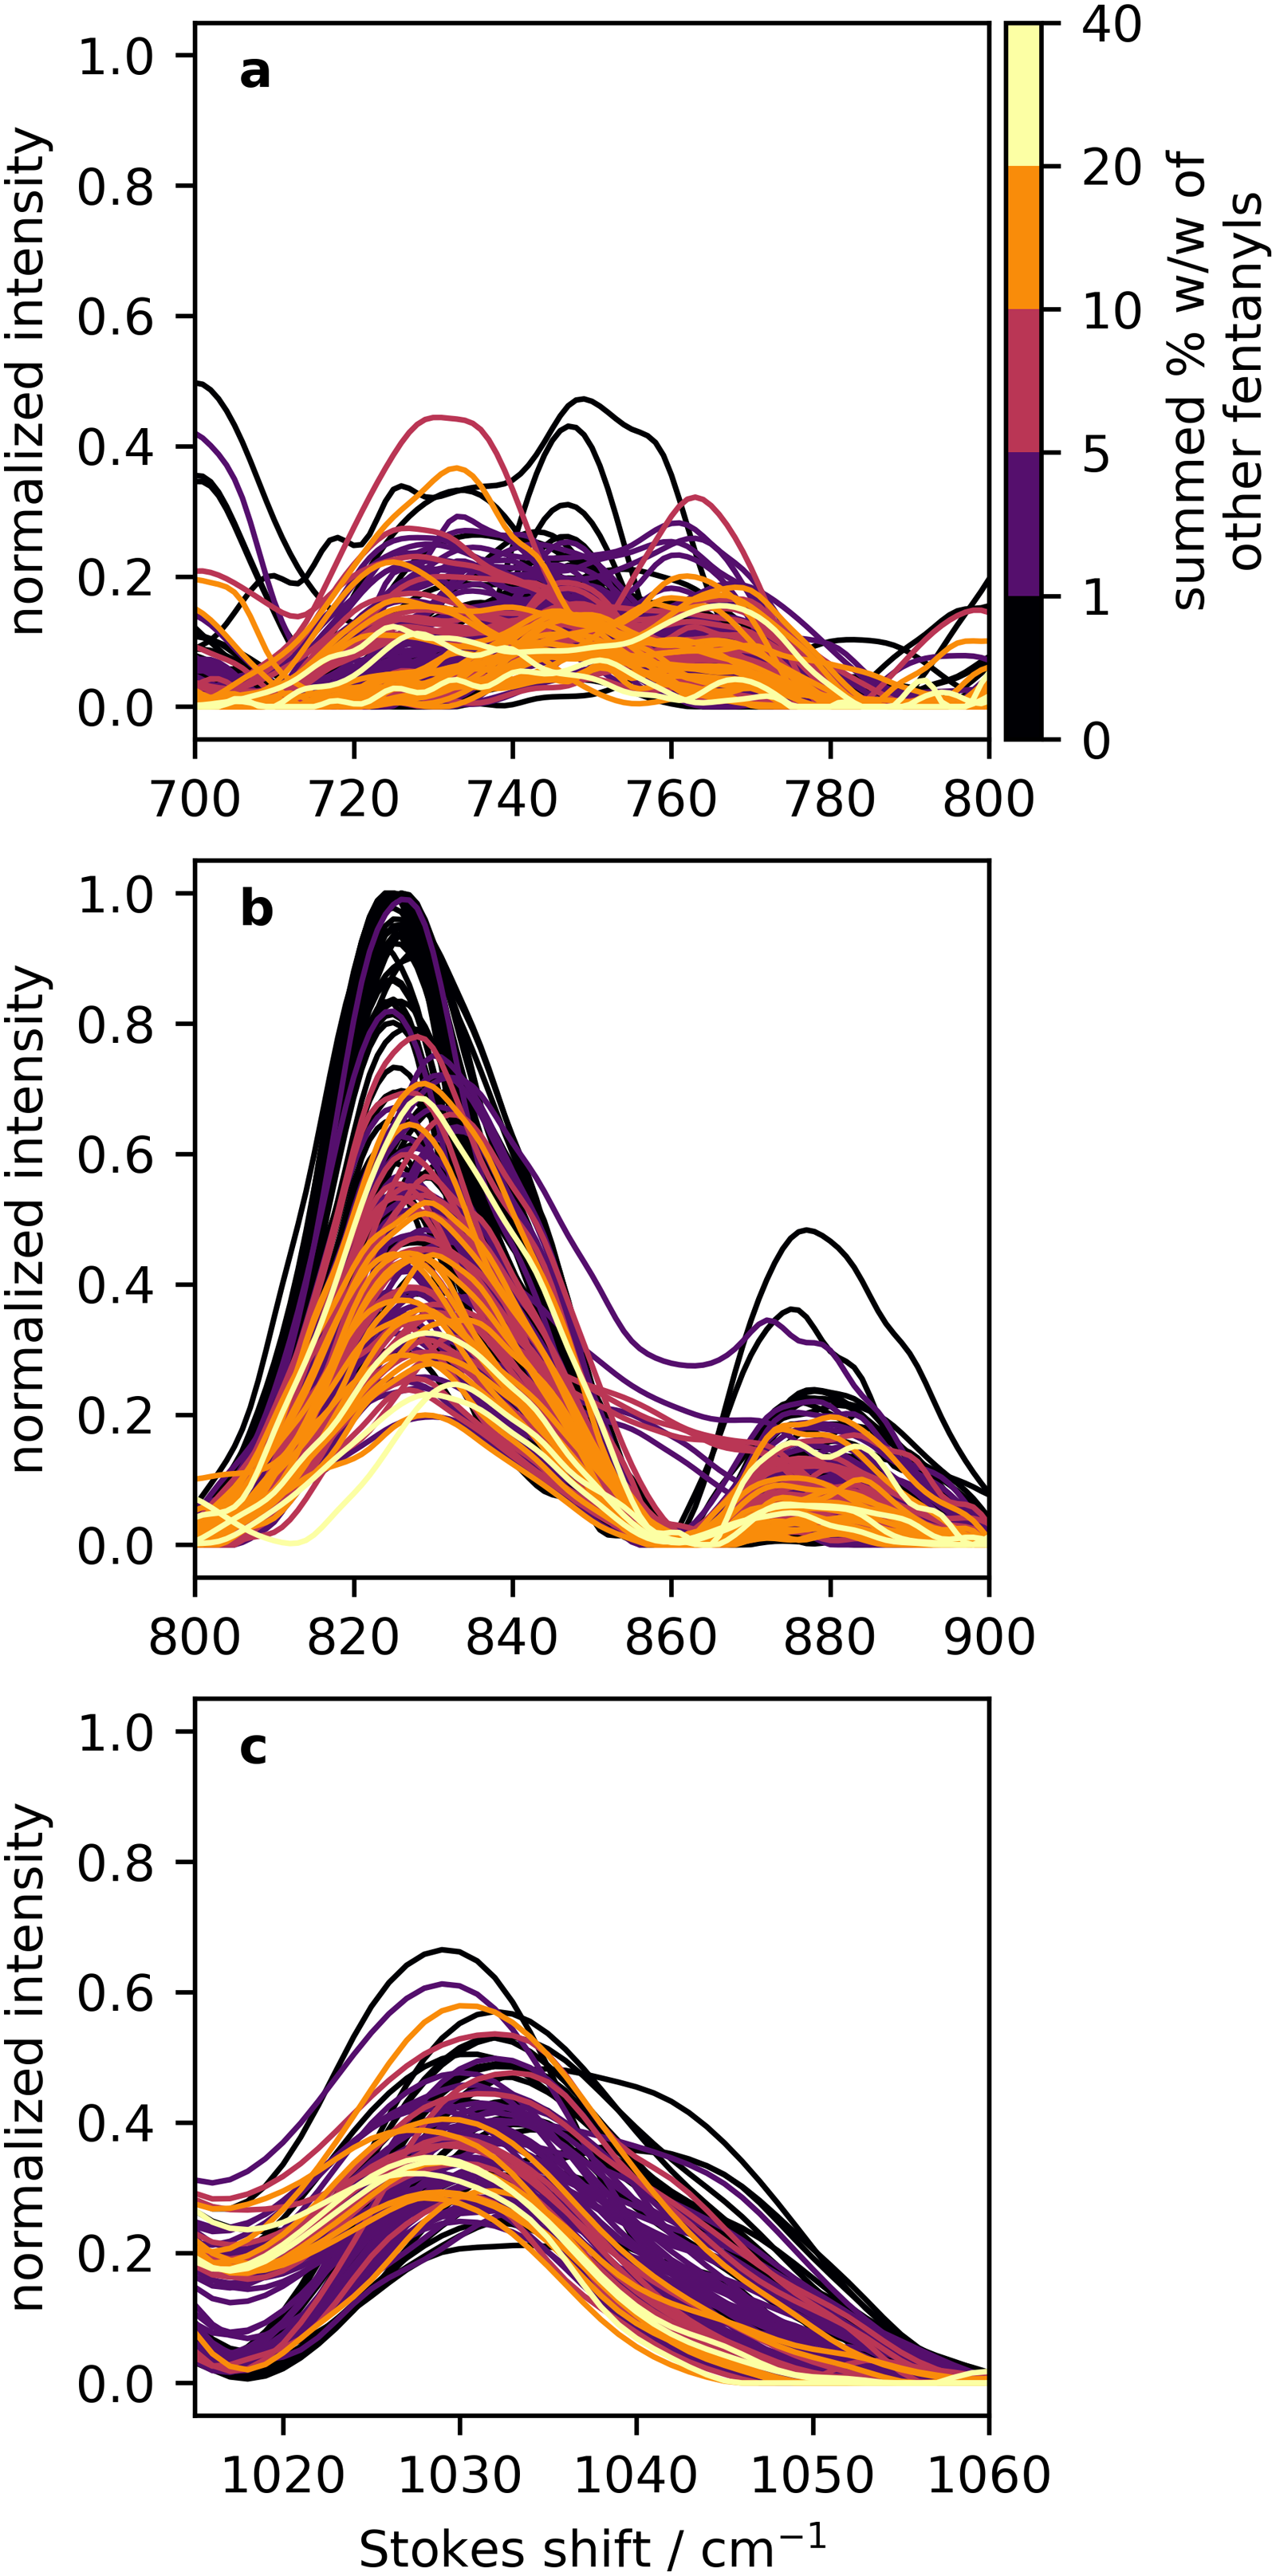
(a) SERS spectra of all samples with fentanyl with focus on its characteristic peak at 745 cm−1. Colours correspond to the summed w/w percentage of pFF and oMF in each sample. (b) SERS spectra of all samples with pFF with focus on its characteristic peak at 828 cm−1. Colours correspond to the summed w/w percentage of fentanyl and oMF in each sample. (c) SERS spectra of all samples with oMF with focus on its characteristic peak at 1033 cm−1. Colours correspond to the summed w/w percentage of fentanyl and pFF in each sample.
The accessibility of SERS, in terms of cost, portability, and ease-of-use, makes it a strong candidate to fill the gap in trace detection at drug checking sites that lack mass spectrometers.15,26–28 We have shown that SERS is a more sensitive technique than FT-IR, an instrument widely used across North America. 20 Together, FT-IR and SERS can determine the majority of components within an illicit opioid mixture: FT-IR can provide bulk component information, 16 and SERS can provide trace detection. SERS performs particularly well in detecting fentanyl, pFF, or oMF at trace levels when present alone, enhancing detection relative to FT-IR and providing differentiation of fentanyl analogues, an option not offered by fentanyl test strips. 22 Given the high potency of fentanyl and its analogues,7–9,11 these trace quantities remain relevant in point-of-care contexts. Furthermore, we demonstrated that SERS can detect fentanyl, pFF, and oMF in multi-fentanyl mixtures at similar concentrations, an important advantage because fentanyl and pFF are known to exert synergistic effects at equal concentration ratios. 10 Although SERS is less effective at identifying all fentanyls in multi-fentanyl mixtures with unequal concentration ratios, detecting the primary fentanyl analogue provides valuable information. Overall, a SERS–machine learning approach would enhance the current capabilities of drug checking sites that currently rely on FT-IR and test strips.
Conclusion
We analyzed expected-opioid samples from the local illicit drug supply using paper spray mass spectrometry and determined that fentanyl, pFF, and oMF can appear alone or in mixtures of each other, and are most often below 5% w/w. We achieved trace detection of fentanyl, pFF, and oMF in illicit opioid samples using three binary random forest classifiers trained on SERS spectral data. Overall, the SERS performance exceeded that of FT-IR. Characteristic spectral features allowed for effective detection in samples that contained only one of the molecules of interest. However, when the three targets were in the same sample, the performance of both the SERS-based model and the IR-based model declined. In multi-fentanyl mixtures, the characteristic spectral features of a target analyte disappeared if another fentanyl was present at a higher concentration than the target analyte. Without the characteristic features, the model could not consistently detect the compound of interest. This illustrates the capability of SERS for detecting and distinguishing fentanyl and fentanyl analogues at trace quantities when alone in the sample. This also highlights the need for SERS-machine learning research to differentiate fentanyl and analogues at different ratios in illicit opioid mixtures. Future work could include exploring machine learning approaches like data fusion and deep learning, and an investigation into the binding affinities of fentanyl and analogues.
Supplemental Material
sj-pdf-1-asp-10.1177_00037028261457152 - Supplemental material for Detection of Fentanyl Analogues in Illicit Drug Samples Using Surface-Enhanced Raman Spectroscopy and Random Forest Classification
Supplemental material, sj-pdf-1-asp-10.1177_00037028261457152 for Detection of Fentanyl Analogues in Illicit Drug Samples Using Surface-Enhanced Raman Spectroscopy and Random Forest Classification by Ella Newman, Rebecca R. Martens, Lea Gozdzialski, Bruce Wallace, Chris G. Gill and Dennis K. Hore in Applied Spectroscopy
Footnotes
Acknowledgements
We would like to thank people who use drug checking for providing the samples and perspectives essential for this project. We are also grateful for our colleagues at Substance who supplied the confirmatory testing results by collecting and analyzing mass spectra, FT-IR spectra, and immunoassay test strip data. Derek Robinson, Collin Kielty, and Josh Jai offered valuable advice around drug trend reporting, confirmatory testing results, and machine learning methods.
Declaration of Conflicting Interests
The author(s) declared no potential conflicts of interest with respect to the research, authorship, and/or publication of this article.
Funding
This project received funds from the Government of Canada’s New Frontiers Research Fund (NFRF, NFRFE-2022-00886), with additional support from the British Columbia Ministry of Health, Island Health Authority, and the Vancouver Foundation (F0120-5607). EN is grateful to NSERC for a CGS-M fellowship. High performance computing support and server resource allocation was provided by the University of Victoria, Westgrid, and the Digital Research Alliance of Canada.
Supplemental Material
All supplemental material mentioned in the text accompanies this paper online.
References
Supplementary Material
Please find the following supplemental material available below.
For Open Access articles published under a Creative Commons License, all supplemental material carries the same license as the article it is associated with.
For non-Open Access articles published, all supplemental material carries a non-exclusive license, and permission requests for re-use of supplemental material or any part of supplemental material shall be sent directly to the copyright owner as specified in the copyright notice associated with the article.