






Abstract
The manufacture of large complex aircraft structures made of advanced composites is done by heating the parts on complex, thermally massive tools using convective heating inside autoclaves. In recent years, numerical simulation of the process has shown great value, but lack of knowledge of the convective heat transfer boundary conditions remains a major obstacle to widespread adoption. An infrared thermography method is presented, suitable for evaluating the thermal response of these processing conditions. The method is based on increasing the emissivity of a tool surface with a painted vacuum bag before thermal imaging. Accurate readings with an average temperature difference of 1.1℃ compared to thermocouple data were achieved. The benefit of the thermography method is the highly detailed surface temperature map. Three tools with very similar geometries but made of Invar, aluminum and carbon fibre composite, respectively, were tested, and results interpreted using analytical solutions for the different tooling feature and convective boundary condition combinations. Analytical simulations, which were validated by comparison to numerical models, explain well the effect of autoclave airflow, tooling material and sub-structure variation on the temperature profiles measured by this infrared thermography method.
Background and introduction
Given the promise of lighter and more efficient designs, application of advanced composites across many industries has enjoyed tremendous growth in the past decade. The successful application of carbon-fiber composites in commercial jetliners such as the Boeing 787 has paved the road for other industries to follow. The transition to composites, however, has not been a smooth ride and cost over-runs and schedule production delays are not uncommon. Unlike their metallic counterparts, for composites, the end quality is highly intertwined with the fabrication process. In recent years, to reduce risk, increasing emphasis has been placed on numerical simulation of these fabrication processes rather than relying on know-how, empirical knowledge, and trial-and-error exercises. 1 Process simulation of thermal management problems has been shown to be highly useful when dealing with composites fabrication.2,3 However, lack of knowledge of the boundary conditions including heat transfer coefficients (HTCs) remains a major obstacle to widespread adoption.
During the cure stage, a thermoset matrix composite part typically starts as a collated stack of raw, compliant material and develops into a rigid structure capable of sustaining loads. A well-controlled thermal cycle is a key requirement for successful processing. Numerous studies have shown that loss of control of process parameters results in a cascading list of part quality concerns, including: under-cure or over-cure (including possible thermal degradation due to exotherm), porosity, wrinkle growth, and excessive residual stress leading to the development of micro-cracks and/or dimensional changes.1–9
In convective heating processes, the operator has control over the air temperature in hopes that the part temperature follows through. However, due to thermal resistances of the system, part temperature lags behind the air temperature. In practice, material vendors recommend a cure cycle for their materials (commonly referred to as the Manufacturers Recommended Cure Cycle (MRCC)) with little guidance as to the limitations of applicability. It is well known in industrial circles that these MRCCs are merely the starting point for an acceptable cure cycle. As the laminate becomes thicker, tooling more complex, and equipment larger, the importance of a systems-based thermal design approach becomes increasingly more important. These cure cycles have to be designed not just around the material but around the entire curing system. A wide body of literature studying various components of the curing system now exists (e.g. see literature10–15). This paper discusses the response of tooling and curing equipment.
The cure tooling, by mass, is greater than that of the actual composite part, and this ratio increases rapidly with increasing part size. Consequently, the tool will have a strong influence on the thermal response of the material in most parts of industrial significance. Given this consideration, tooling material selection and geometry design become important factors in the thermal management of the part.
The curing equipment is often in the form of a gas (typically nitrogen) pressurized autoclave or unpressurized oven; in either case, these systems rely on convective heat transfer. This form of heat transfer is characterized by the HTC which is correlated to the local flow velocity over a tool. For constant flow velocity conditions and simple geometries, the HTC can be analyzed with respect to the gas properties and velocity (e.g. see Bergman et al. 16 ). This, however, has limited applicability since most industrial cases have complex geometries and flows and it is non-trivial to determine HTC values.
HTC values in autoclaves and ovens are often characterized using lumped mass calorimeters. For example, Ghariban et al. 17 measured highly turbulent flows within an autoclave environment using a copper plate calorimeter to measure variations in HTC along the length of an autoclave. Johnston et al. 18 developed a model to account for HTC increases with curing pressure and Hudek et al. 19 extended this model to include variation along the length of the curing equipment. Recent work from Weber et al. 20 includes the effects of inter and intra-part shadowing effects observed in batch loading conditions. Maffezzoli and Grieco 21 among others, demonstrate that how knowledge of the heating relationship between a tool and equipment can result in operational efficiencies through cure time reduction using the simulation tools. All of these studies used instrumented thermocouples or calorimeters to assess temperature and HTCs.
These methods give high-resolution data for a spatially fixed location but do not give much information regarding temperature and HTC variation across the curing vessel. It can be said that these types of measurements are 0D measurements offering a point or locally averaged assessment of the temperature or HTC. 22 IR thermography provides an alternative approach for the evaluation of a curing system. Although this method has been used extensively in various applications (e.g. see Carlomagno and Cardone 22 and Goidescu et al. 23 ), only a few attempts have been made to implement this method for evaluating composites curing systems. For example, infrared imaging was recently utilized in various autoclave operations.24–26 In these studies, an infrared camera installed inside an autoclave monitored temperature variations. In another study, flow front progression in resin infusion using IR imaging was investigated. 27
IR thermography of composites curing processes is affected by the radiation from the surroundings of the part, including reflected radiation from the curing equipment. This requires implementation of proper calibration procedures to improve accuracy of the readings (e.g. see Ucan et al. 27 ). However, even with proper calibration, the high reflectivity of metallic tools (e.g. aluminum or Invar) limits the application of IR thermography to monitor a curing system.
To address this issue, a method has been developed and proposed in this paper. Combined with a proper calibration procedure, temperature measurement with high accuracy was achieved. In this method, the surface of the tool is covered with a vacuum bag painted black to increase the emissivity of the tool surface. This method is used to analyze the thermal response of three tools with similar geometries but with different tooling materials (Invar, aluminum and composite). Using these results combined with analytical and numerical solutions, several parameters were identified as influencing the thermal response: autoclave airflow variation, tooling material and tooling sub-structure. The proposed method provides a continuous representation of temperature on a tool and can be potentially used to evaluate the composite curing systems.
Thermal behaviour of a curing system
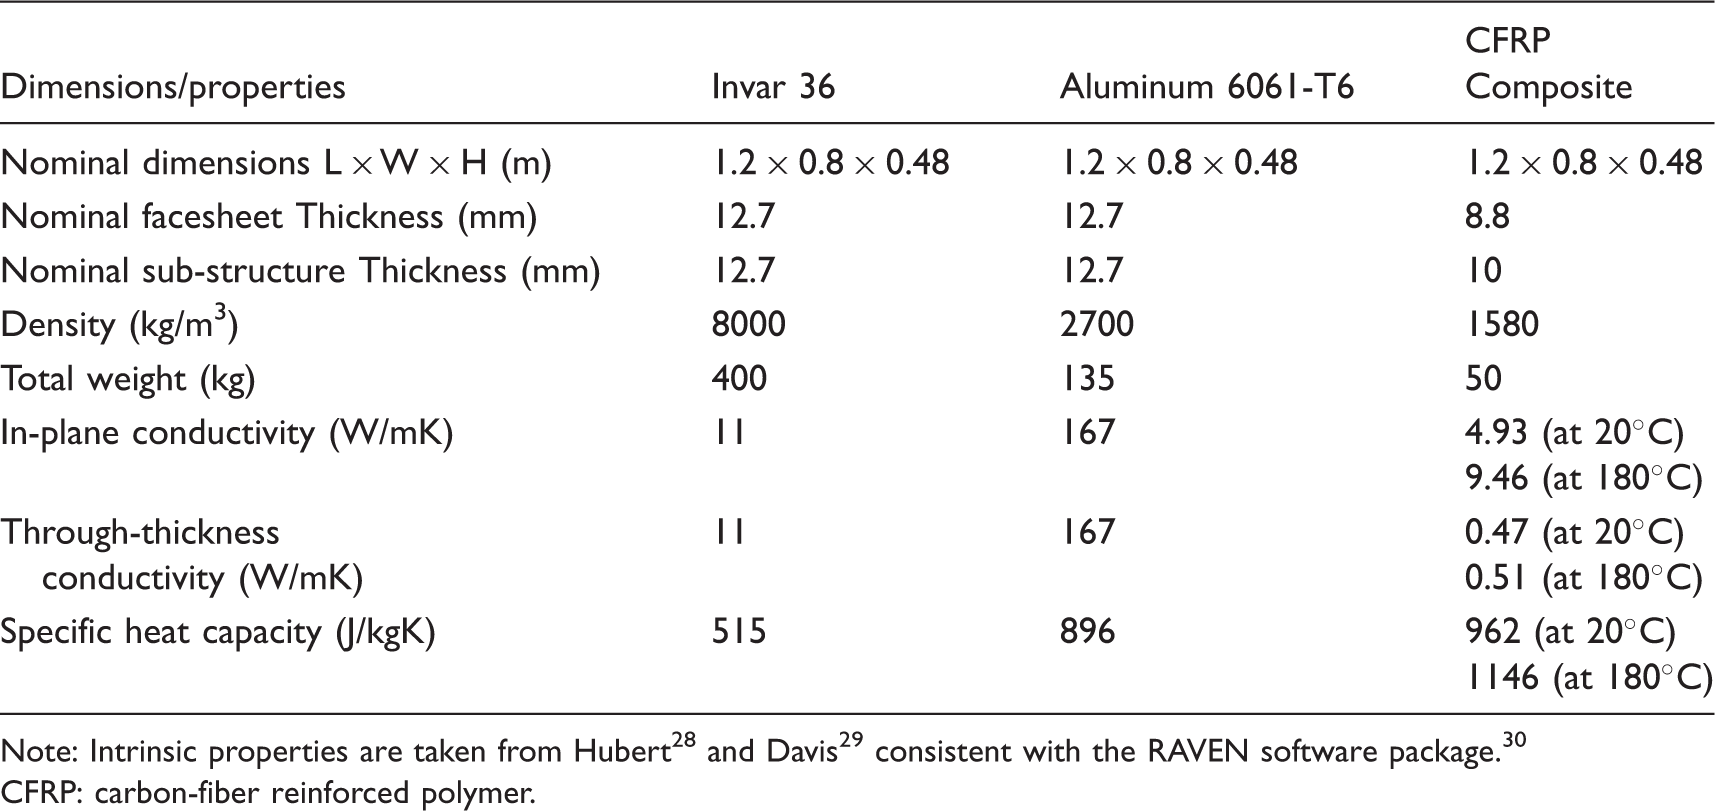
This study considers three tools of nominally identical surface geometry. Each tool is constructed with a different material: Carbon fiber-reinforced polymer composite (CFRP), aluminum 6061-T6, and Invar 36. These materials are representative of conventional tooling systems in composites processing. The nominal dimensions of these tools are 0.8 m wide × 1.2 m long × 0.48 m high. The metallic tools are constructed with nominal 12.7 mm thickness plate (facesheet and sub-structure) and the CFRP tool is constructed to a nominal 8.8 mm facesheet thickness and nominal 10 mm sub-structure thickness with localized thickness increases for the assembly and dimensional verification purposes. The three tools considered in this study are shown in Figure 1. Several properties of the tool are presented in Table 1. Thermal properties are assumed to be nominal material properties and representative of these tooling systems.
Three tools with similar geometries of 1.2 m × 0.8 m × 0.48 m but with different tooling materials of Invar 36 (a), Aluminum 6061-T6 (b) and CFRP composite (c). Material properties for the three tools used in this study. Note: Intrinsic properties are taken from Hubert
28
and Davis
29
consistent with the RAVEN software package.
30
CFRP: carbon-fiber reinforced polymer.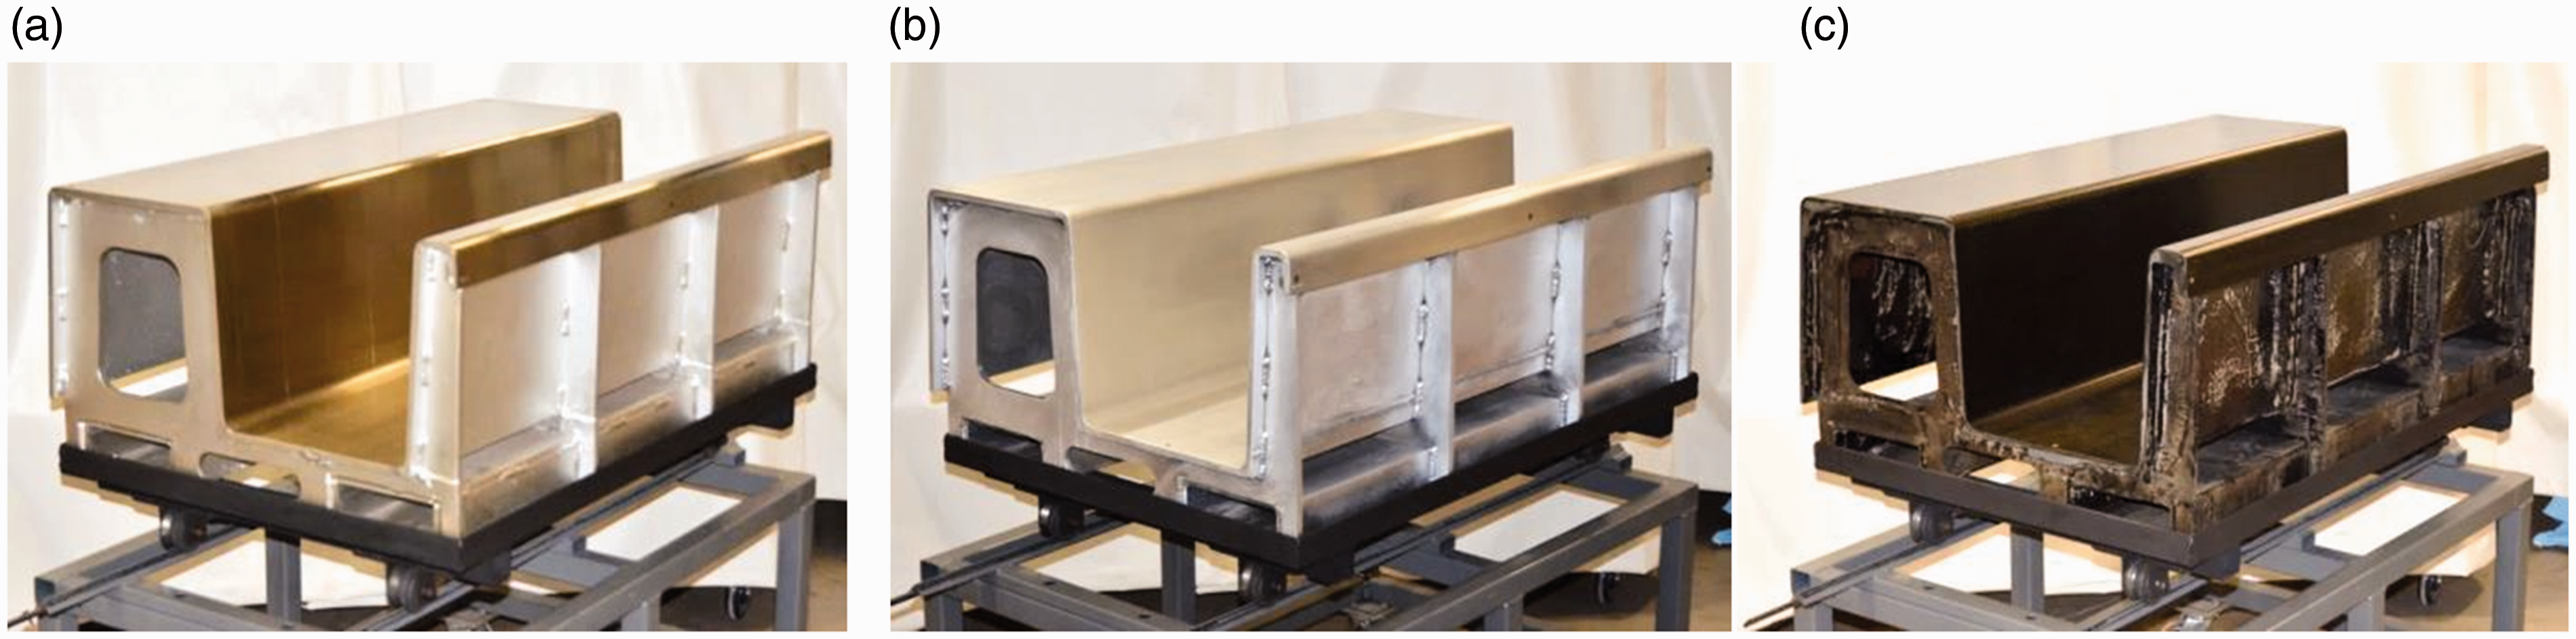
The vessel used for this study is a 1.15 m diameter ×1.5 m length autoclave produced by the American Autoclave Company. The autoclave is PLC controlled and interfaced via programmable cure recipes using vendor provided computer software. Heating and cooling are supplied by a 40 kW resistive heating system and cooled using facility supplied water. Air circulation is fan driven by a 30 kW induction motor from the rear of the autoclave and floor ducted to the front of the vessel before entering the operating envelope of the autoclave. Autoclave airflow characterization was previously performed by Slesinger et al. 31 Maximum flow velocity is observed at the top of the vessel and decreases toward the bottom of the autoclave. Within 0.5 m of the door, the flow stagnates and toward the bottom of the vessel, the flow is observed to reverse in direction.
IR thermography method
Theory
In infrared thermography, the total radiation received by the sensor,
This equation can be expanded as follows
Method
Each tool was initially cleaned using isopropyl alcohol. Once cleaned, 15 thermocouples were attached on the tool surface using heat-resistant tape at equal intervals. Locations of thermocouples are schematically depicted in Figure 2. Once the thermocouples were attached, the tool surface was covered with a layer of nylon peel ply (Airtech Bleeder Lease B). A nylon vacuum bag (Stretch-VAC 2000) with a vacuum port was then placed and sealed on the tool surface using the sealant tape. After applying vacuum, the vacuum bag was spray painted using a black matte paint (KRYLON 44290). An image of a tool prepared using the described process is also shown in Figure 3.
Schematic of locations of 15 thermocouples on the tool surface: (a) Tool isometric view and (b) tool flatten top view. A tool covered with a painted vacuum bag before loading into the autoclave.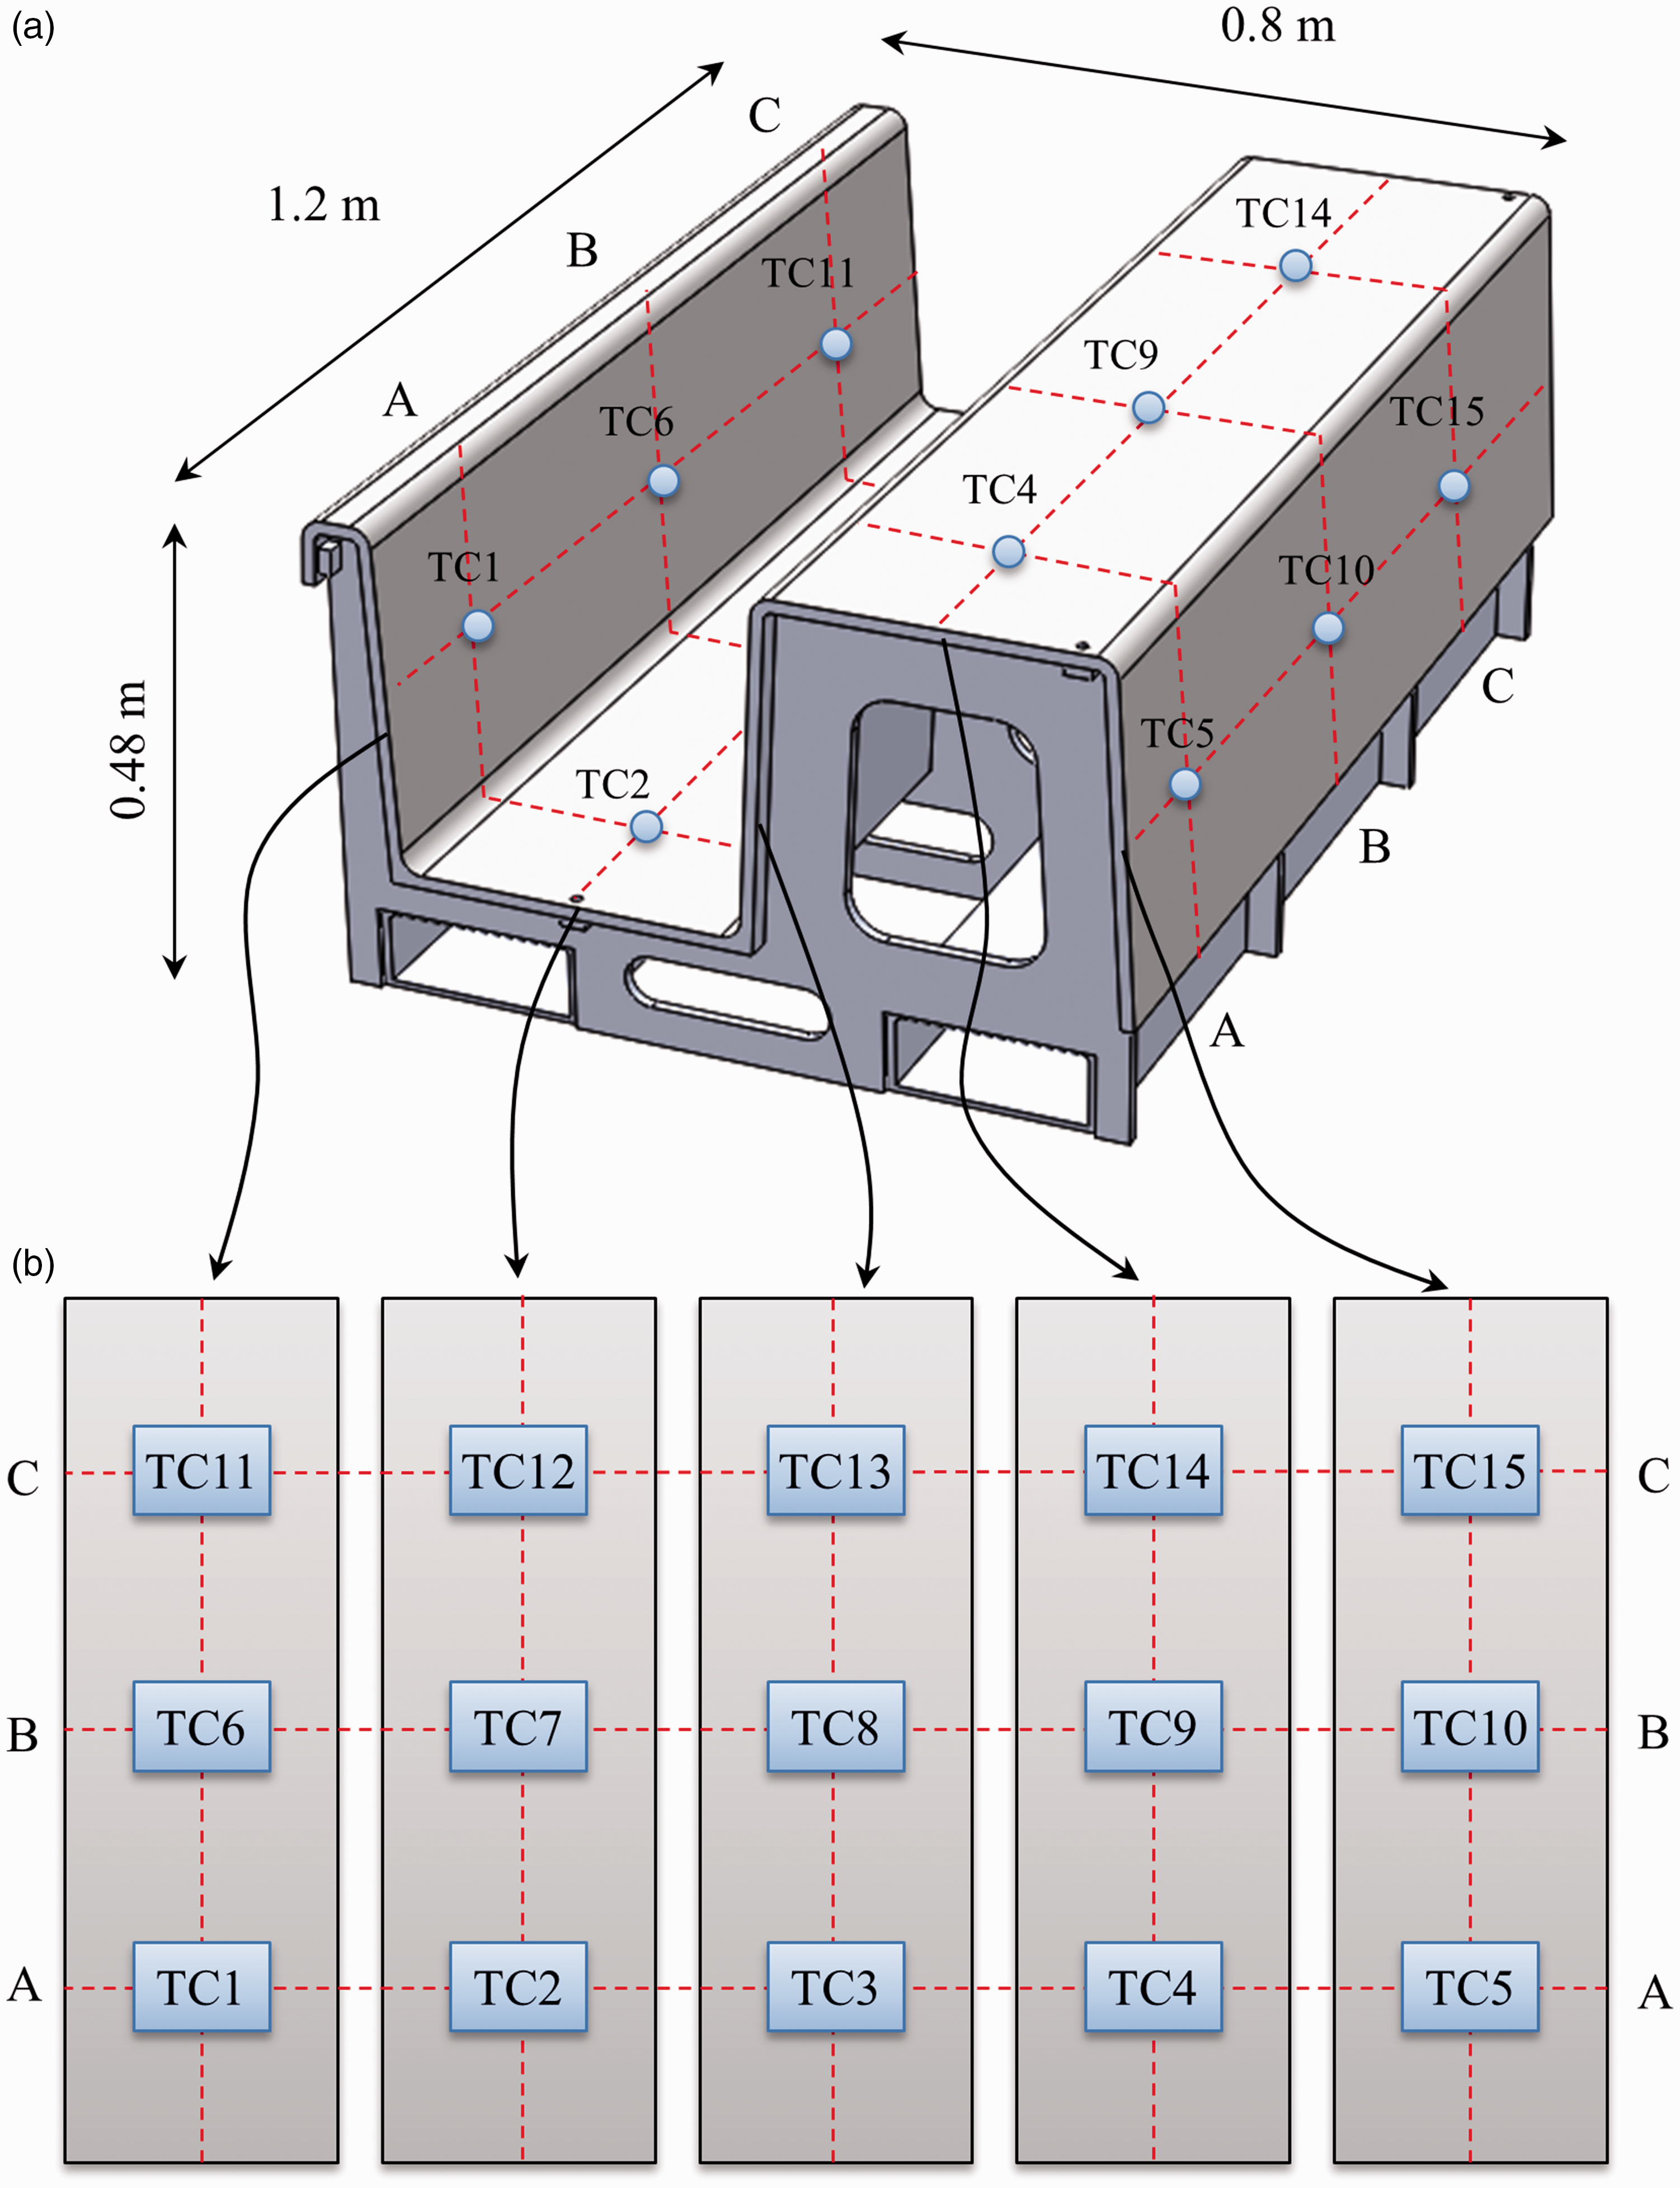
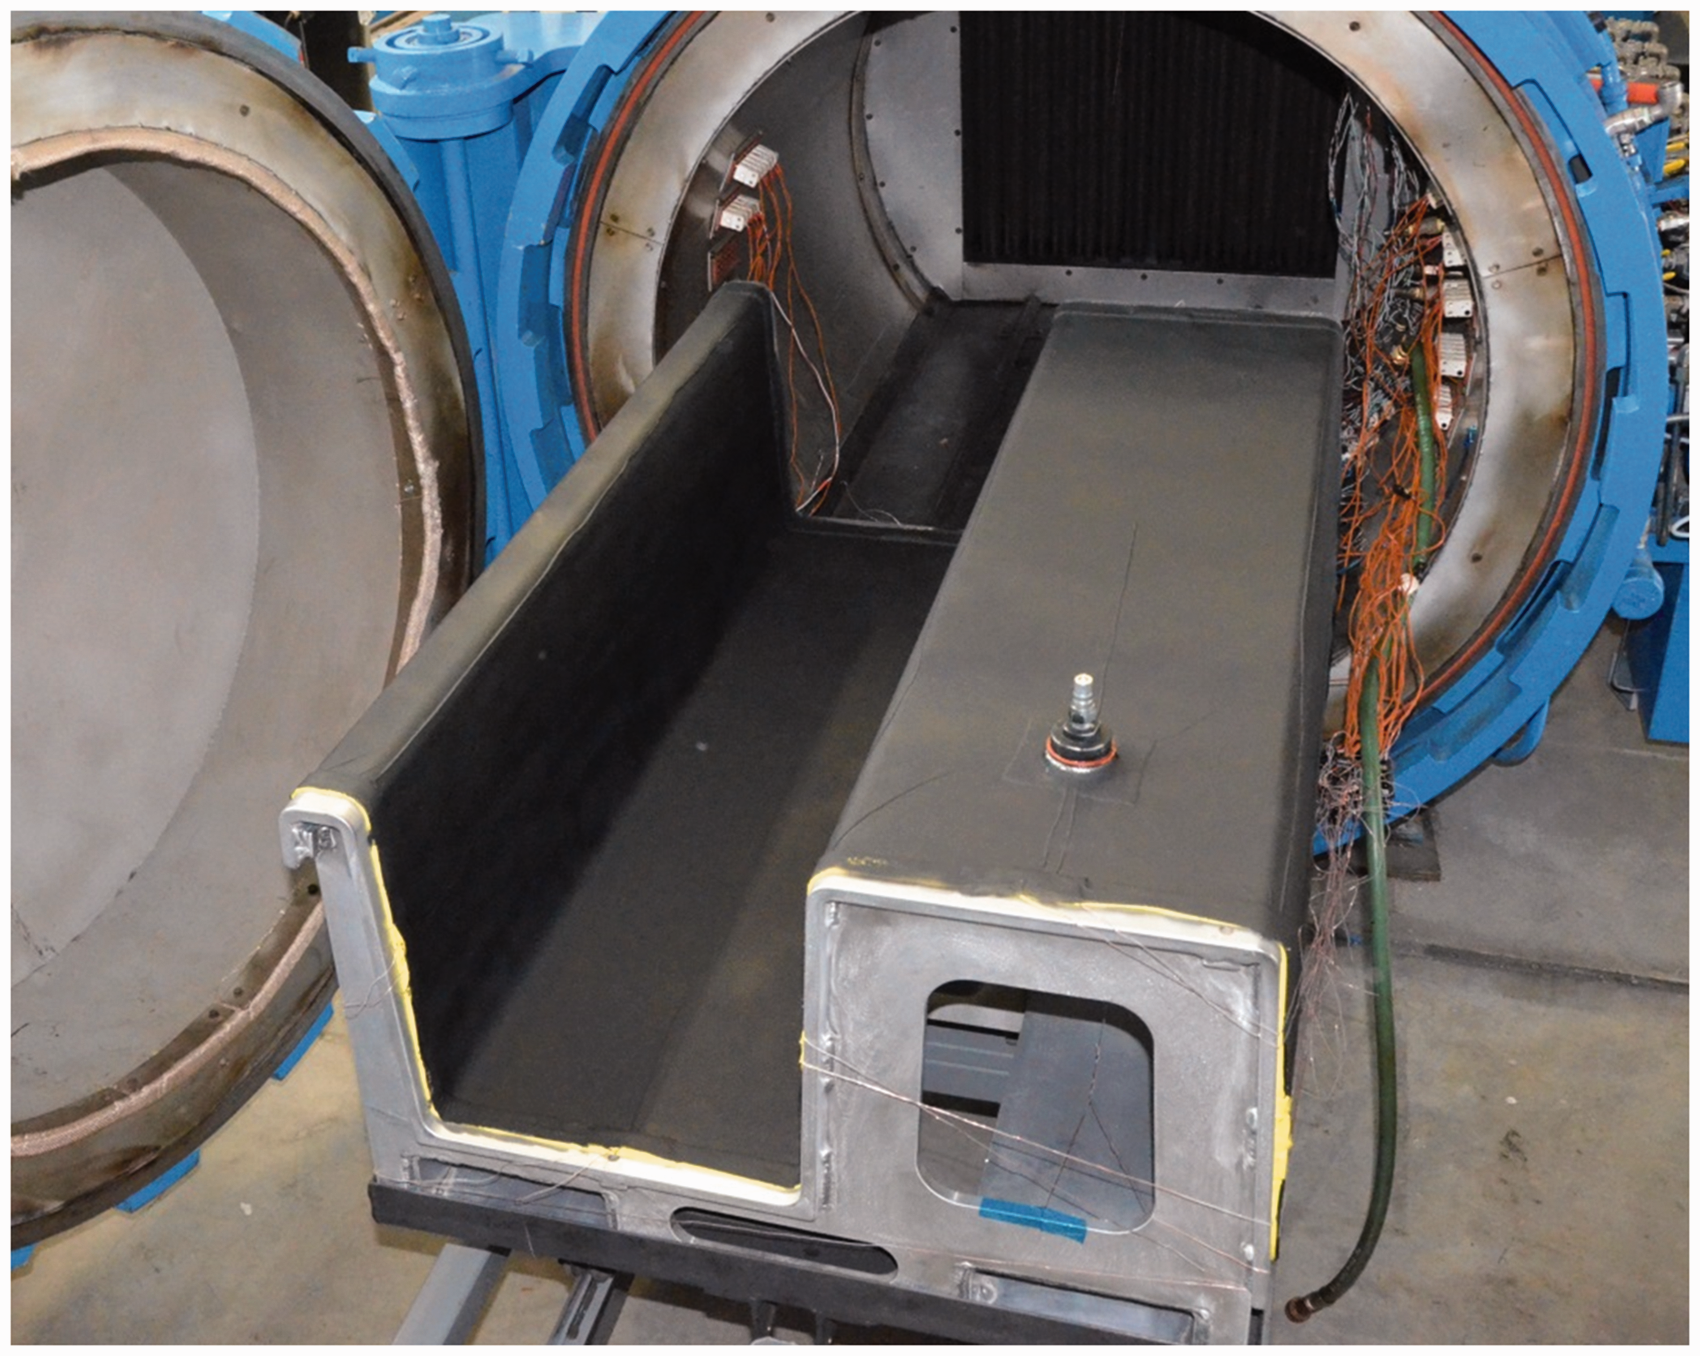
The prepared tools were heated in the autoclave at atmospheric pressure. For each test, the autoclave temperature was increased from room temperature to 100℃ at a constant heating rate of 5℃/min. After reaching 100℃, the autoclave was turned off, the tool was quickly rolled out and the autoclave opening was covered with cardboard before imaging. This was done to minimize radiation from the vessel. Additional tests were also conducted with different dwell times at 100℃. IR images were taken using an FLIR T620 IR Camera with a 13.1 mm wide lens. The total time from turning off the autoclave to taking images was kept around 1 min to minimize the heat loss. During the entire process including heat-up cycle, tool removal and IR thermography, the tool surface temperature was monitored using the thermocouples for verification and collection of the transient temperature history.
Calibration process
In order to accurately measure the temperature of the tool surface (
Calibration parameters for IR thermography.

IR: infrared.
Experimental results
An IR image taken from the surface of the Invar tool after the heat-up cycle is shown in Figure 4. Thermal variation is observed due to two conditions: autoclave airflow variation and tooling sub-structure. The effect of tooling sub-structure is observed directly over, and near, sub-structure attachment locations creating localized cold spots with a minimum temperature of 40.6℃. High airflow conditions can be observed toward the rear of the tool as a result of the previously reported airflow pattern in this autoclave creating a hot spot with a maximum temperature of 57.5℃, while low airflow creates a cold spot with a minimum temperature of 43.6℃ toward the front of the autoclave.
IR image of the Invar tool surface immediately after a heating cycle of 5℃/min to 100℃. IR: infrared.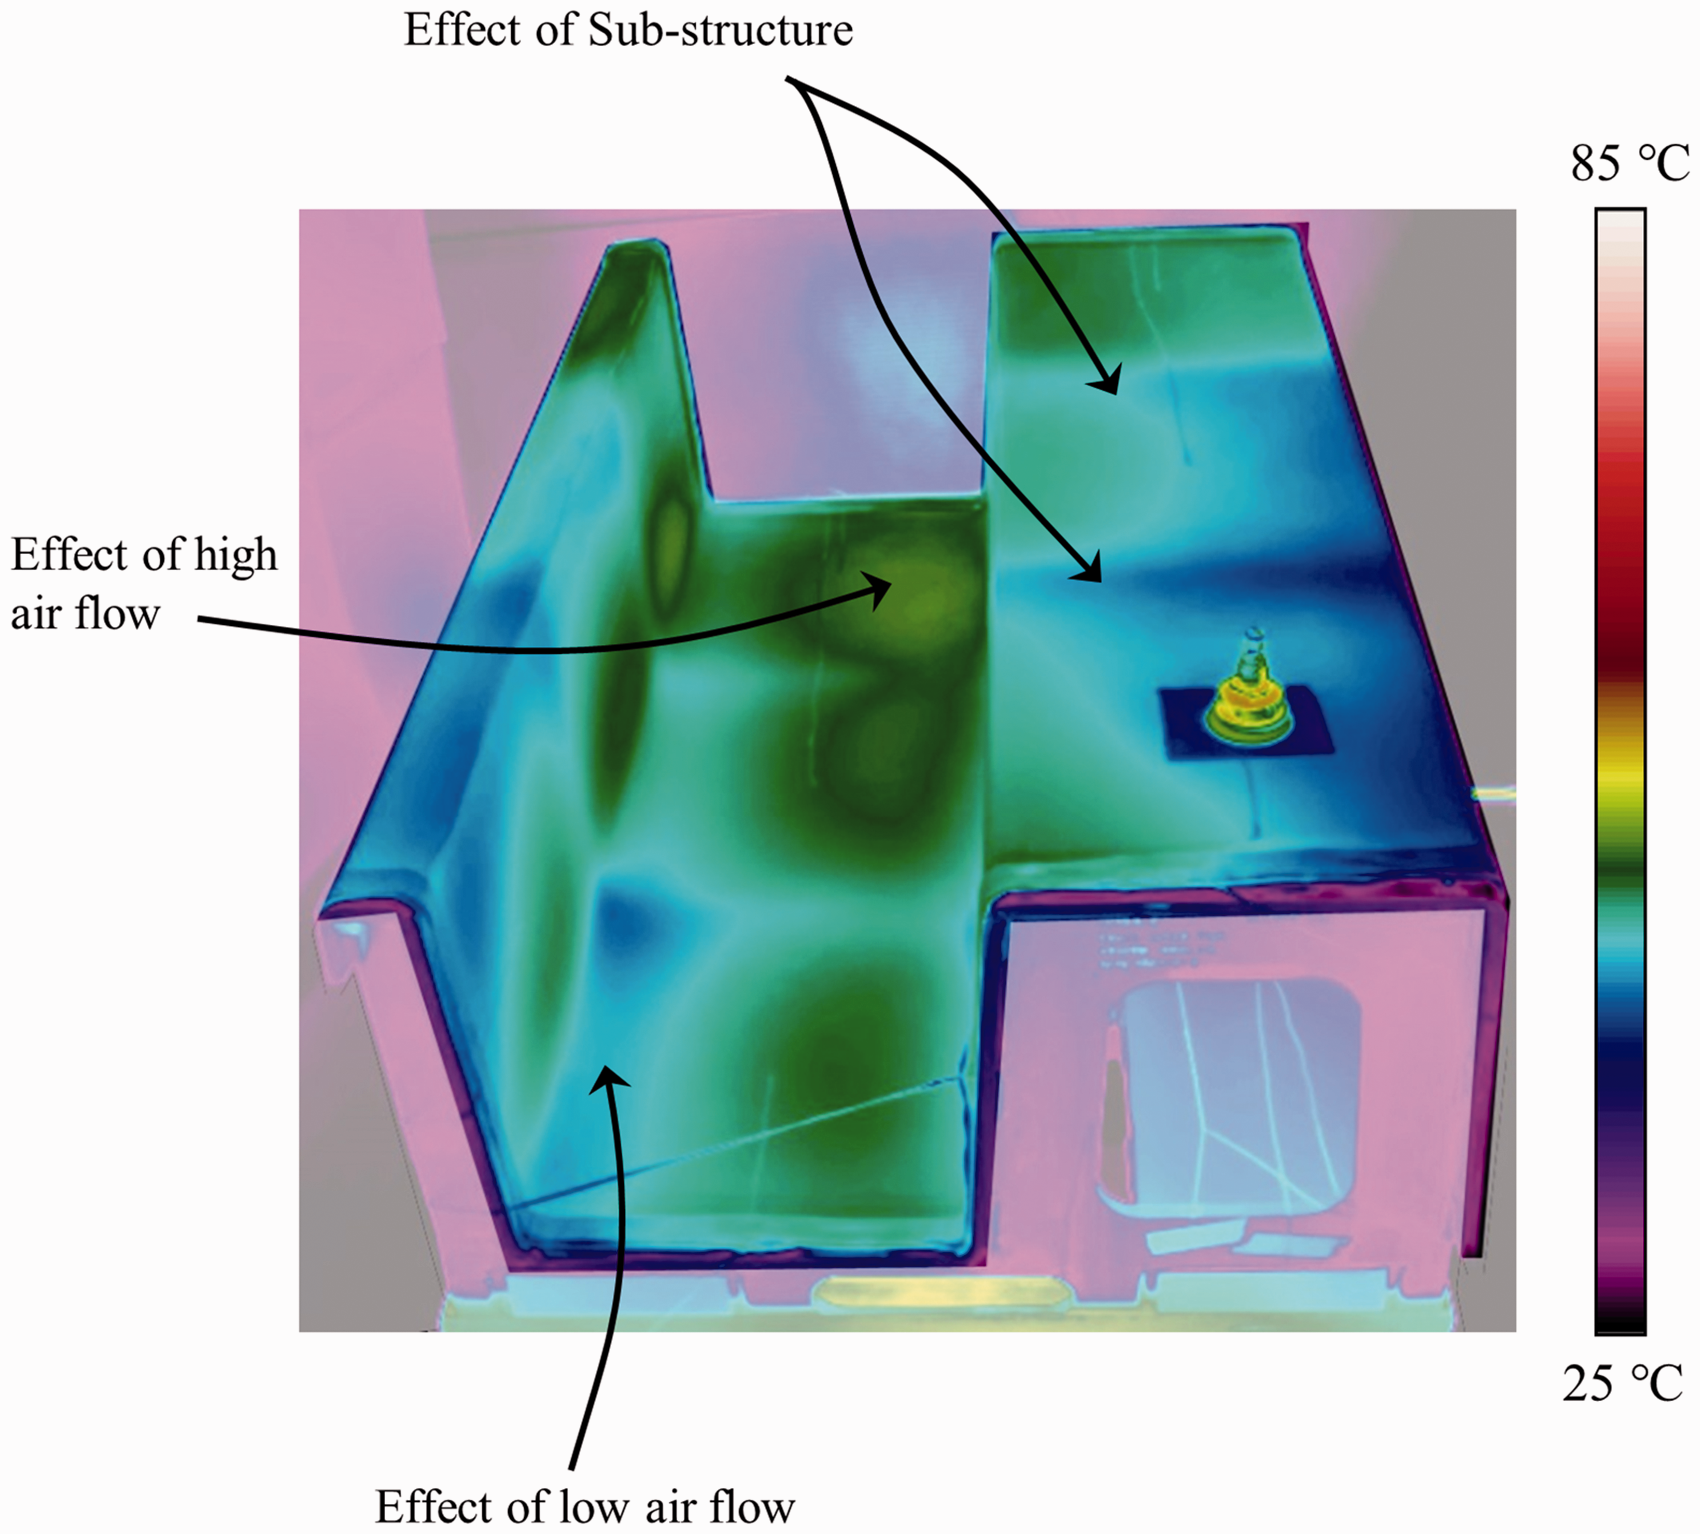
Comparative IR images taken from the surfaces of the three tools are presented in Figure 5. The Invar tool is the coldest tool with a maximum temperature of 57.5℃ (i.e. highest thermal lag) and the composite tool is the hottest tool with a maximum temperature of 78.0℃ (i.e. lowest thermal lag). The aluminum tool exhibits the least temperature gradient with no visible effect of the sub-structure. Maximum and minimum surface temperatures for each tool are listed under Table 3.
IR images of the surfaces of three tools immediately after a heating cycle of 5℃/min to 100℃: (a) Invar tool, (b) Aluminum tool and (c) CFRP tool. IR: infrared; CFRP: carbon fiber-reinforced polymer. . Comparison of the maximum and minimum surface temperatures for the three tools measured using the IR thermography method. Note: Tools were heated to 100℃ with a heating rate of 5℃/min. IR: infrared; CFRP: carbon fiber-reinforced polymer.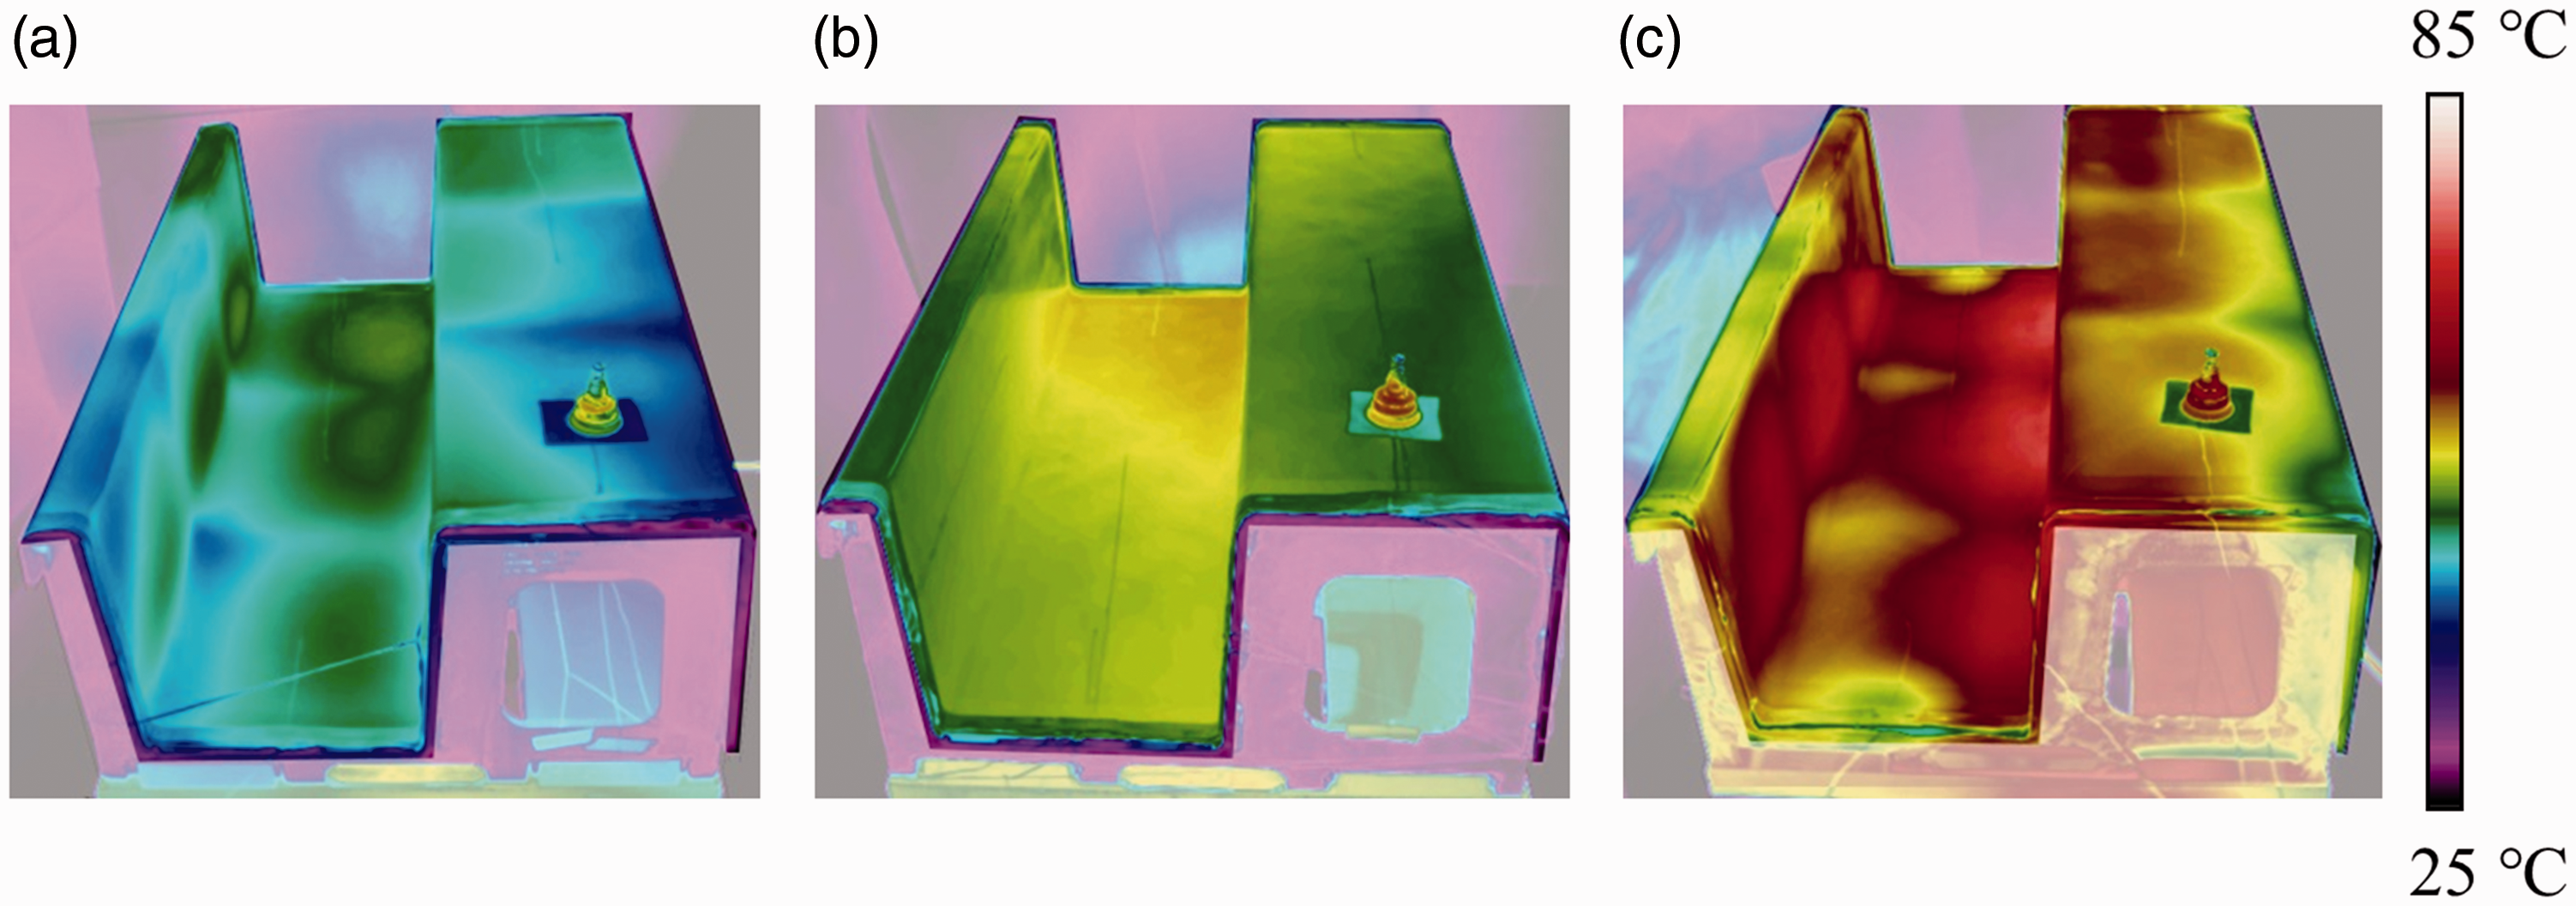

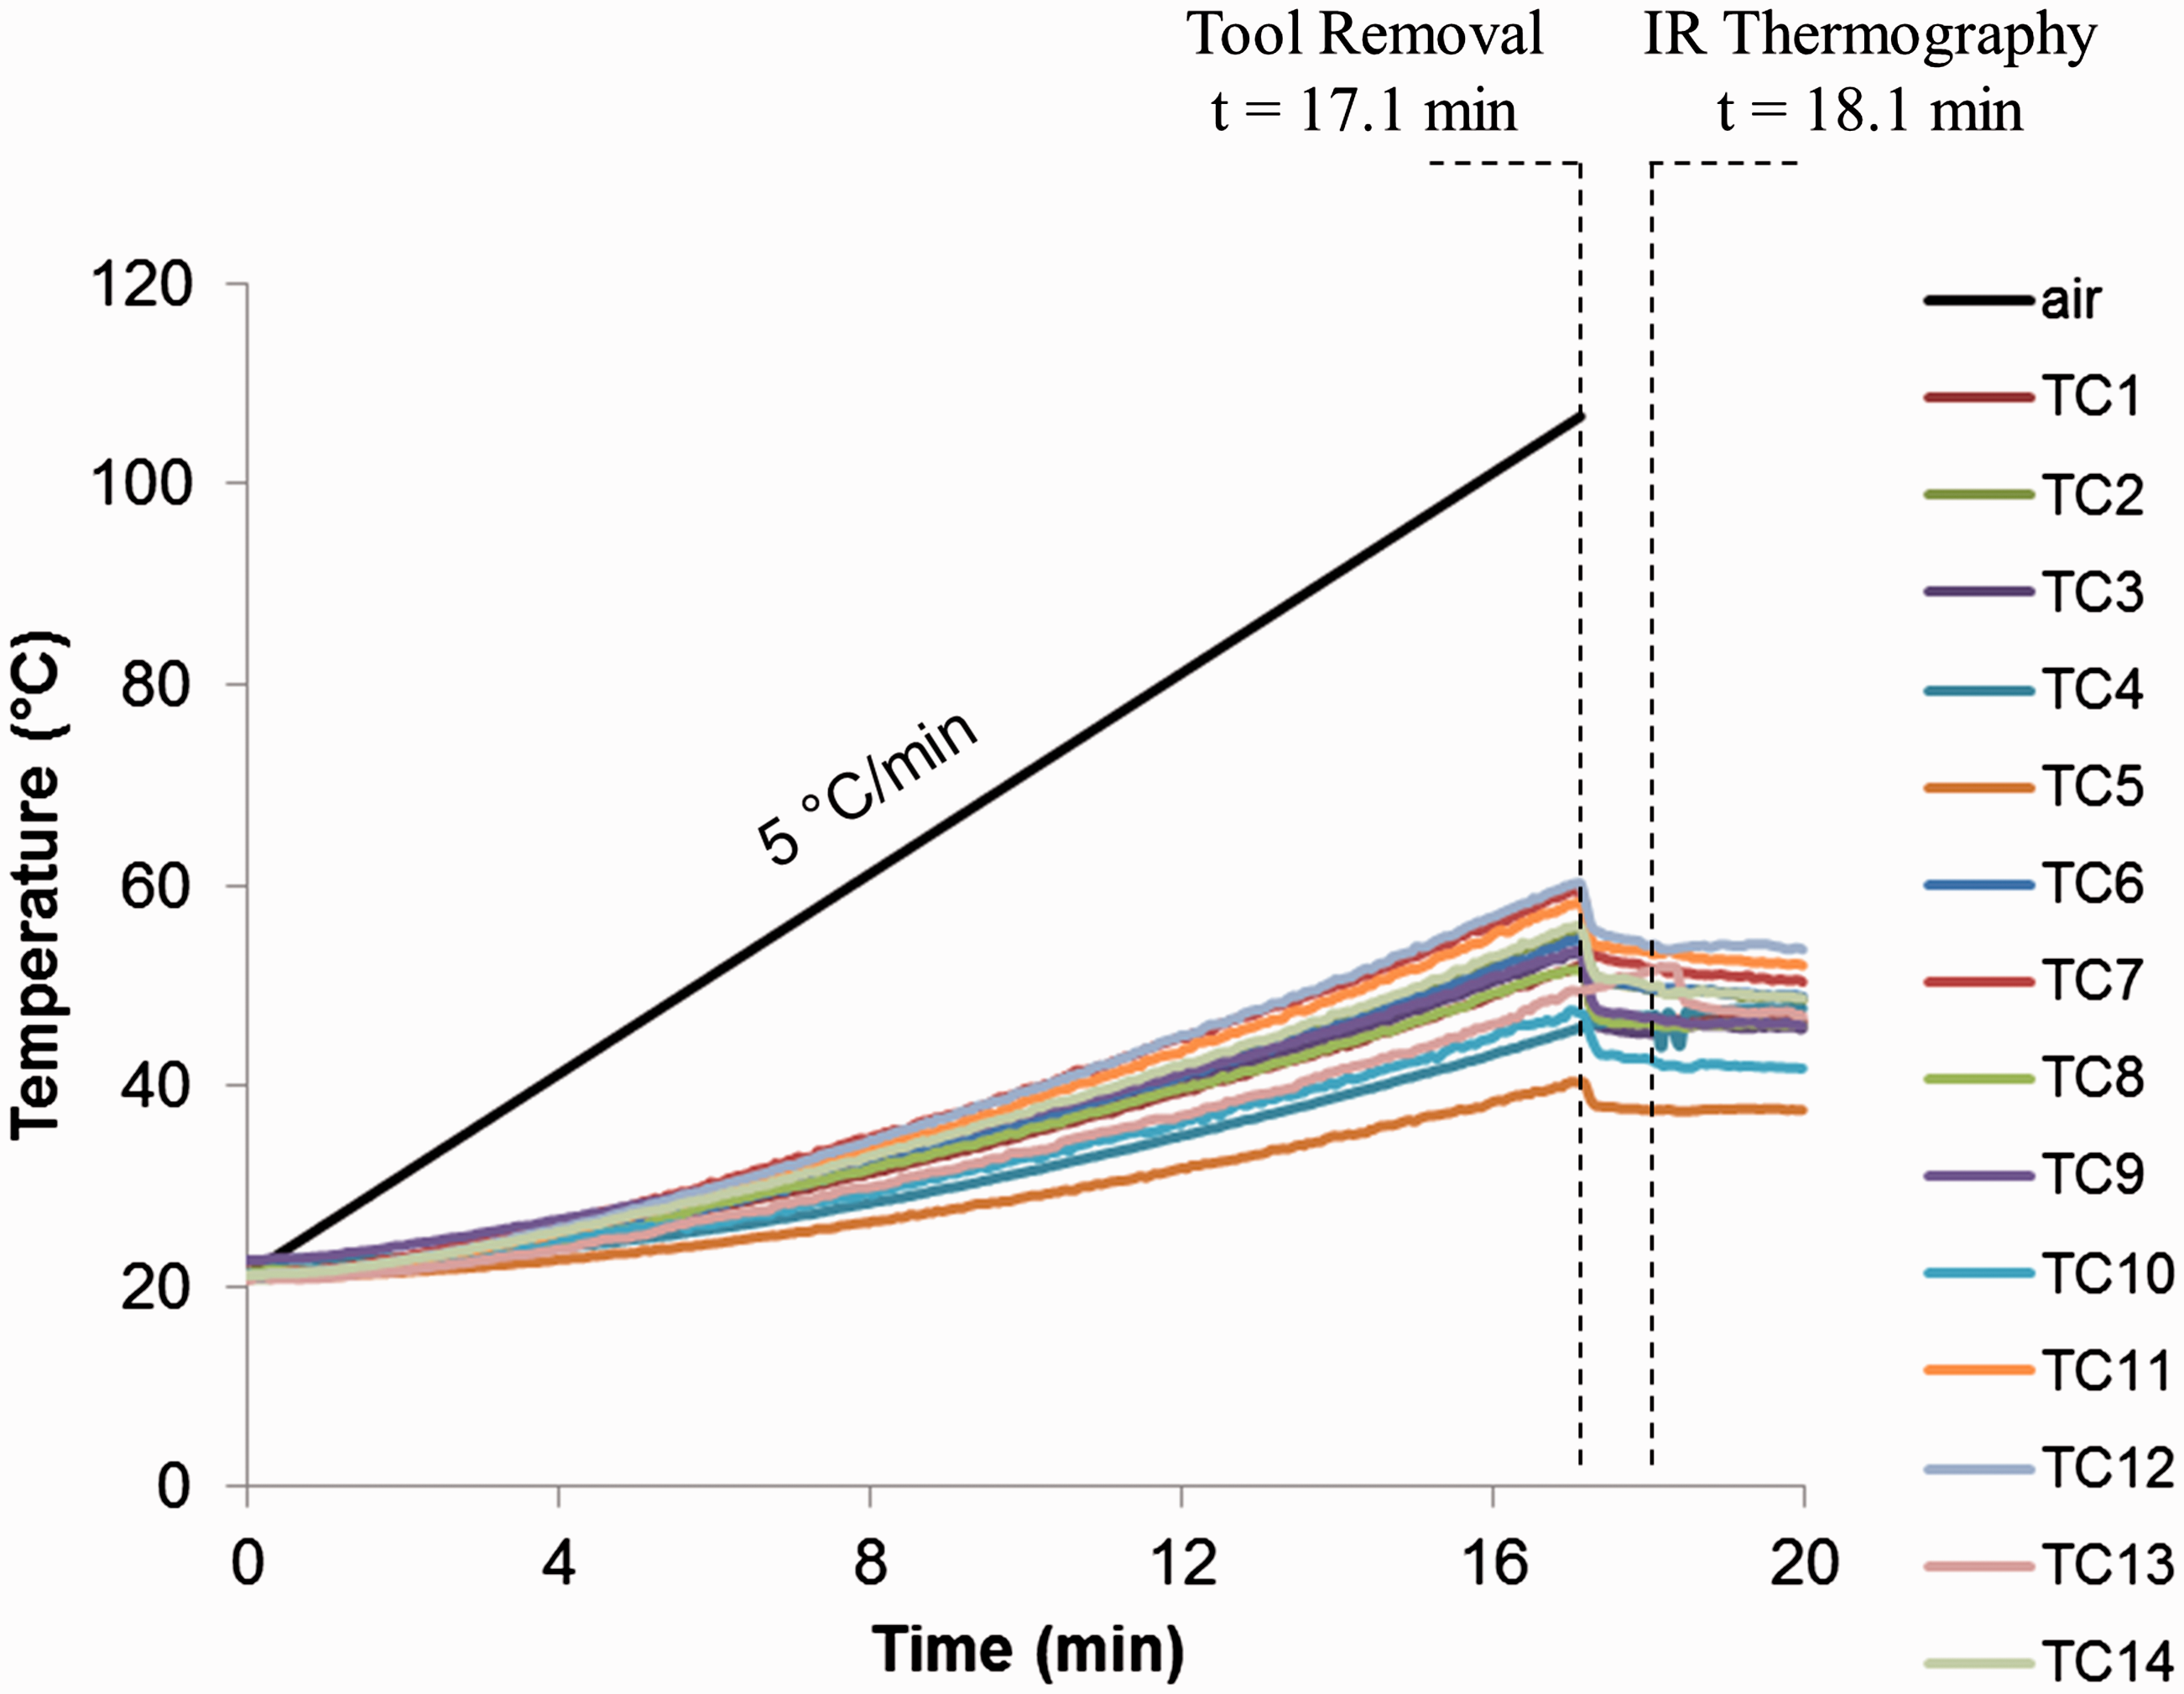
The thermocouple readings from each tool are compared in Figure 6. Detailed thermocouple measurements for the Invar tool are shown in Figure 7. The time of the tool removal from the autoclave and IR thermography is marked. Analysis of TC data in Figure 7 shows a uniform cool-down once the tool is removed from the autoclave. At the time of IR thermography of the Invar tool about 1 min after tool removal, TC measurements show an average cool-down of 6.2℃ with a standard deviation of 0.9℃. Similar uniform trends were observed for the composite and aluminum tools. This implies that the temperature gradients observed using IR thermography is a representation of the gradients on the tool surface inside the autoclave. The comparison of readings in Figure 6 confirms that the composite tool is the hottest tool and the Invar tool is the coldest tool. IR thermography results were compared with the thermocouple readings and the average and maximum differences between two measurements are listed under Table 4. This shows an average difference of 1.1℃ and a maximum difference of 3.3℃. It should be noted that the special limits of error (SLE) of type J thermocouples used in this study is ±1.1℃.
Comparison of the thermal envelope of tool surfaces from the thermocouple data for three tools subjected to a heating rate of 5℃/min. Thermocouple readings from the surface of the Invar tool subjected to a heating cycle of 5℃/min to 100℃. Average and maximum differences between the IR thermography results and thermocouple readings for the three tools. Note: Tools were heated to 100℃ with a heating rate of 5℃/min. IR: infrared; CFRP: carbon fiber-reinforced polymer.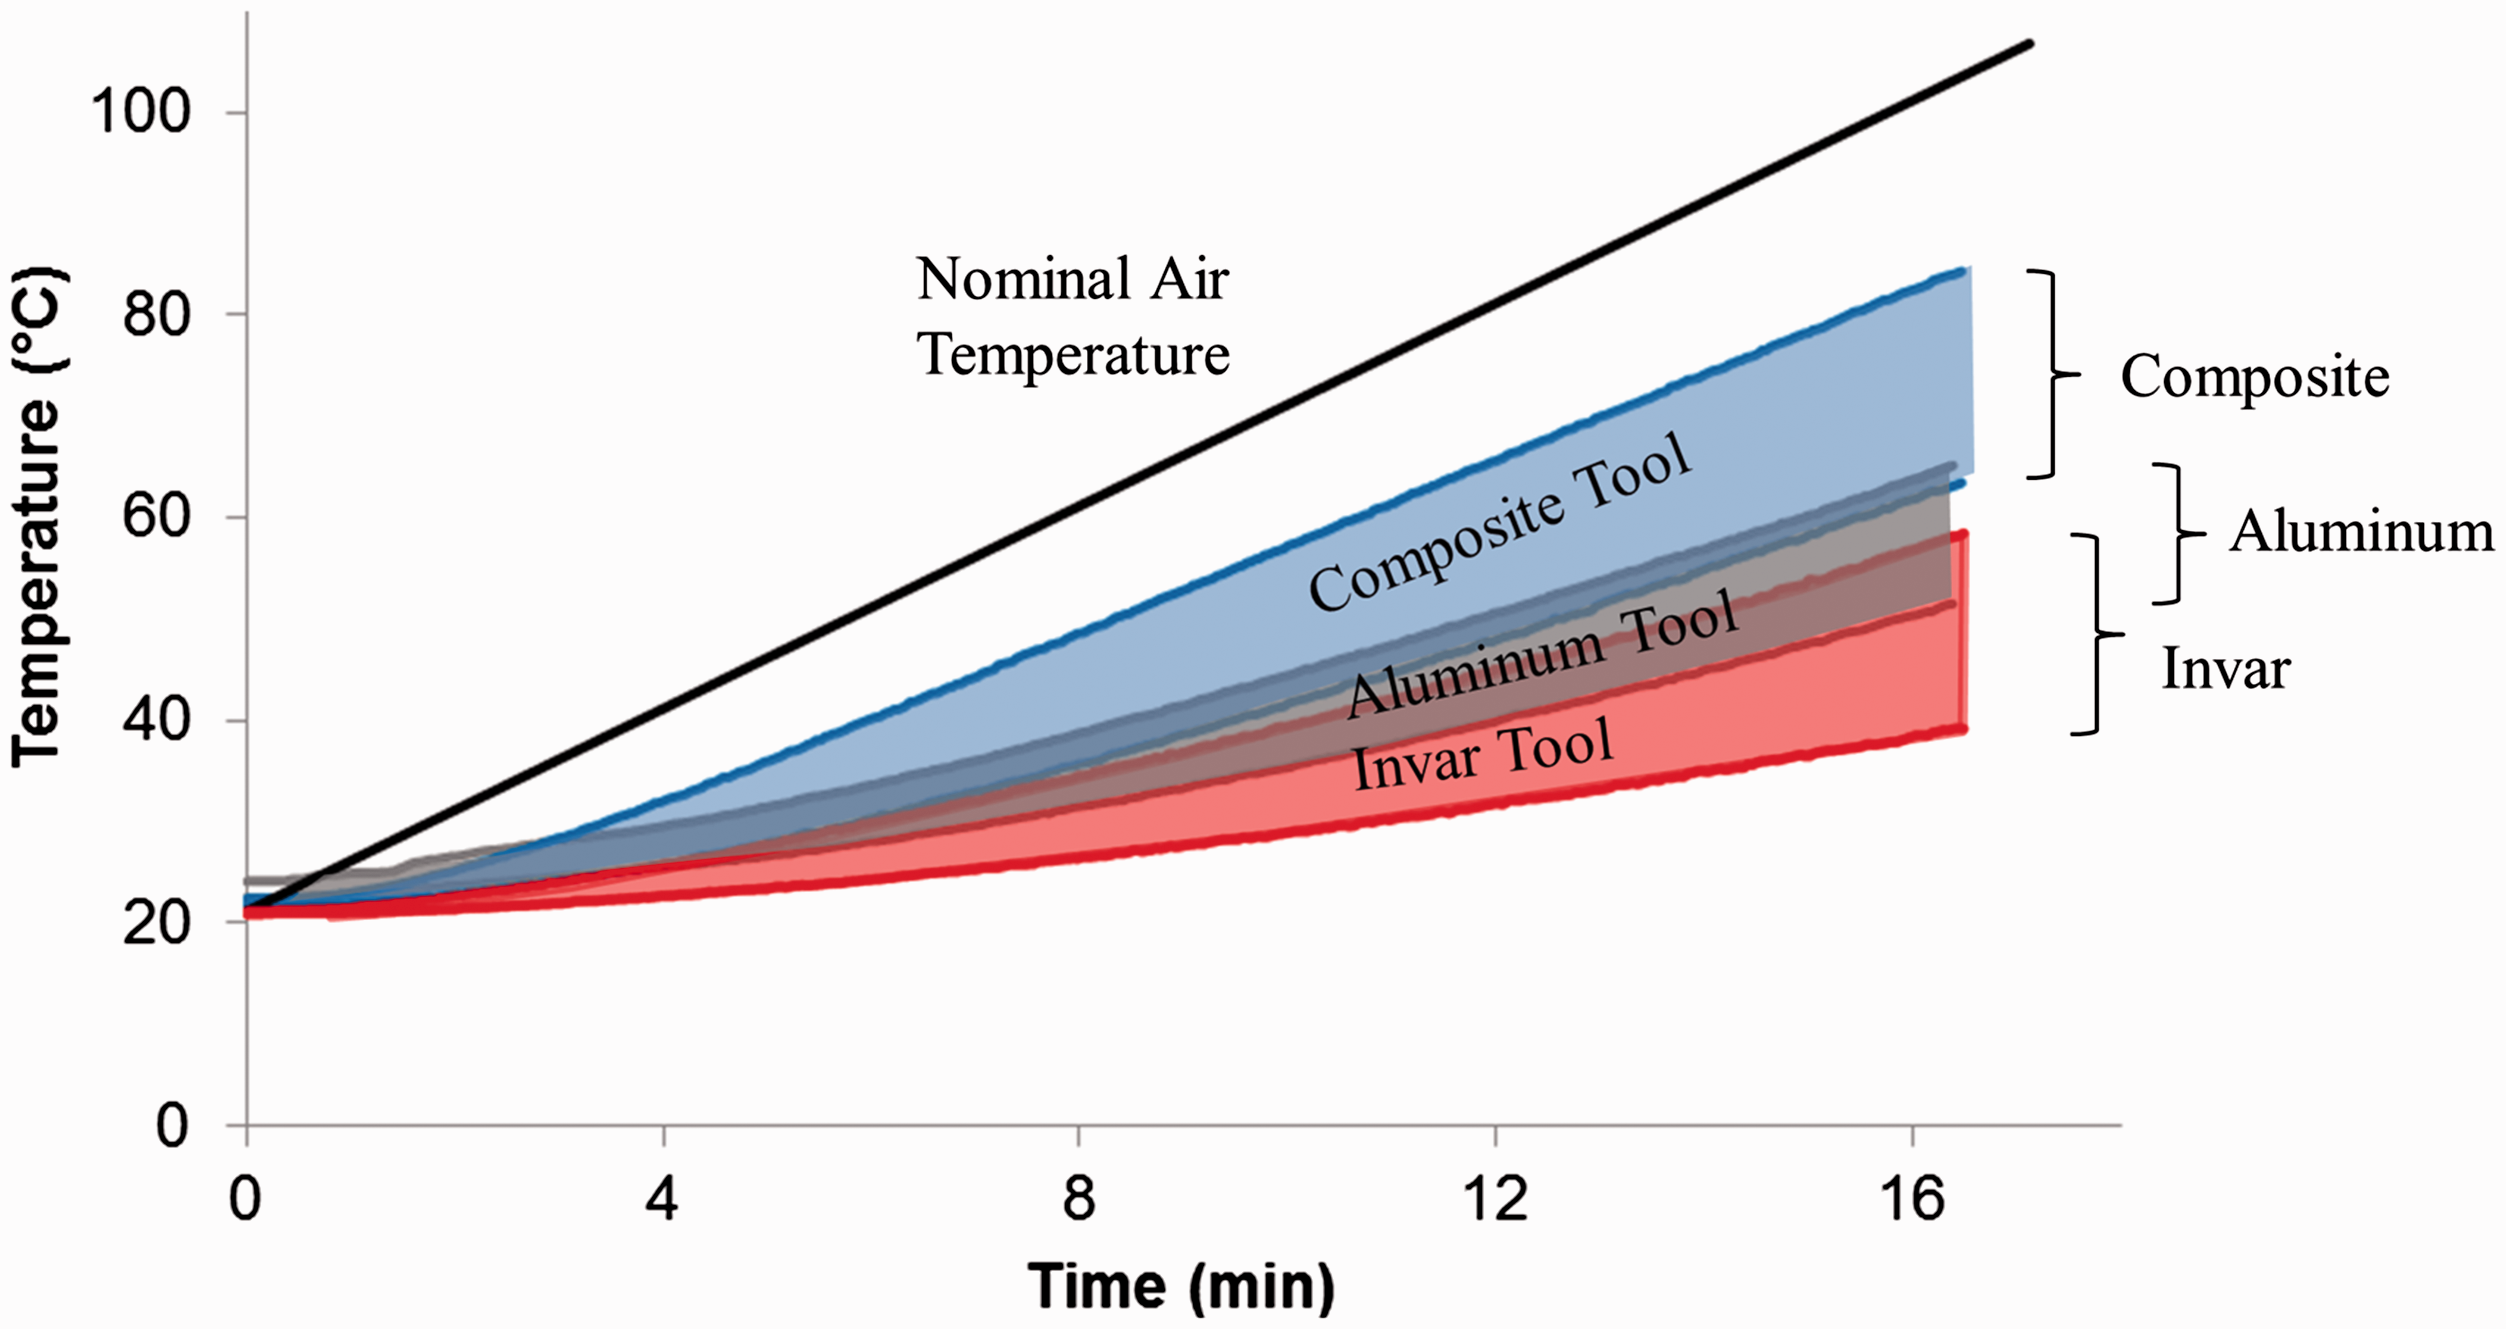

Discussion
Observations from the IR experiments may be explained using the analytical solutions developed from an energy balance argument and validated numerically. Three key parameters influence the surface temperature variations: (1) autoclave airflow variation (2) tooling material and (3) sub-structure.
Effect of air flow variation
The resultant images in Figures 4 and 5 illustrate the full temperature distribution across the tool. Several observations may be made regarding the effects of autoclave airflow variation. As observed by Slesinger et al., 31 the floor-ducted autoclave used in this study imparts a high-velocity plume near the top of the autoclave and near stagnant flows at the bottom of the autoclave toward the door. As the tools used in this study span this entire autoclave domain, the result is a significant variation of flow velocity across the tooling surface, creating localized hot spots toward the rear of the tool and cold spots near the front of the tool (i.e. coinciding with the high and low flow zones).
Consider a tool with a facesheet thickness of Representative transient response of a tool in convective heating subjected to a heat-up and hold cycle.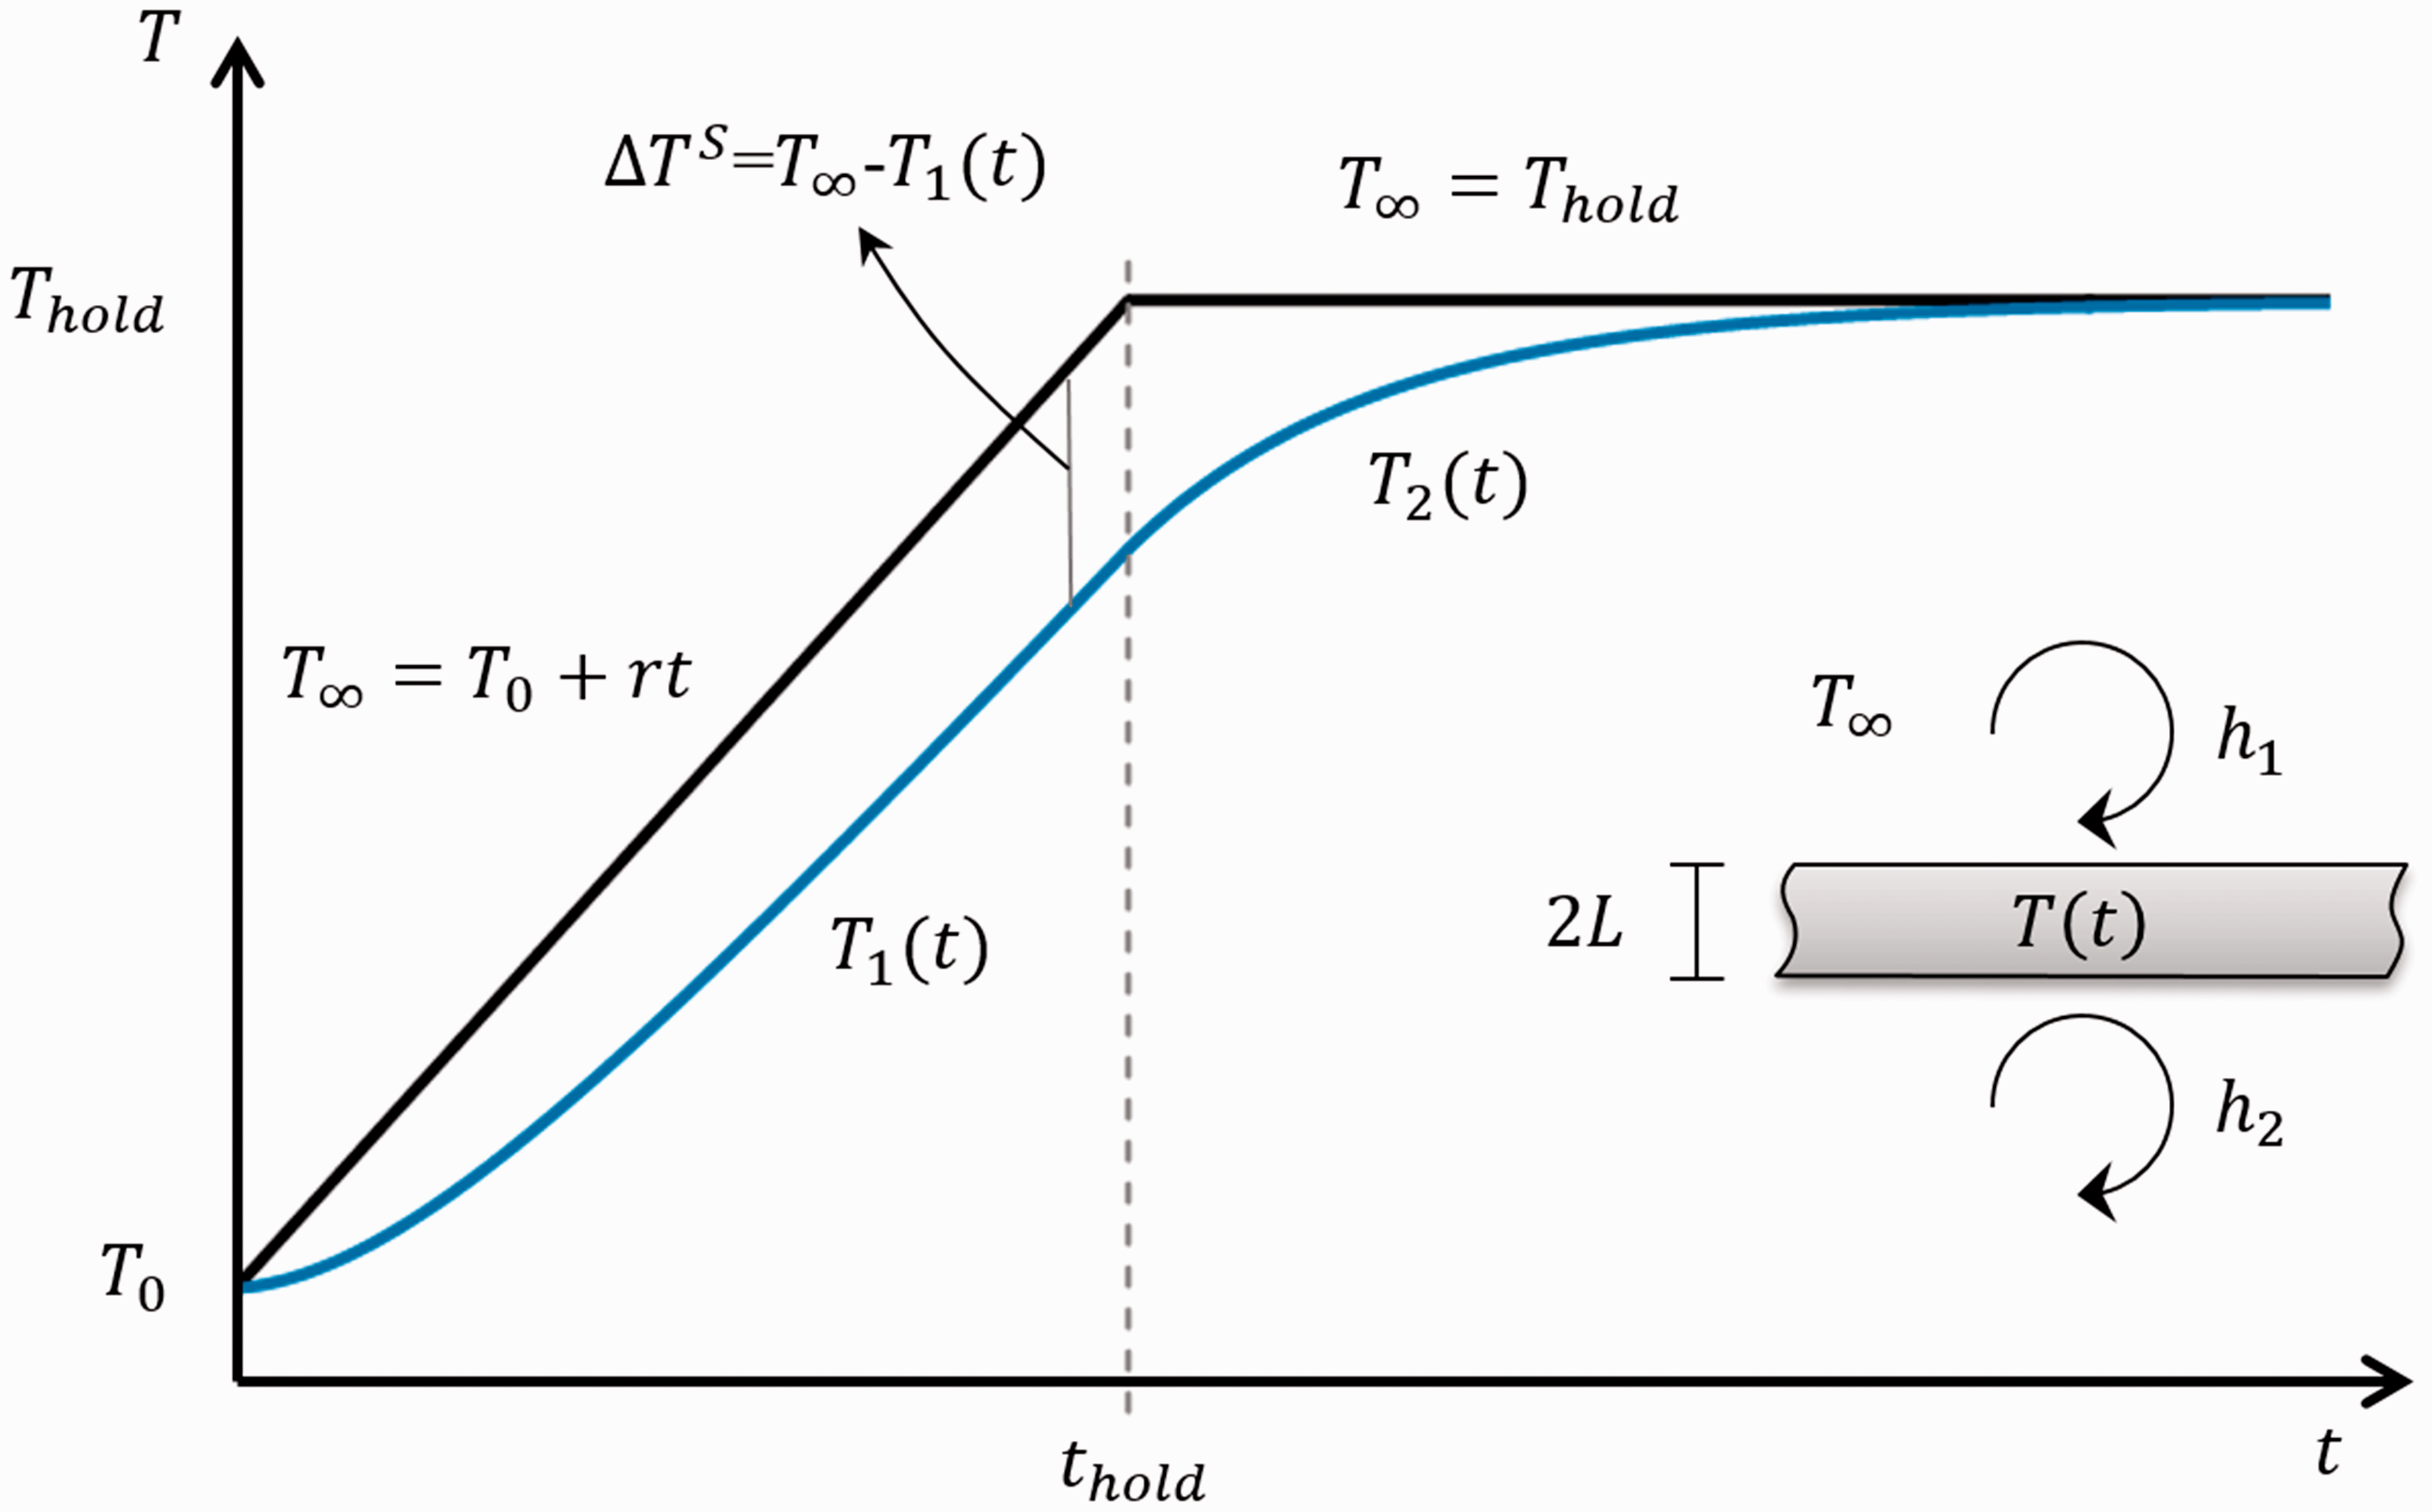
The effect of airflow variation is captured in equations (3) and (4) via the HTCs. As the flow increases, the HTC increases and the temperature lag decreases. Consequently, the local convective airflow and HTCs can now be realized by observing the surface temperature of the tool using IR thermography. The hottest locations have the highest airflow, while the coldest have the lowest flow.
For an Invar tool with properties listed under Table 1, two temperature profiles can be calculated for the minimum and maximum HTC conditions. Given a heating cycle at 5℃/min from room temperature to 100℃ followed by a 70 min dwell time, the tool temperature was calculated using equation (3) and compared with the surface temperatures obtained numerically using the RAVEN software package
30
as shown in Figure 9. Calculations were performed for a hot spot with HTCs of Comparison of the analytical, numerical and IR thermography results for transient thermal response of an Invar tool with properties listed under Table 1. Analytical and numerical results are obtained for two locations: (1) a hot spot with HTCs of 45 W/m2K and 15 W/m2K and (2) a cold spot with an HTCs of 15 W/m2K. Numerical results were obtained using RAVEN.
30
IR images are obtained from three separate tests. Numerical and analytical results are nearly identical.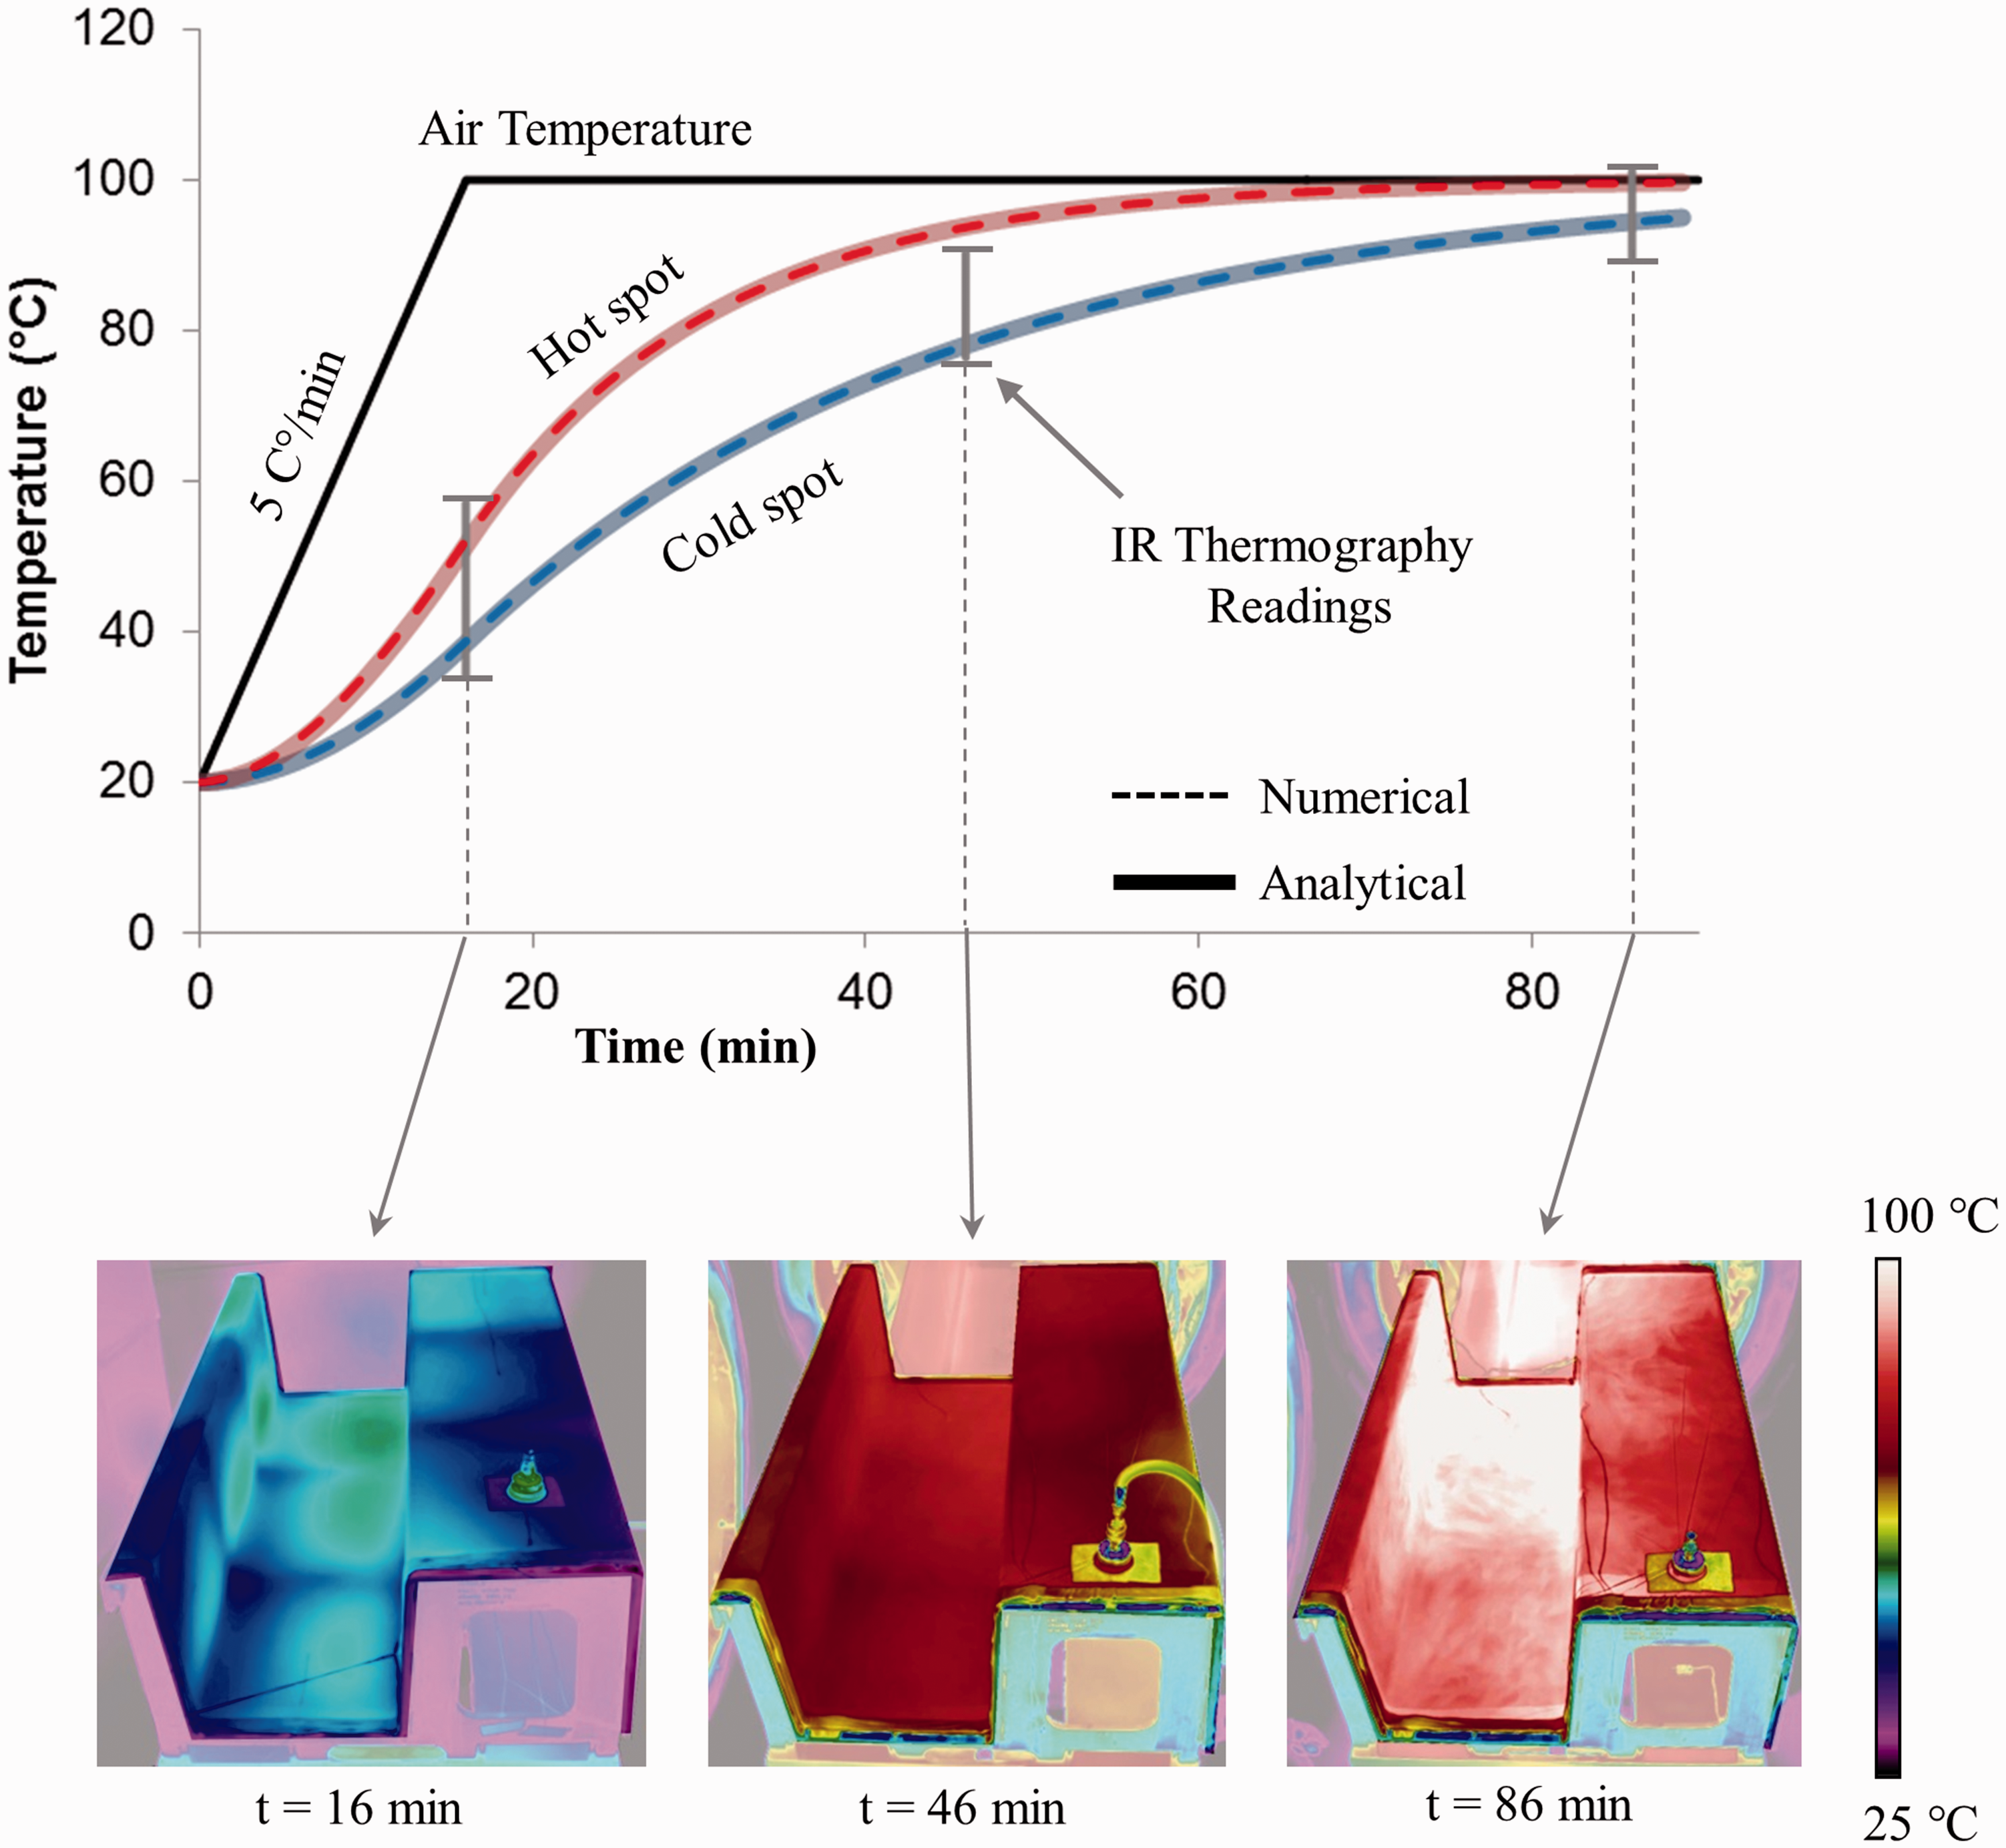
Effect of tooling material
For this experimental case, as the tool geometries and flow conditions are assumed to be identical,
Using the three tool types with properties listed under Table 1, for HTCs of 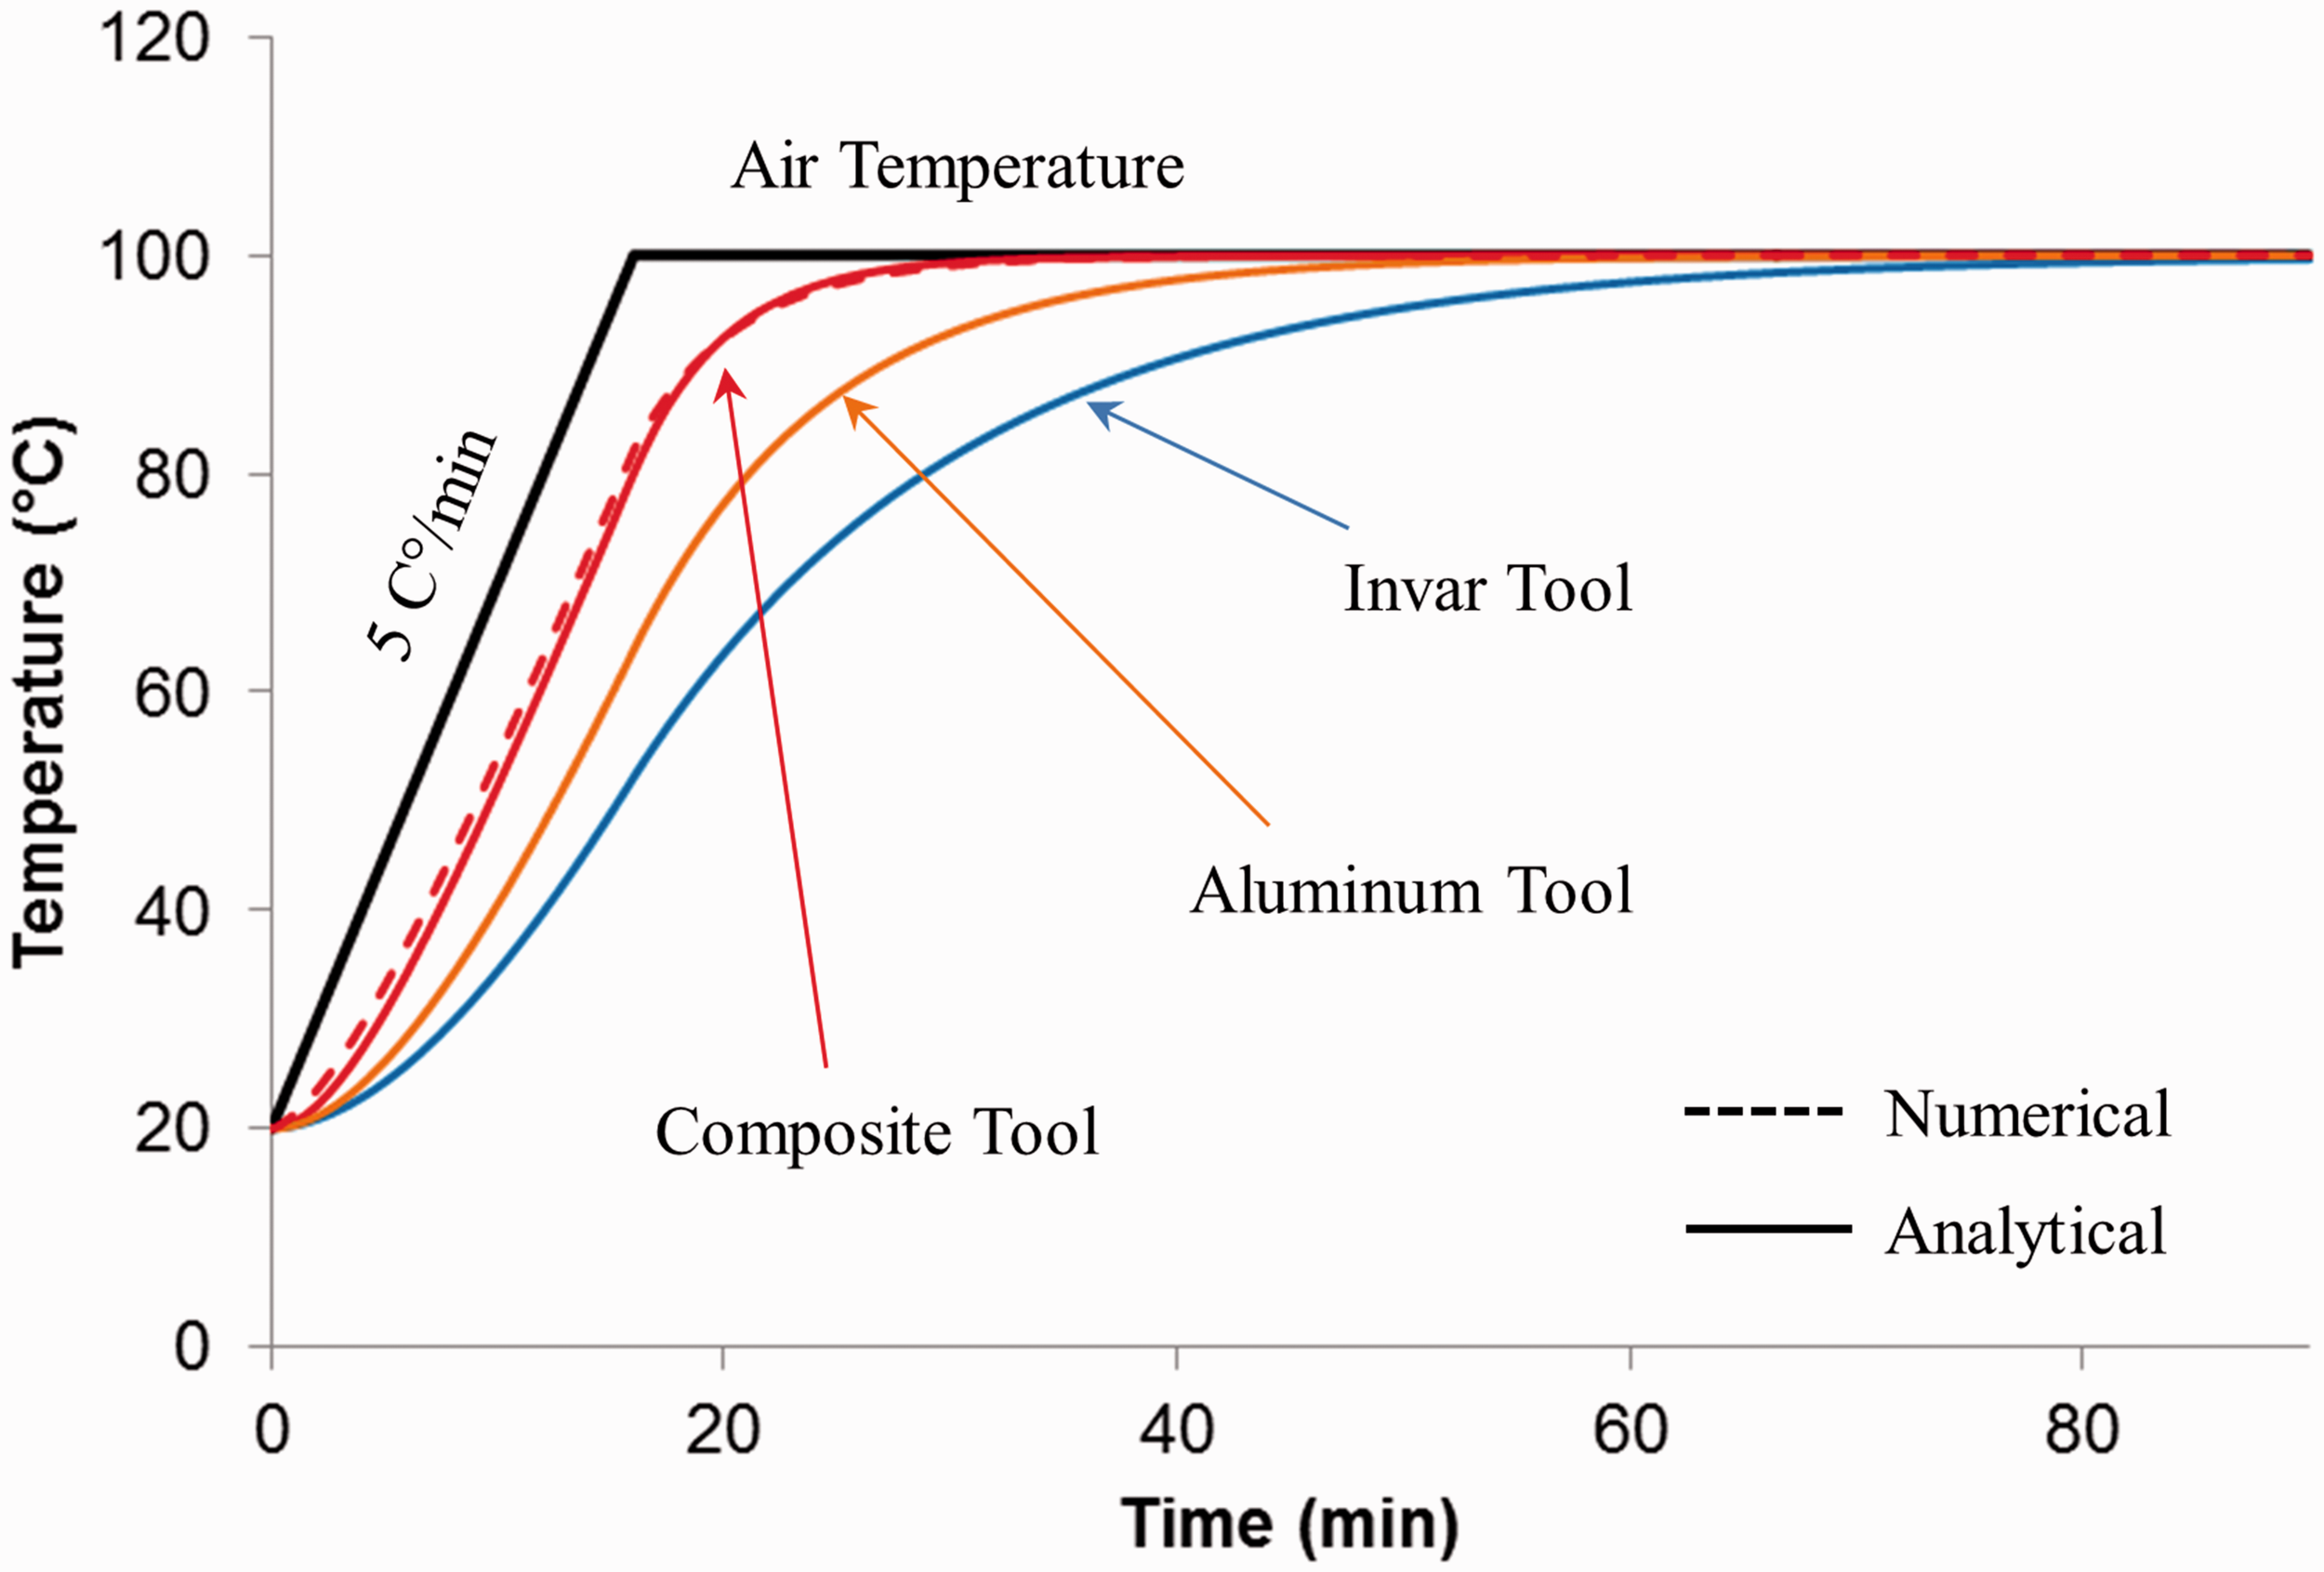
Effect of sub-structure
IR thermography results show localized cold spots coinciding with the attachment points of the sub-structure to the facesheet for the CFRP and Invar tools. The aluminum tool does not display this behaviour. This is attributed to the substructure acting as a thermal sink for these regions as a function of the thermal conductivity. The influence of thermal conductivity is better understood by deriving an analytical solution based on an energy balance for a single-finned tool in convective heating conditions.
Consider a plate with a thickness of Schematic of a sub-structure attachment to the tool facesheet to create a localized cold spot.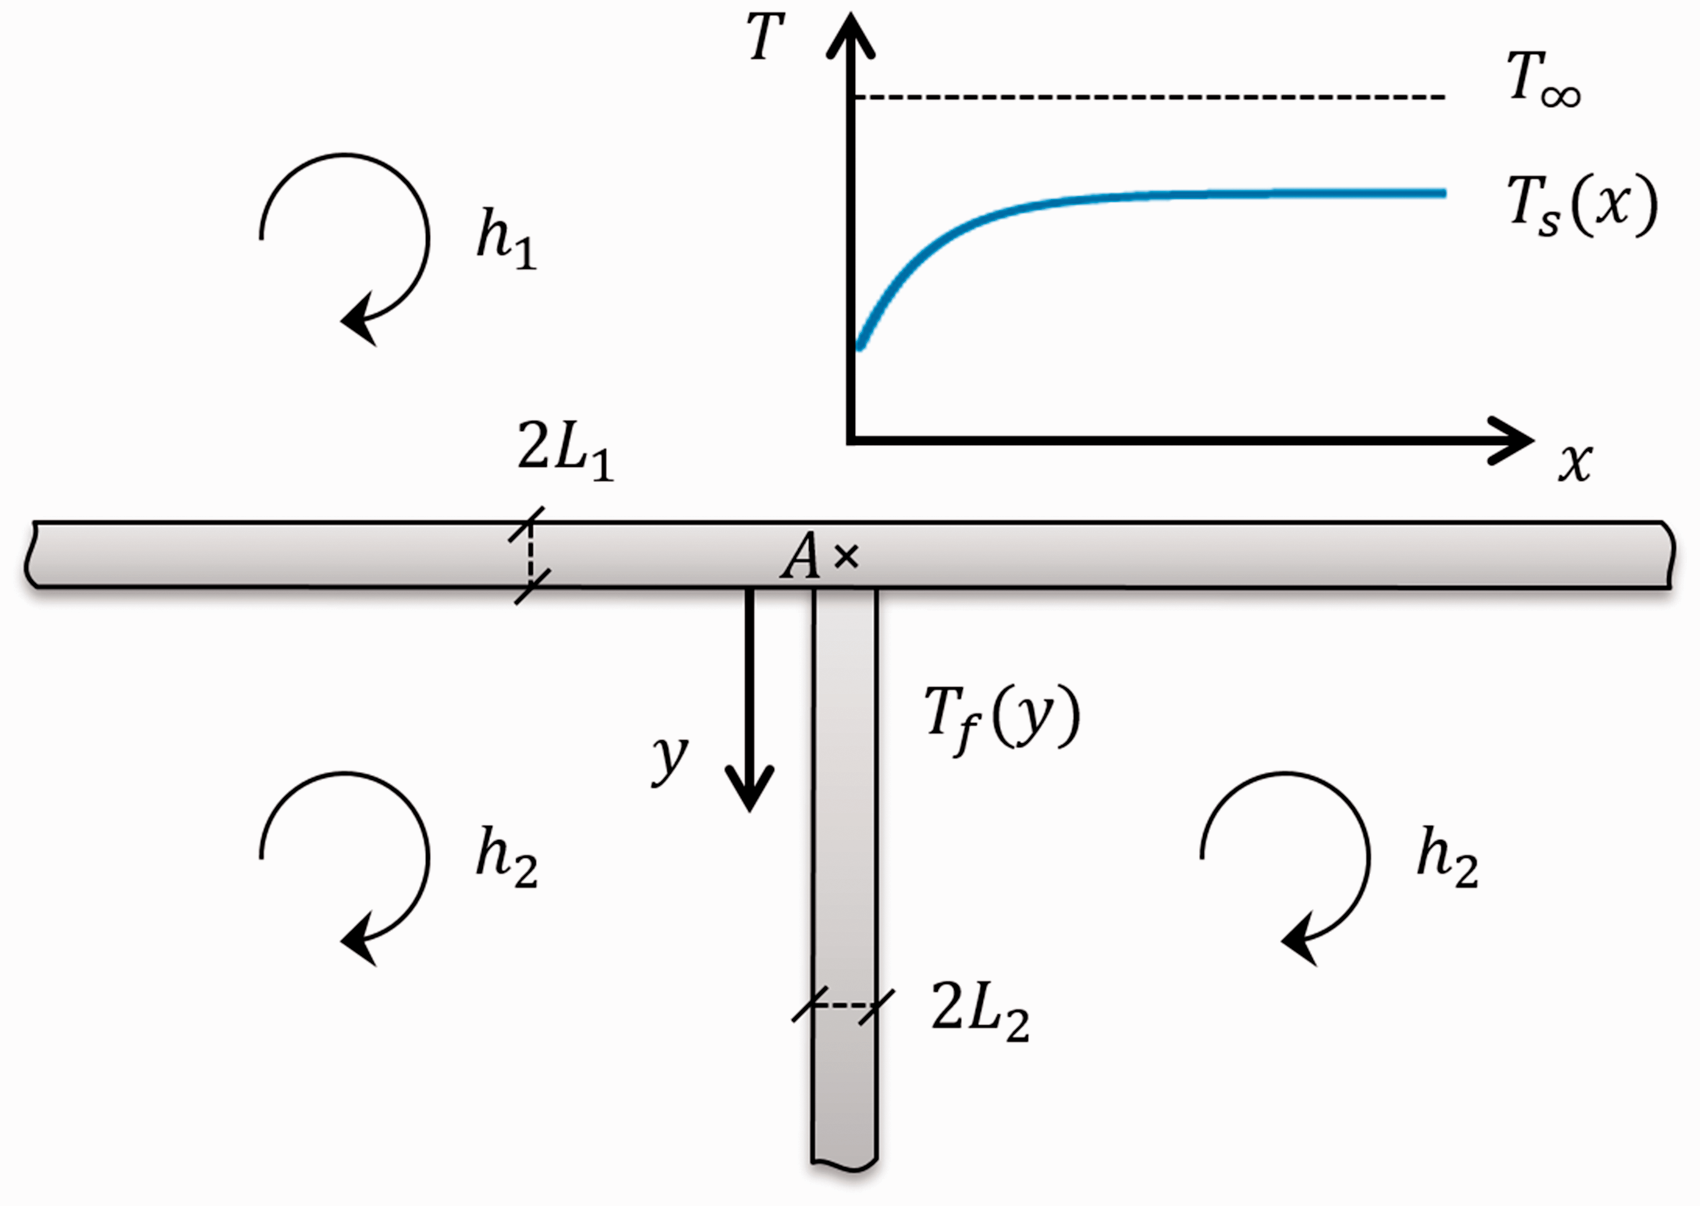
For given HTCs and thicknesses, the exponential term in equation (6) becomes a function of conductivity, k. Again, considering three tools with the properties listed under Table 1 and equivalent heating conditions, for a heating rate of 3℃/min and HTCs of
The above analytical solution is compared with numerical results obtained from finite element simulations as shown in Figure 12. Finite element simulations were performed using the ABAQUS software package with DC2D8 heat transfer quadrilateral elements and a mesh size of 1 mm. Results from the analytical solution are found to agree well with the numerical results.
Comparison of the thermal lag near the sub-structure attachment for three tools with properties listed under Table 1. Thermal lag was obtained at the quasi-steady-state condition for a heating rate of 3℃/min. Numerical results were obtained for the tool surface temperature using ABAQUS software.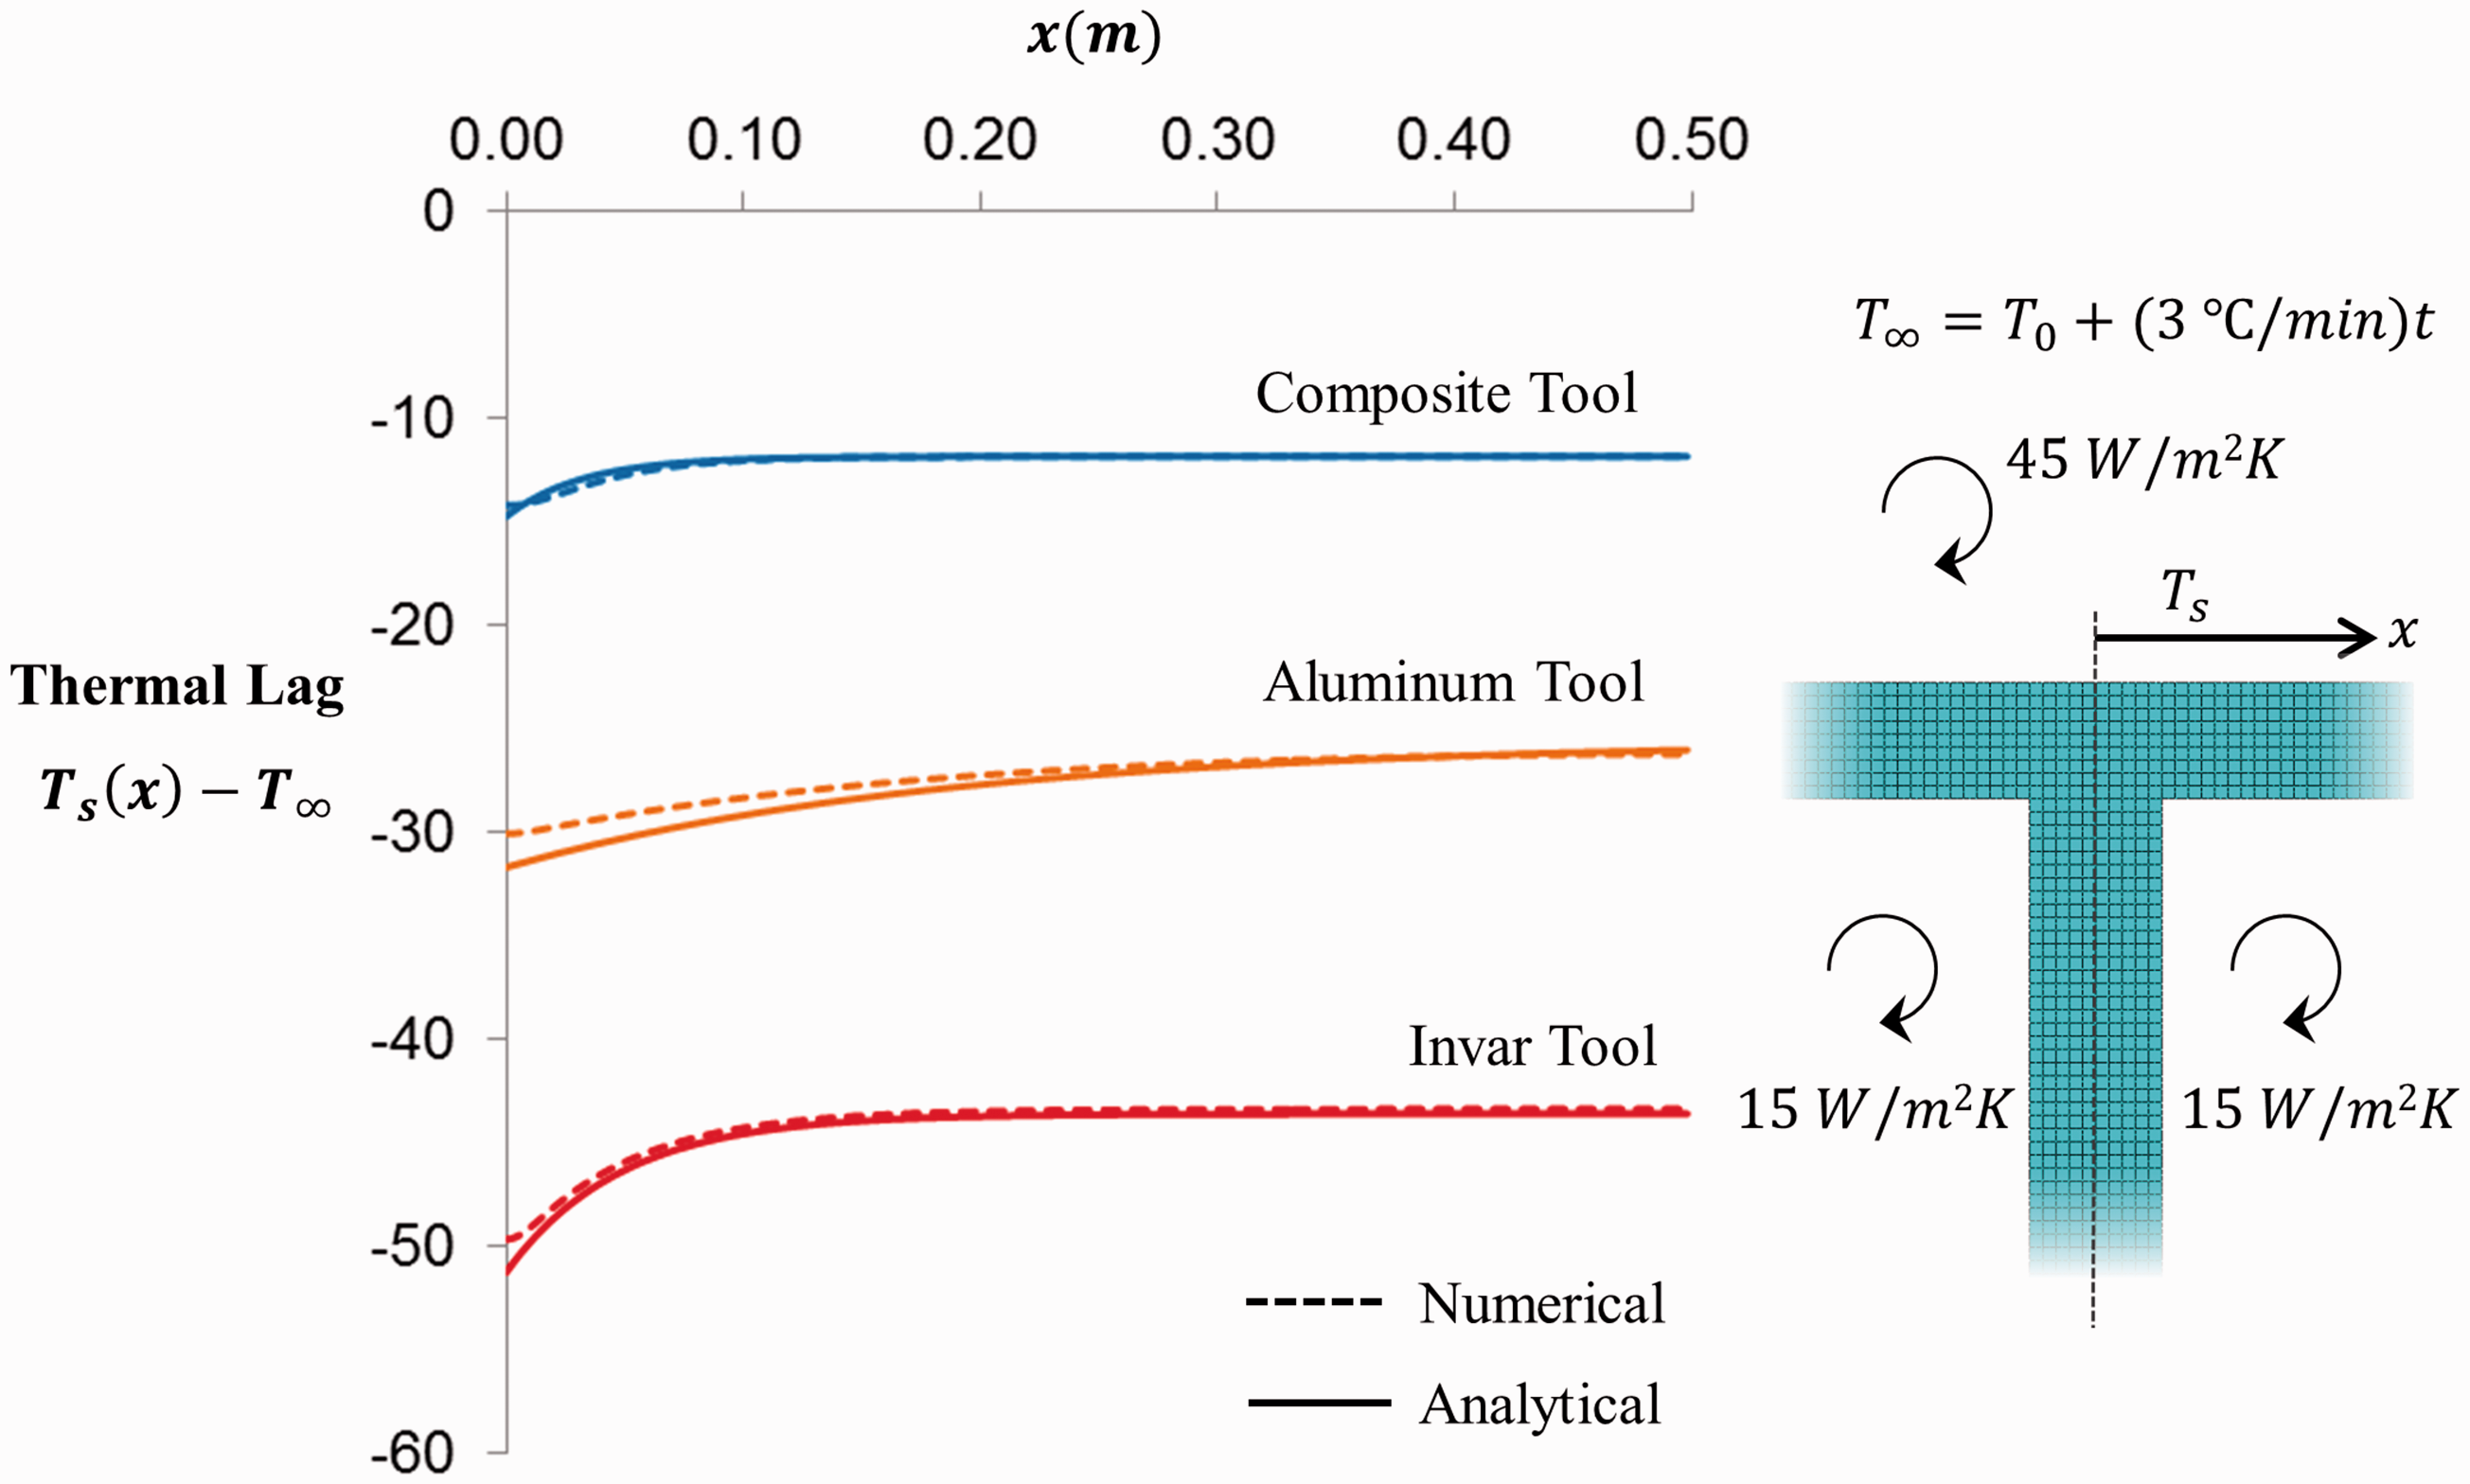
Based on equation (7), the sub-structure creates cold spots which are approximately 1.18–1.24 times more than the far field thermal lag. Because of the relatively low conductivity, this effect quickly disappears in the case of Invar and composite tools due to the exponential term. For the aluminum tool, high conductivity lowers the effect of the exponential term and spreads it over a much wider region minimizing the local effect of the sub-structure and spreading its influence across a much larger region. Consequently, while the composite and Invar tools exhibit strong sub-structure effects, the aluminum tool appears to be near isothermal near the sub-structure (Figure 5).
Summary and conclusions
In this paper, an IR thermography method was presented and used to observe the thermal response of convectively heated tools. The results show a complex, non-isothermal temperature distribution not easily observed using conventional methods such as thermocouples or calorimeters. This study identifies three influencing parameters: (1) autoclave airflow variation, (2) tooling material and, (3) tooling sub-structure. By covering the tool using a painted vacuum bag and employing a proper calibration procedure, temperature measurements with acceptable accuracy were achieved. The following main observations are made using this IR thermography method in conjunction with simple analytical heat transfer models:
Due to airflow variation in the autoclave, the HTC is not spatially constant and varies across the entire span of the tooling surface. This creates hot and cold spots on the tool surface during the heat up and entry to hold. For similar geometries and HTCs, the thermal mass of each tool dictates the overall temperature lag. Invar tooling has the greatest lag and composite tooling has the lowest lag. This is supported by the presented analytical solution. Sub-structure effects are strongly dependent upon the material thermal conductivity. While composite and Invar tools exhibit localized cold spots coincident with the sub-structure, aluminum creates a distributed profile that effectively averages these temperature lags across the span of the tool.
This work defines the role of tooling within the broader composite curing system (equipment, tooling, part, and material). The presented methods can be used to observe and describe the thermal behaviour of complex tooling heated by convection with complex gas flow. In addition, temperature measurements from the presented full-field IR thermography methodology can be potentially used to determine the effective HTC distribution on the tool surface. Such methods can be used to support the design of the curing system with regard to choice of tooling material and geometry as well as the determination and evaluation of the effect of apparent thermal boundary conditions on a given manufacturing setup.
Footnotes
Acknowledgements
We would like to acknowledge many fruitful discussions with colleagues at the Composites Research Network (CRN).
Declaration of Conflicting Interests
The author(s) declared no potential conflicts of interest with respect to the research, authorship, and/or publication of this article.
Funding
The author(s) disclosed receipt of the following financial support for the research, authorship, and/or publication of this article: The authors would like to thank the Natural Sciences and Engineering Research Council of Canada (NSERC) and the industrial members of the Composites Research Network (The Boeing Company, Convergent Manufacturing Technologies, Toray Americas, Avcorp Industries) for their financial support.