
Abstract
Strength of fiber reinforced polymers (FRPs) under compression loads is typically limited by a shear localization failure mode called microbuckling which is highly sensitive to fiber misalignment. In addition to the magnitude of fiber misalignment, the dimensionality of fiber misalignment also plays a prominent role in the prediction of compression strength. Therefore, a comparison between 1D, 2D, and 3D fiber misalignment is carried out in a finite element setting with a homogenized representation of fiber and matrix materials. In real FRP structures, fiber misalignment is spread in a correlated random manner throughout the material volume resulting in a distribution of compression strength. Spectral representation method is used for developing the volumetric representation of fiber misalignment in numerical models, thus preserving the spatial correlations of fiber misalignment. As an input to the spectral representation method, two different functional forms of spectral density of the fiber misalignment are considered. The results of model series based on functional forms of spectral density are also compared against a reference model series based on experimental measurements of the fiber misalignment. Finally, a simple relation is proposed for prediction of compression strength at different percentiles of distribution of failure strengths with regard to scaling of mean square spectral density.
Introduction
Continuous fiber reinforced polymers (FRPs) are increasingly becoming a material of choice for advanced structural components because of their exceptionally high strength and stiffness to weight ratios. The fields of applications of FRPs include highly loaded components such as fins, rudders and fuselage panels of modern aircraft, blades of wind turbines, and structural components of modern rockets among others.1,2 The compression strength of unidirectional FRPs can be as low as 60% of their tensile strength and shows uncertainty.3,4 Therefore, prediction of compression strength becomes highly relevant for reliable design practices.
Compression strength of FRPs is dictated by a phenomenon referred to as microbuckling (MB), also known as kinking, in the literature. Microbuckling is divided into an extensional/symmetrical/tensile mode and a shear mode.5–7 However, shear mode MB is of interest as it occurs in most of the industrial scale, high volume fraction FRPs. Other failure modes such as longitudinal splitting may compete with MB in low volume fraction FRPs, however, MB is the dominant failure mode in high volume fraction FRPs.5,7–9 The MB failure is controlled by the matrix shear nonlinearity and the manufacturing induced fiber misalignment. The MB failure is initiated when geometric softening at a location of a critical fiber misalignment outpaces the material hardening inside the incipient shear band.10–13 The MB failure mode is characterized by rotation of fibers in a localized band of shear deformation which leads to a sudden catastrophic reduction in the far field compression load. Further application of load matures the band to its final state before ultimate fracture of fibers at the ends of the band.
Different analytical and numerical models presented in the literature indicate the complexity and the difficulty associated with the accurate prediction of compression failure. Initial approaches to modeling compression failure mainly considered a single valued fiber misalignment angle ψ and presented analytical solutions.6,14–16 The analytical model by Budiansky, which can be found in Ref.
10
as equation (3), is widely used for prediction of compression strength. It considers compression strength σ
c
to be dependent on the initial fiber misalignment ψ and the matrix shear nonlinearity τ12(γ) as a function of the shear angle γ, see equation (1).
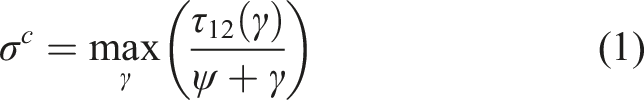
Although analytical models are valuable to highlight the importance of matrix nonlinearity and the fiber misalignment, such as one presented above which takes a single value of the fiber misalignment as an input, they are limited in prediction of the compression strength of real structures.
Improving on the assumptions of the analytical modeling, different numerical models were introduced in literature over the decades. Typical numerical approaches consider a sinusoidal undulation of the fiber misalignment. The common assumption of an infinite band, in which imperfection is considered uniform in transversal directions and only varies in longitudinal direction, is commonly applied in 1D numerical models.17,18 2D models considering variation of the fiber misalignment in longitudinal as well as in transversal direction with idealized forms of the misalignment can also be found in the literature.19–22 In the same spirit, 3D models23–29 have been used to explore different features associated with MB failure such as mechanisms leading to failure, band angle, and band width.
Aforementioned models have mostly considered idealized forms of the fiber misalignment. The fiber misalignment in real structures is correlated random in nature.30–34 The random nature of the fiber misalignment observed in measurements requires modeling approaches where such variations of the fiber misalignment can be accounted for in the numerical models. Some micromechanical approaches incorporate misalignment variations, such as the investigation by Varandas et al. 35 with the help of a stochastic process and an optimization procedure, however, the difficult model generation and high computational costs deem such an approach relatively unsuitable for simulating a large number of model realizations. To overcome these problems, homogenized approaches offer a better alternative. In these approaches, fiber and matrix are modeled using a smeared material representation. In the homogenized approaches, a single material model accounting for the anisotropy represents the fibers and the matrix in a smeared sense. Material nonlinearities, such as matrix shear behavior which is essential for modeling microbuckling, are included in such models along with geometrical nonlinearities through different approaches such as plasticity or damage modeling. The first such approach in 1D was introduced by Slaughter et al. 36 Controlling the correlation of the fiber misalignment distribution using the spectral representation method, distributions of the compression strength were predicted. The spectral density of a given distribution of the fiber misalignment such as an experimentally measured distribution can be used to generate virtual distributions with the spectral representation method.37–39 The spectral representation method offers a direct bridge between the measured spatial distributions of fiber misalignment and their virtually generated counterparts. Using discrete spectral densities as an input to the spectral representation method, the topologies of the fiber misalignment in the form of spatial distributions of misalignment angles or amplitudes are generated. These spatial distributions are in turn used to define local material orientations in the homogenized approaches. It is ensured this way, that not only the statistical information of the fiber misalignment but also the spatial distribution is represented in a model. Spectral representation method models all the wavelengths in the range of the discretization length (minimum wavelength) and the model size (maximum wavelength). Extending Slaughter’s approach to 2D, Liu et al. investigated the effects of different modeling parameters on the prediction of compression strength. 40 Sutcliffe 41 presented an alternate simplified approach to Liu et al. where correlation of the fiber misalignment distribution was controlled in an apparent artificial manner. Another approach was presented by Allix et al. 42 in 3D albeit with a random spread of the misalignment with no correlation.
Realizing the potential benefits of easier modeling and lower computational costs, a homogenized modeling approach using the finite element (FE) method is used in the current contribution. Previous homogenized investigations in the literature with random representation of the fiber misalignment are limited to 1D, 36 2D,40,41 and 3D but with a 2D fiber misalignment distribution. 42 The fiber misalignment in FRP laminates is in reality three dimensional. To highlight the effect of dimensionality of the fiber misalignment on the prediction of the compression strength, an investigation using simple sinusoidal form of the misalignment is performed using a homogenized modeling approach. Realizing the importance of 3D modeling for realistic representation of FRP laminates, 3D distributions of the fiber misalignment calibrated from 3D spectral densities are used in the current investigation. For this purpose, the misalignment distributions are generated using an extended form of the spectral representation method. Square and exponential forms of the spectral densities are considered and their effects on the distributions of the predicted strength are explored. Furthermore, the effects of scaling the mean square spectral density, which is the area under the spectral density curve and is a material quantity, are investigated. A simple relation for prediction of compression strength of models with scaled misalignment is also provided.
Model description
For the prediction of the compression strength, accurate modeling of the fiber misalignment as well as an accurate description of the material model are necessary. The modeling methodology follows the approach presented in an earlier contribution of the authors, see Ref. 43 Therefore, only a brief description of the material model and the geometric model will be summarized in this section. Virtual distributions of the fiber misalignment are generated using the spectral representation method. The use of different functional forms of the spectral density for generation of misalignment distributions will be presented in detail.
Material model
As concluded from the state of the art review of modeling for compression failure of FRPs, homogenized approaches offer ease of modeling over larger sizes with lower computational effort. The anisotropy is usually incorporated by the orientation of the preferred material axis. In a numerical model, the fiber misalignment is included via orientation of the vector representing the preferred material axis at the integration point of the finite elements. For the high volume fraction FRPs having a tight hexagonal packing of the fibers in the matrix materials, the material behavior is usually assumed to be transversely isotropic. 4 Hence, in current investigation the homogenized fiber-matrix material having a 55% fiber volume fraction was modeled using a transversely isotropic material model. The anisotropy is represented using a so-called structural tensor which is defined based on the vector of the initial fiber direction. The material nonlinearities were accounted for using plasticity. To predict realistic plastic deformations, a nonassociative flow rule was assumed. The material model has been implemented in the commercial software Abaqus, and is an extension of the small strain transversely isotropic material model for unidirectional FRPs. 44 The process for determining the parameters of the material model is given in Ref. 45 The geometrical nonlinearities were accounted for using a co-rotational formulation. 45
Wisnom 46 highlighted a limitation of using a homogenized material representation in the commercial software Abaqus as it ignores the effect of shear strains on the material axes rotation. By default, Abaqus ignores the effect of shear strains on the material axes rotation and only considers the material axes rotation to be identical with the rigid body rotations. Since the effect of shear strains on the material axes rotation during loading is crucial in case of compression, the default implementation in Abaqus gives inaccurate results. To overcome this problem, the material model from Ref. 45 was modified to account for the rotation of the material axes due to shear strains. The shear strains from the each iteration of the solution were considered as Euler angle rotations to update the current material axis orientation. A verification against Budiasnky’s analytical solution using a single element model over a range of initial misalignment angles with and without the modification was presented in Ref. 43 It was shown that without this correction, the numerical model overpredicted compression strength.
A question that arises in this context is, how many angles would be needed to accurately model the three-dimensional misalignment of a fiber in volumetric space from its mean direction in unidirectional FRPs. Following the Euler angles notation in combination with the realization that fibers’ rotation around their own axis does not affect MB failure, it is sufficient to have two independent angles for modeling the fiber misalignment in FRPs. These two angles correspond to the in-plane misalignment angle θ and the out-of-plane misalignment angle ϕ. This line of argumentation is coherent with the transversely isotropic behavior observed in unidirectional FRP materials. Therefore, these two angles θ and ϕ are sufficient for a complete volumetric representation of the total misalignment ψ from the nominal fiber direction i.e. Schematic of a fiber (in black color) misaligned from the nominal fiber direction 1 to direction 1′.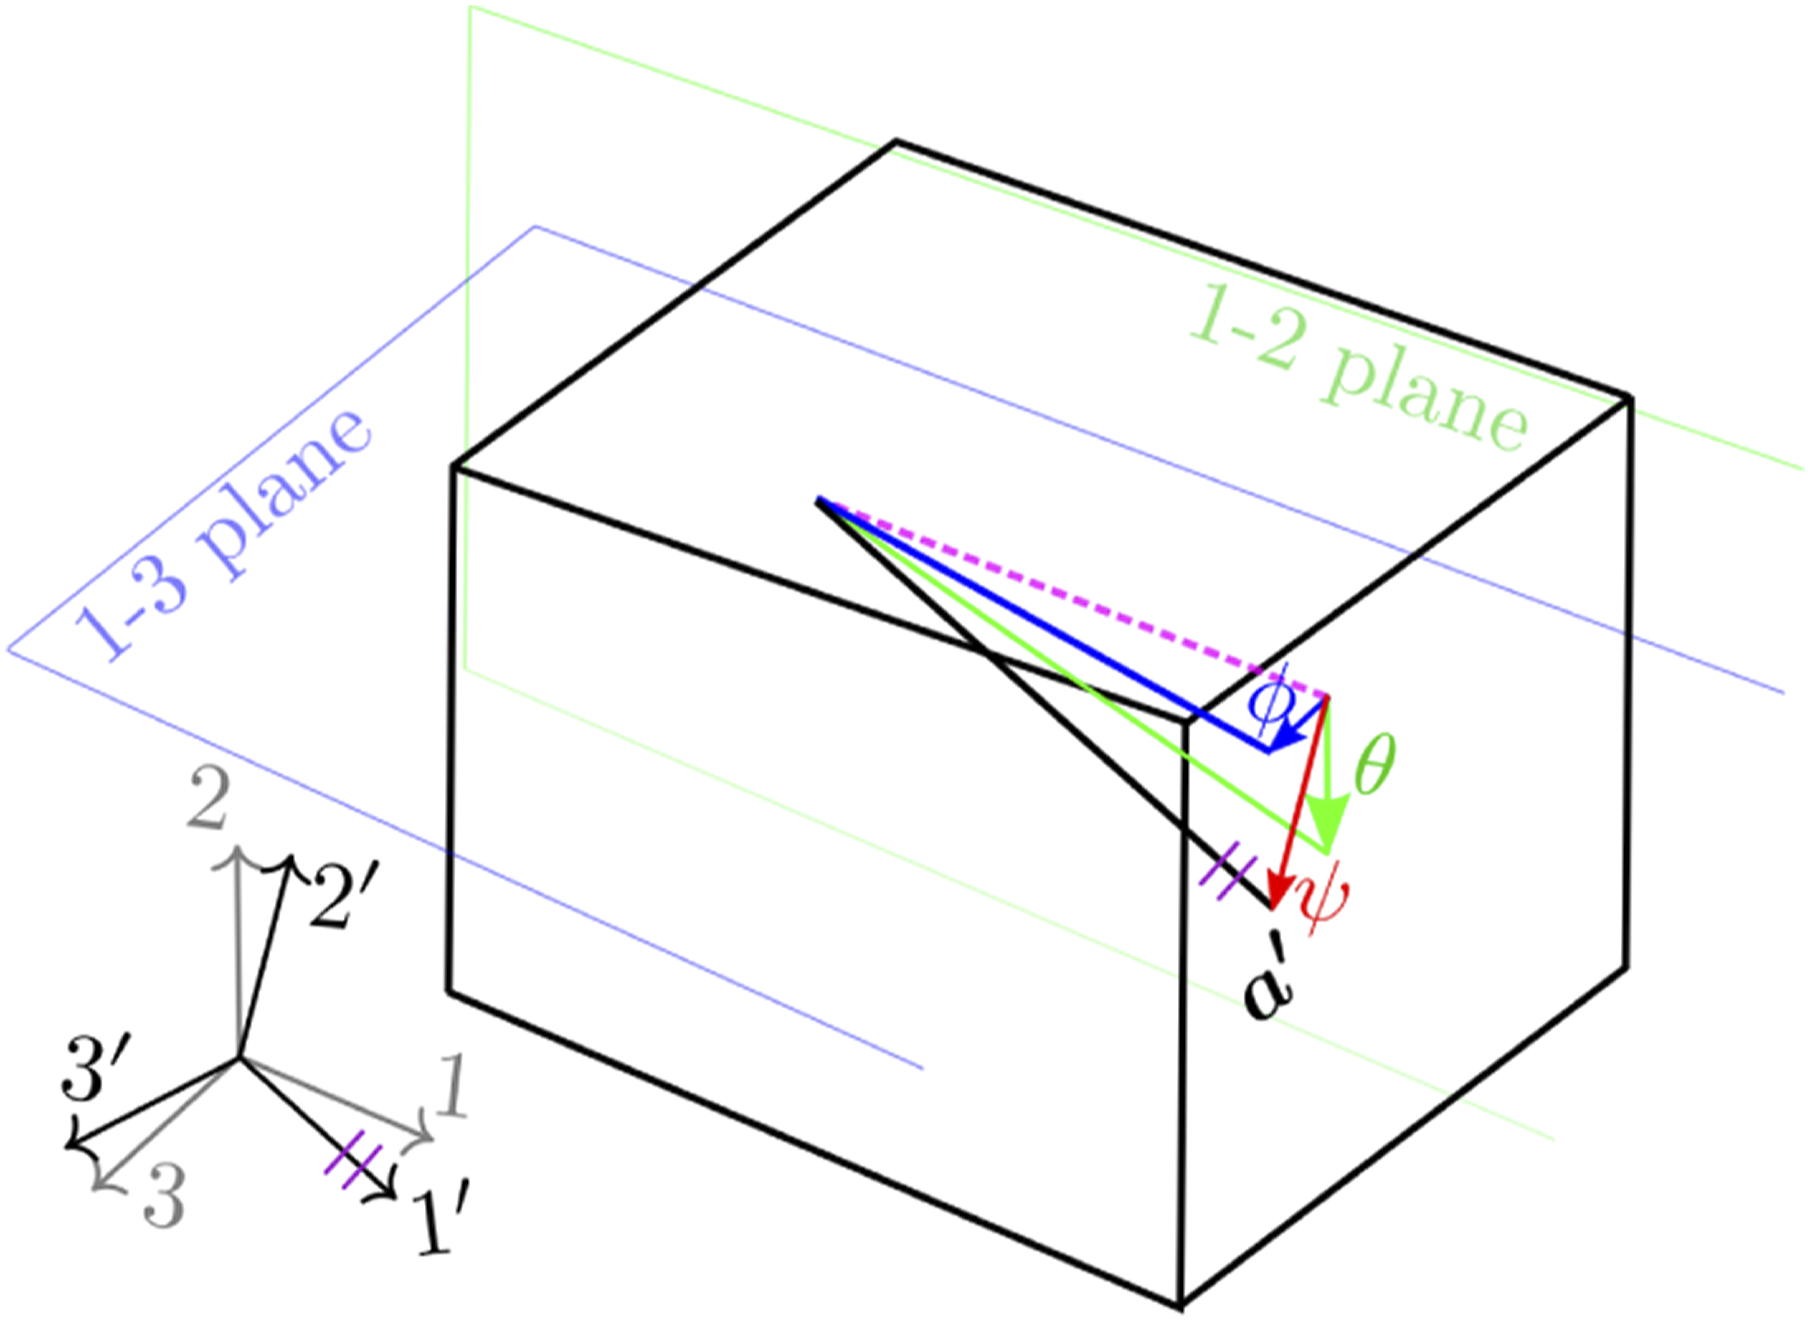
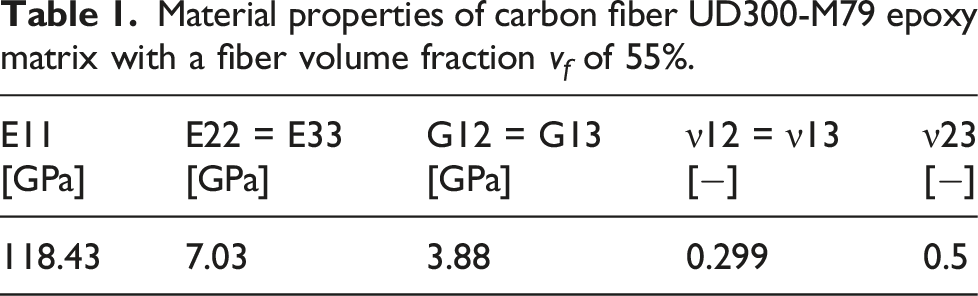
Material properties of carbon fiber UD300-M79 epoxy matrix with a fiber volume fraction v f of 55%.
Misalignment topologies
Reference topologies driven from measurement of the misalignment
A detailed description of the procedure for acquiring the misalignment data may be found in Ref.
47
, and only a brief synopsis is presented here. Ideally an ensemble averaged value of the spectral density has to be calculated by measuring misalignment experimentally in a statistical manner for it to be a material characteristic quantity. However, only two specimens were scanned for characterization of the spectral densities because of the steep costs per CT-scan at the required resolution.
47
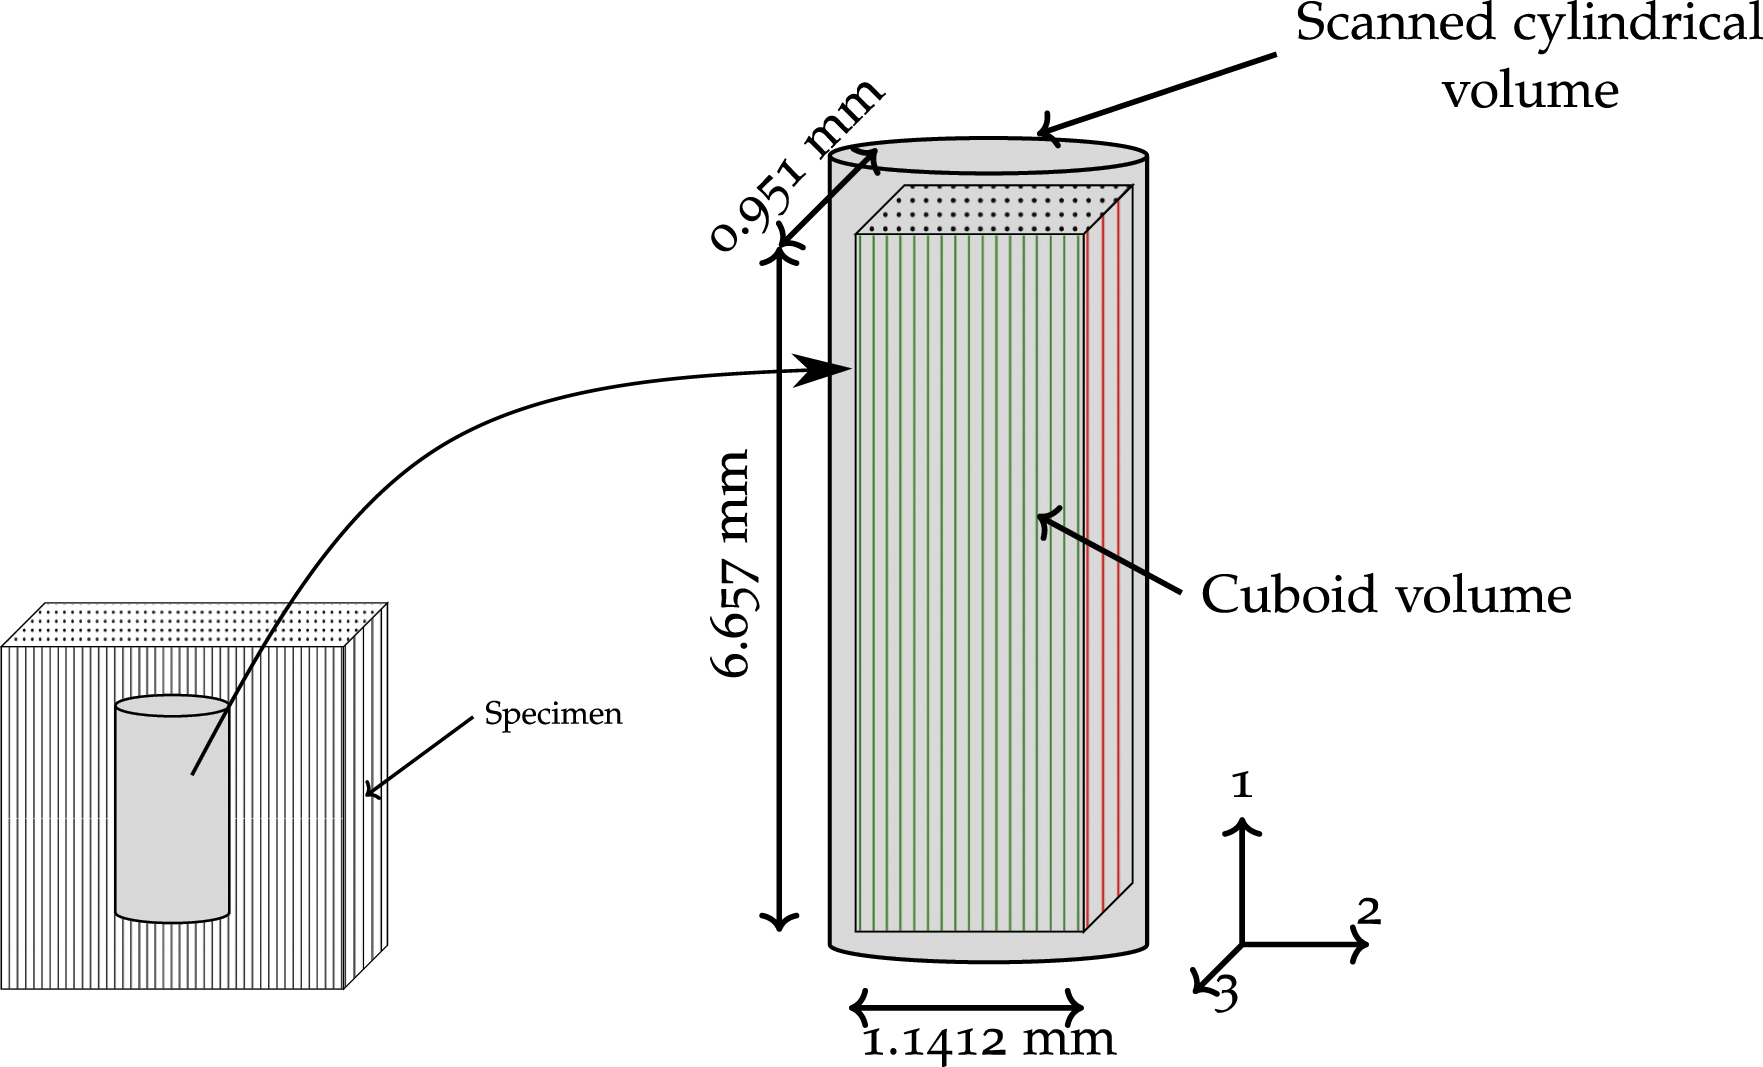
The specimens were scanned by an X-ray microscope with a resolution of 1.902 µm. A voxel resolution of 1.902 µm was selected to ensure a fine enough resolution at which the algorithms for the measurement of fiber angles can differentiate between matrix material and fibers. The selected resolution limited the scanned cylinder diameter to approximately 2 mm. The volume of the composite in which the algorithm was able to detect fiber and matrix materials separately for both the in-plane θ and the out-of-plane ϕ angles was approximately 6.657 × 1.1412 × 0.951 mm. A schematic of a cuboid volume selected from a cylindrical scanned volume is shown in Figure 2. The viewing planes in 1–2 and 1–3 planes, i.e., the in-plane and the out-of-plane, are marked in green and red colors, respectively. Using the image processing technique “High Resolution Misalignment Analysis” (HRMA) proposed by Wilhelmsson and Asp,
48
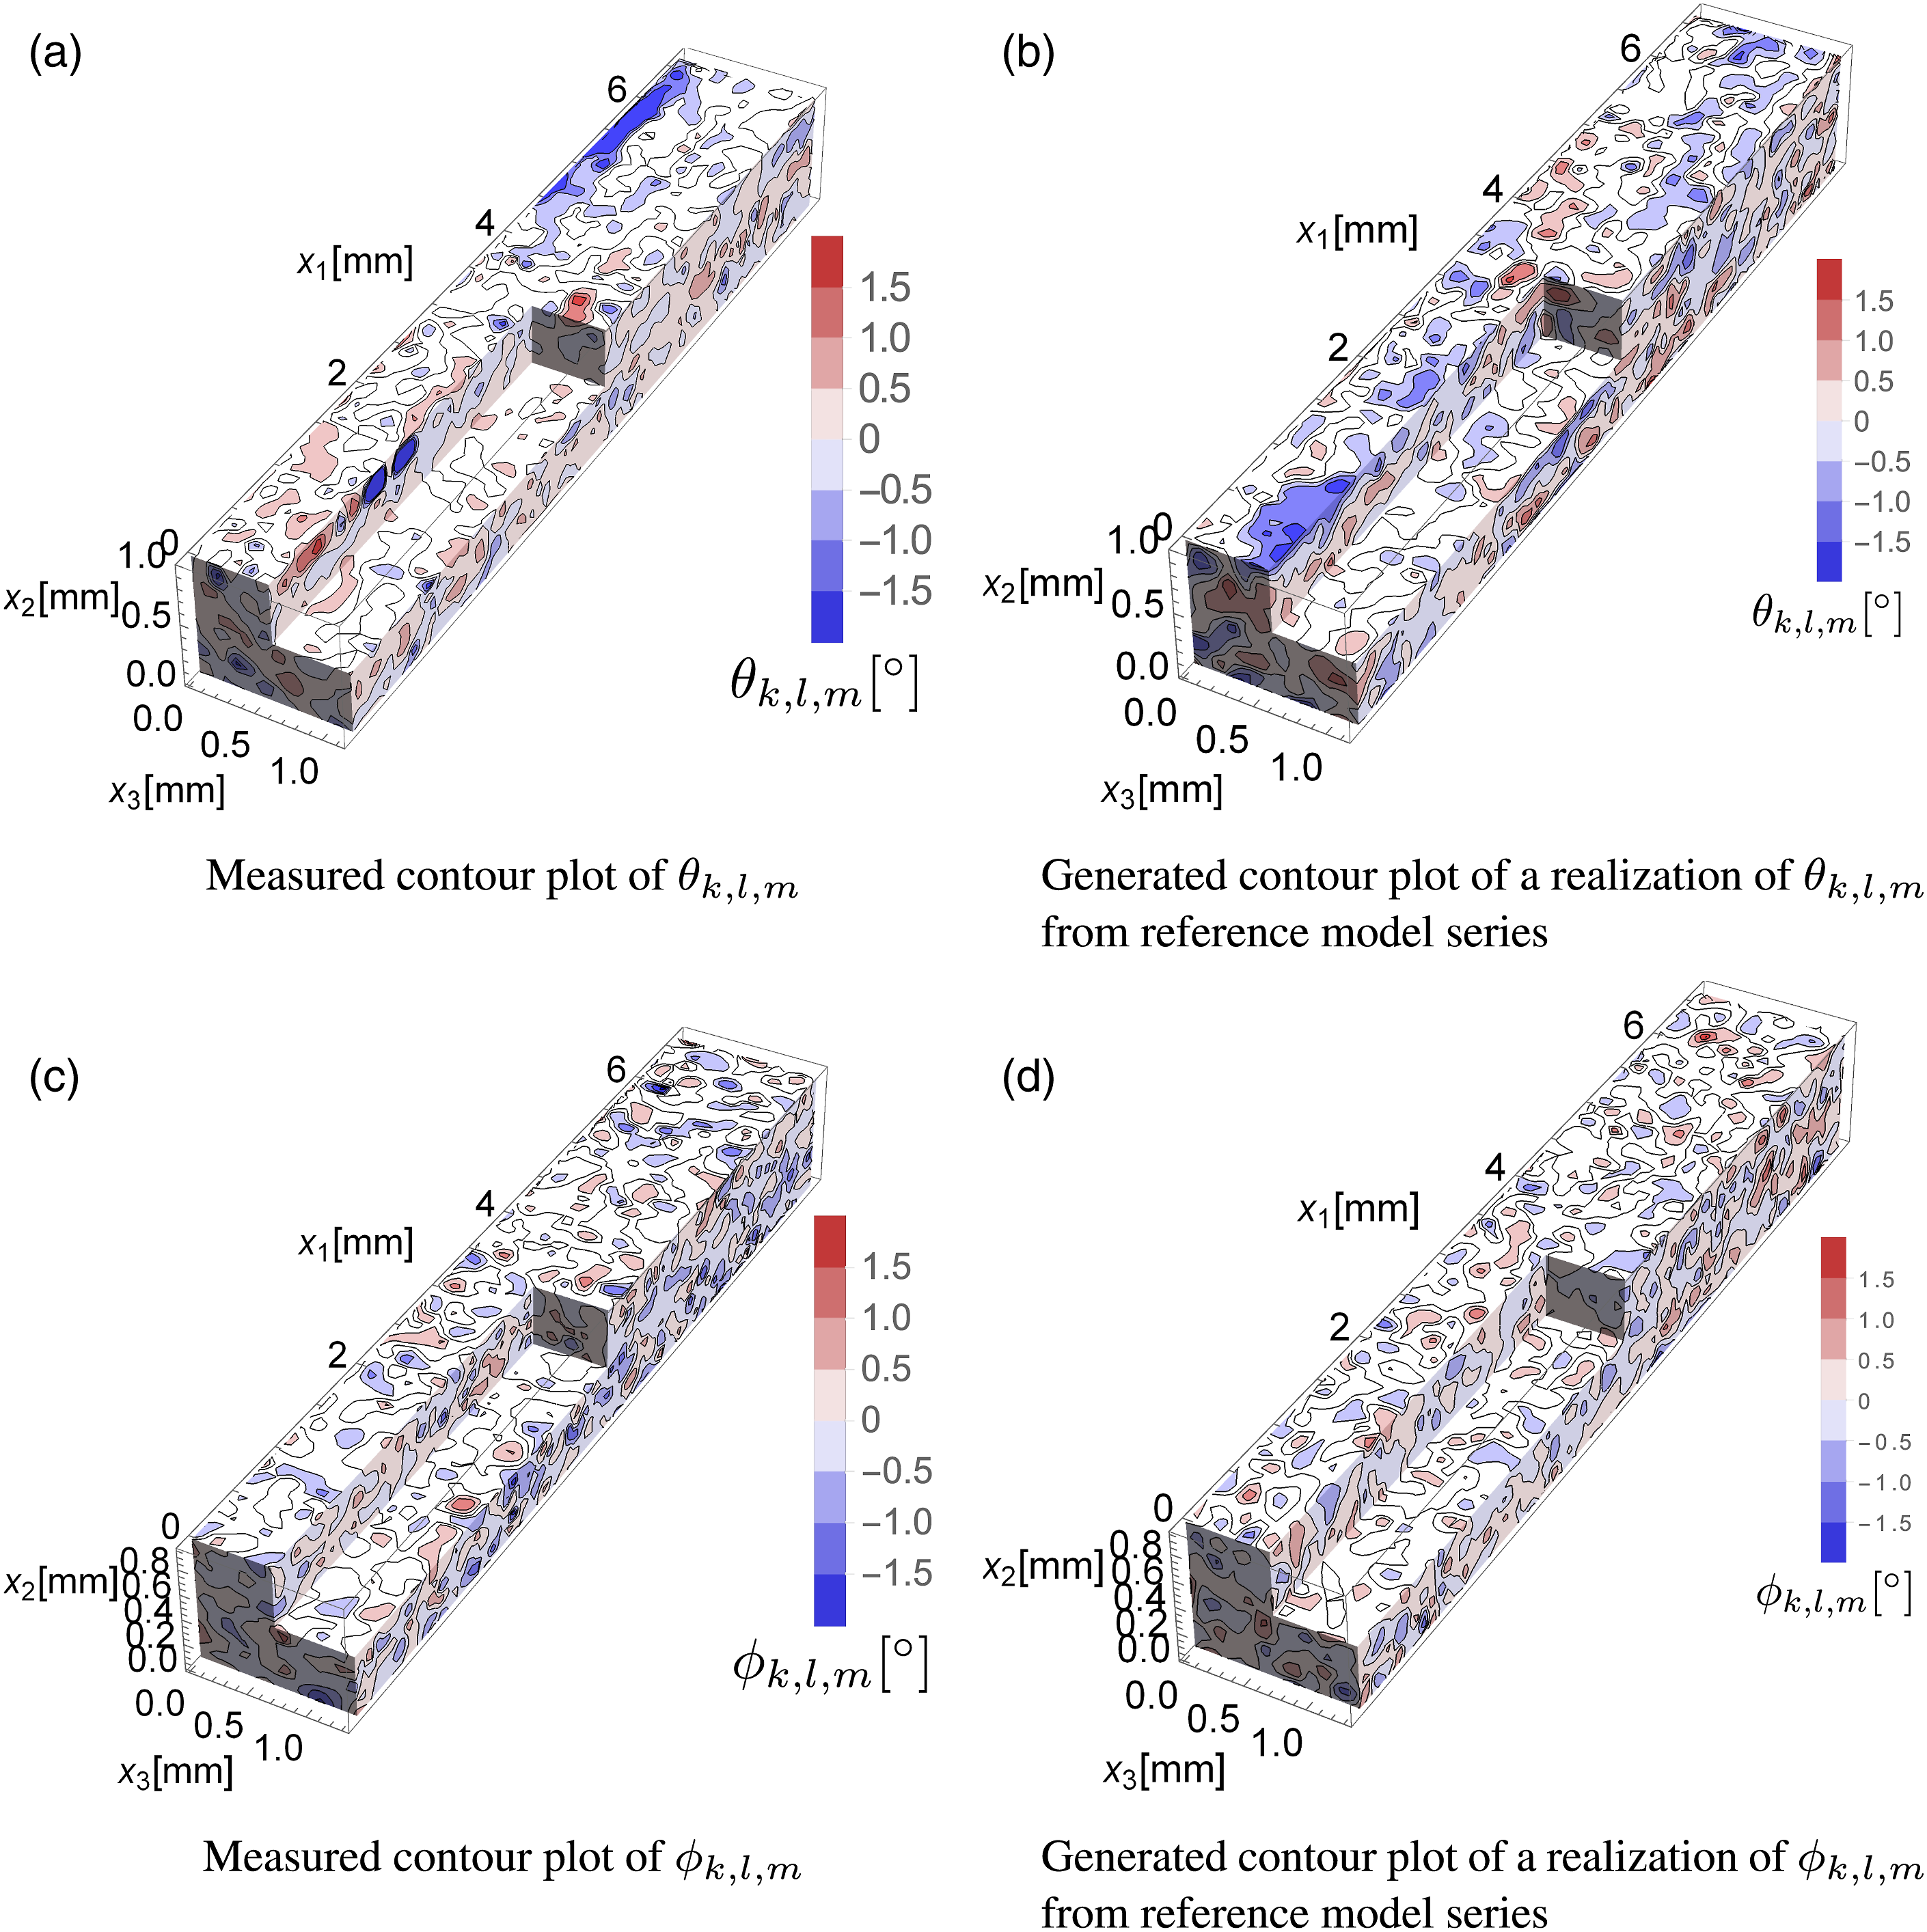
the voxel data obtained from the CT-scans was used to determine both the θ and the ϕ angles. Image processing rendered 70 × 12 × 10 matrices for θk,l,m and ϕk,l,m over a volume of 6.657 × 1.1412 × 0.951 mm from each specimen. Subsequently, a discrete Fourier transformation rendered matrices of 70 × 12 × 10 for the corresponding spectral densities Sketch of a cuboid volume selected from a scanned cylindrical volume. The cylindrical scanned volume was obtained over a cuboid shape [0]4 unidirectional FRP laminate by performing a CT scan. Measured and virtually generated 3D contour plots of the in-plane θk,l,m and the out-of-plane ϕk,l,m misalignment angles from the reference model series. The reference model series was based on measured misalignment distributions using CT scans. Average mean square spectral densities and standard deviations of fiber misalignment angles obtained from CT measurements.
43
In an earlier numerical contribution by the authors, which can be found in Ref.
43
, the spectral representation method was extended to 3D. Using the extended spectral representation method with input of discrete matrices of spectral densities
Idealized topologies
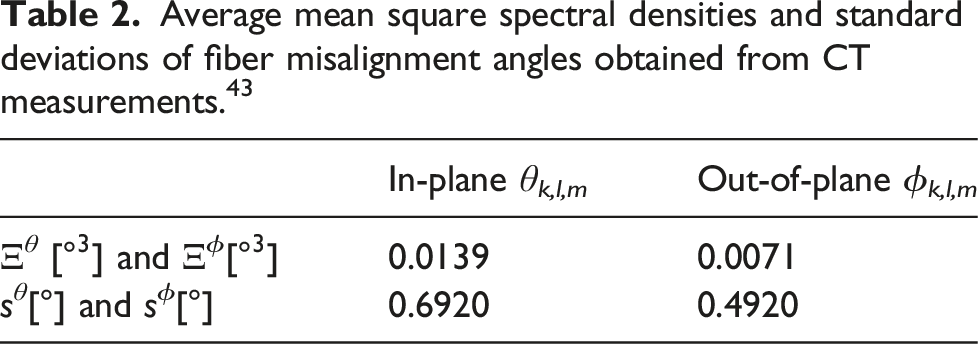
In order to analyze the effect of the fiber misalignment dimensionality on the strength prediction, a comparative analysis using simple 2D and 3D models containing only single sinusoidal undulation are considered here. Four models, two in 2D with 4 × 2 mm in dimension and two in 3D with 4 × 2 × 2 mm in dimension, were generated in the preliminary series for the purpose of comparing the effect of the underlying undulation dimensionality on the compression strength prediction. The first 2D model contains a half period of a sine wave undulation, in which the undulation is variable in only 1-direction. This model corresponds to the infinite band assumption and may be regarded as a 1D-misalignment topology, i.e. of dimensionality 1. The resulting contour plot of the undulation is shown in Figure 4(a). The second 2D model contains an undulation with two dimensional sine waves, i.e. the dimensionality of the misalignment is now increased to 2. The resulting contour plot of the undulation is shown in Figure 4(b). Contour plots of 1D and 2D sine waves for 2D modeling, and 2D and 3D sine waves for 3D modeling of the in-plane misalignment angle θ. The maximum misalignment in each case is 2.5° and the minimum misalignment in each case is −2.5°.
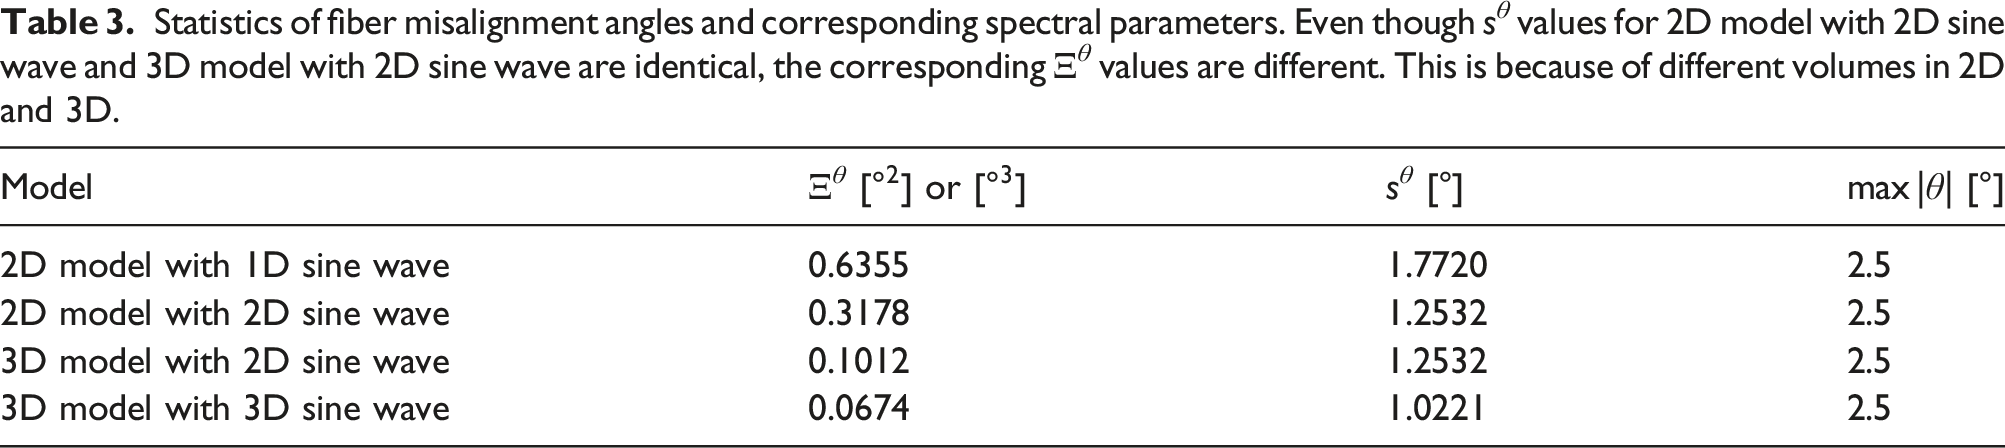
Statistics of fiber misalignment angles and corresponding spectral parameters. Even though s θ values for 2D model with 2D sine wave and 3D model with 2D sine wave are identical, the corresponding Ξ θ values are different. This is because of different volumes in 2D and 3D.
Generated equivalent topologies
Previous authors considered the idea of a functional form of the spectral density for generating virtual distributions of fiber misalignment. Herein, the previous assumptions applied to 1D by Slaughter et al. 36 and 2D by Liu et al. 40 are extended to 3D. Moreover, further aspects of such an assumption for the spectral density are explored.
Spectral density functions
Two forms of spectral densities were considered for generating both θk,l,m and ϕk,l,m distributions namely, the square function S
square
given in equation (3) and the exponential function S
exp
given in equation (4).
where ωc1, ωc2, and ωc2 are the cutoff frequencies in direction 1, 2, and 3, respectively. The mean square values Ξ
θ
and Ξ
ϕ
of the spectral densities were used for comparing S
square
and S
exp
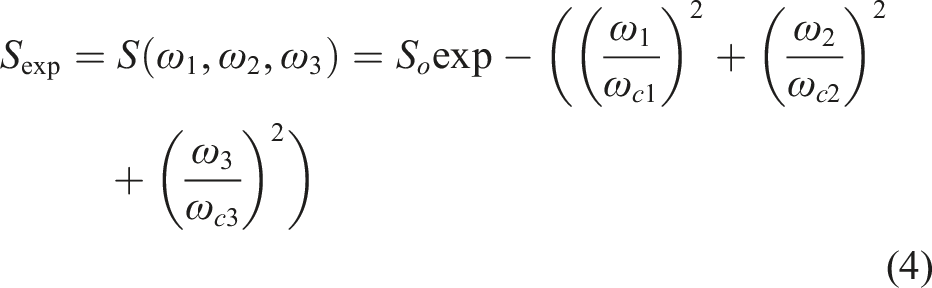
based models with each other, and the subsequent comparison with the reference model driven from the CT measurements of the fiber misalignment. A section of the spectral density functions in plane ω1/ω2 with ω3=0 and anisotropic cutoff values of the frequencies, i.e. where ωc1 was not equal to ωc2, are illustrated in Figure 5. The difference between the square and the exponential forms of the spectral density can be observed in Figure 5(a) and (b). The square form gives an equal weightage to all the underlying frequencies-ω (wavelengths - λ) in the virtually generated distributions of the fiber misalignment derived from this functional form. On the other hand, the exponential form of spectral density gives a higher weightage to smaller frequencies (larger wavelengths) in virtually generated distributions of the misalignment which is closer to the experimentally observed spectral densities, see.
43
Plots of assumed functional forms of spectral densities. The figures show spectral densities in plane ω1/ω2 with anisotropic cutoff values of the frequencies i.e. ωc1 not equal to ωc2. The cutoff frequencies ωc1 and ωc2 as well as the initial value of spectral density S
o
are also marked in the figures. In these figures ω3 = 0, and is disregarded to allow 3D plots.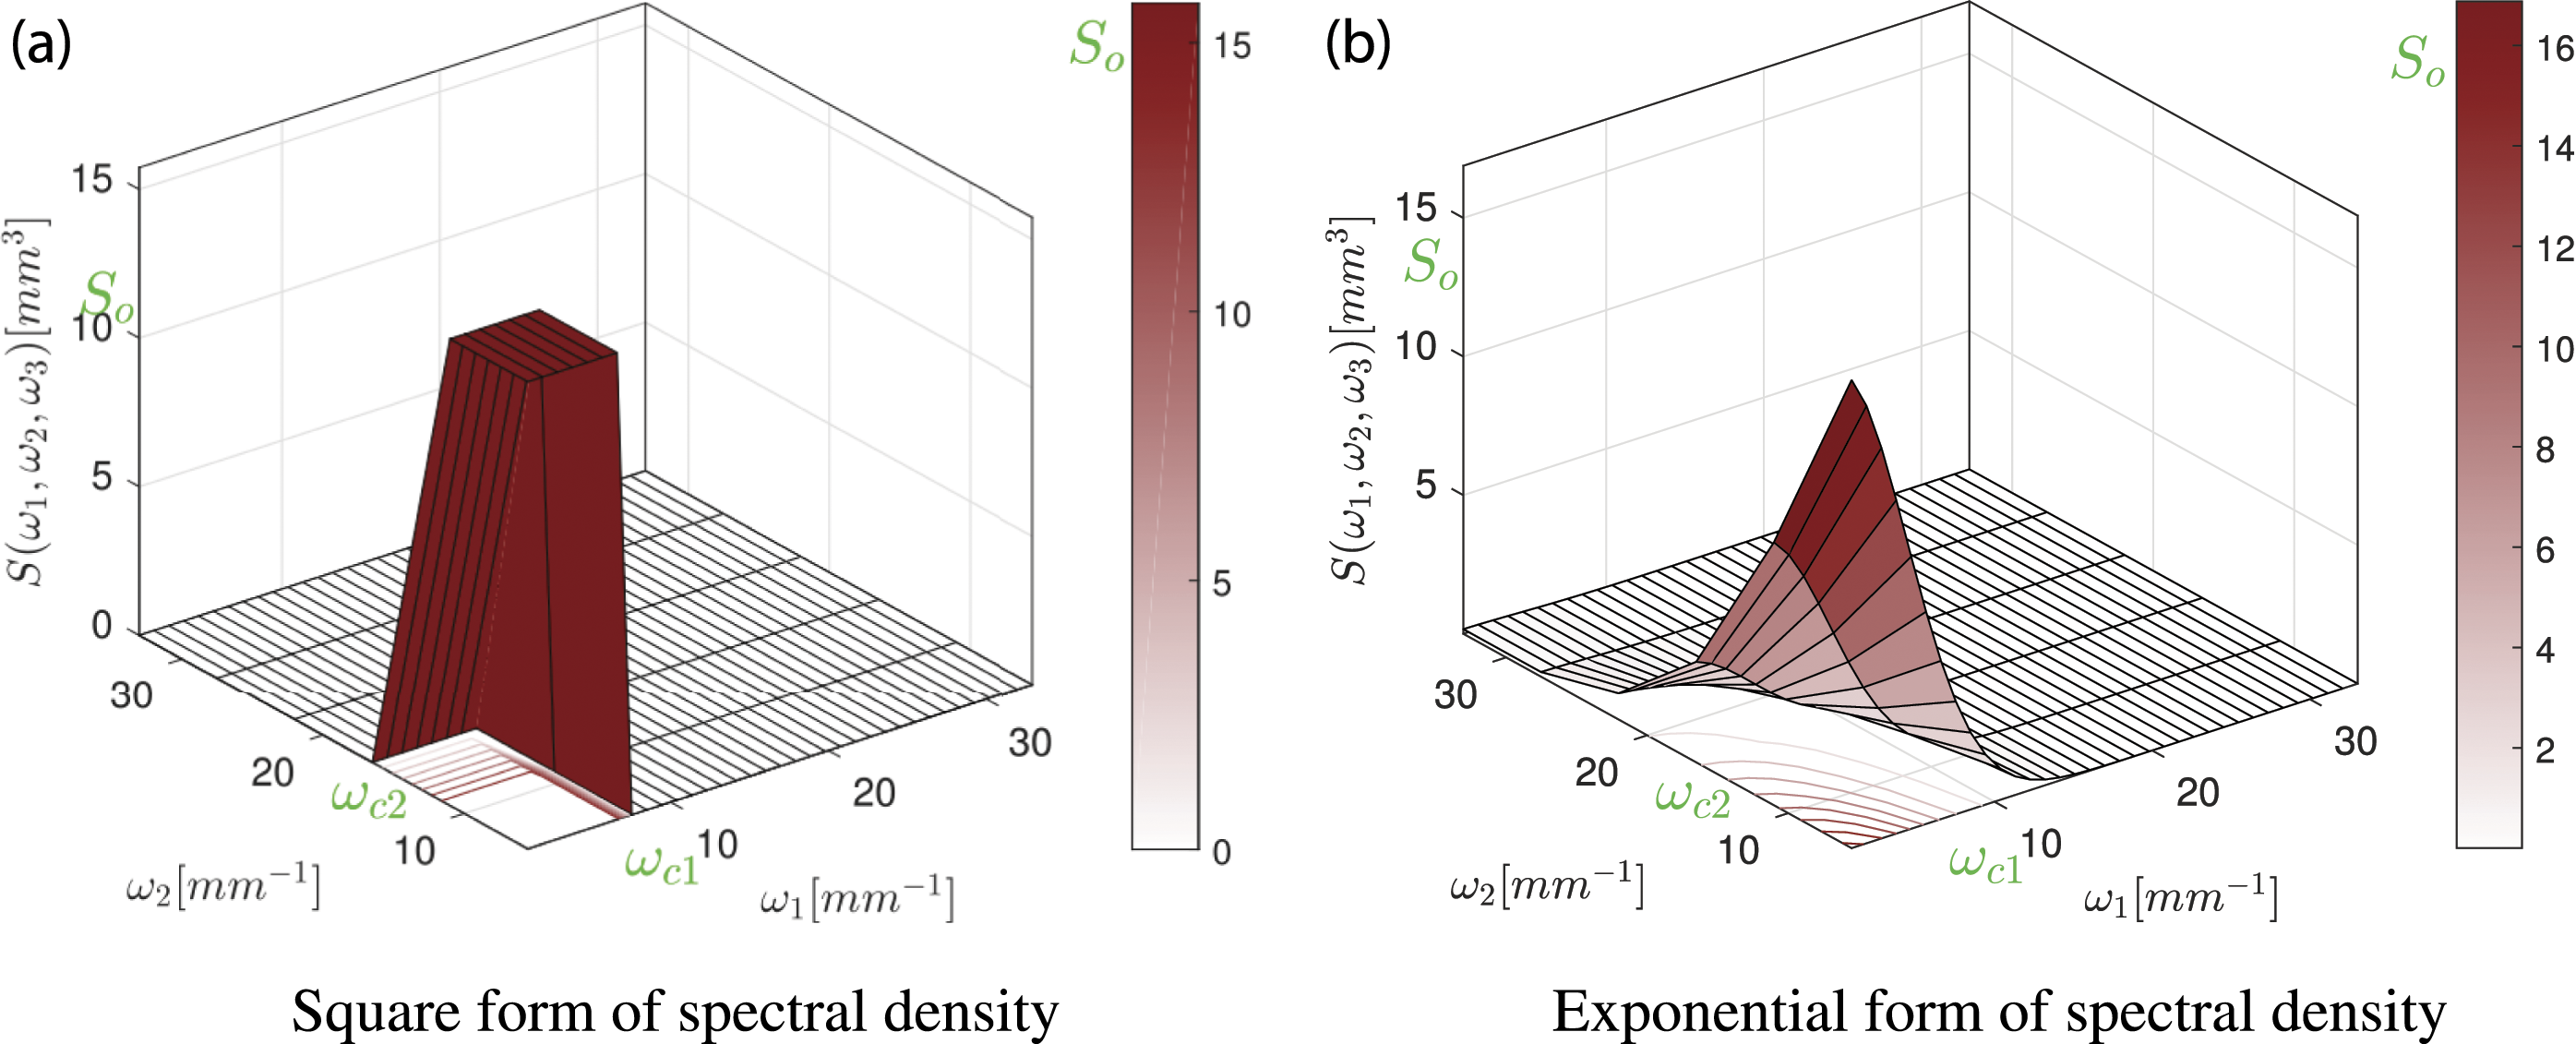
Resultant topologies
In order to understand the effects of the parameters as well as the shape of the assumed spectral density on the prediction of the compression strength, different virtual distribution of the in-plane misalignment θ k,l,m and the out-of-plane misalignment ϕk,l,m were generated. The dimensions of the models were kept the same as the reference model i.e. 6.657 × 1.1412 × 0.951 mm with equal discretization of 0.0951 mm in each direction.
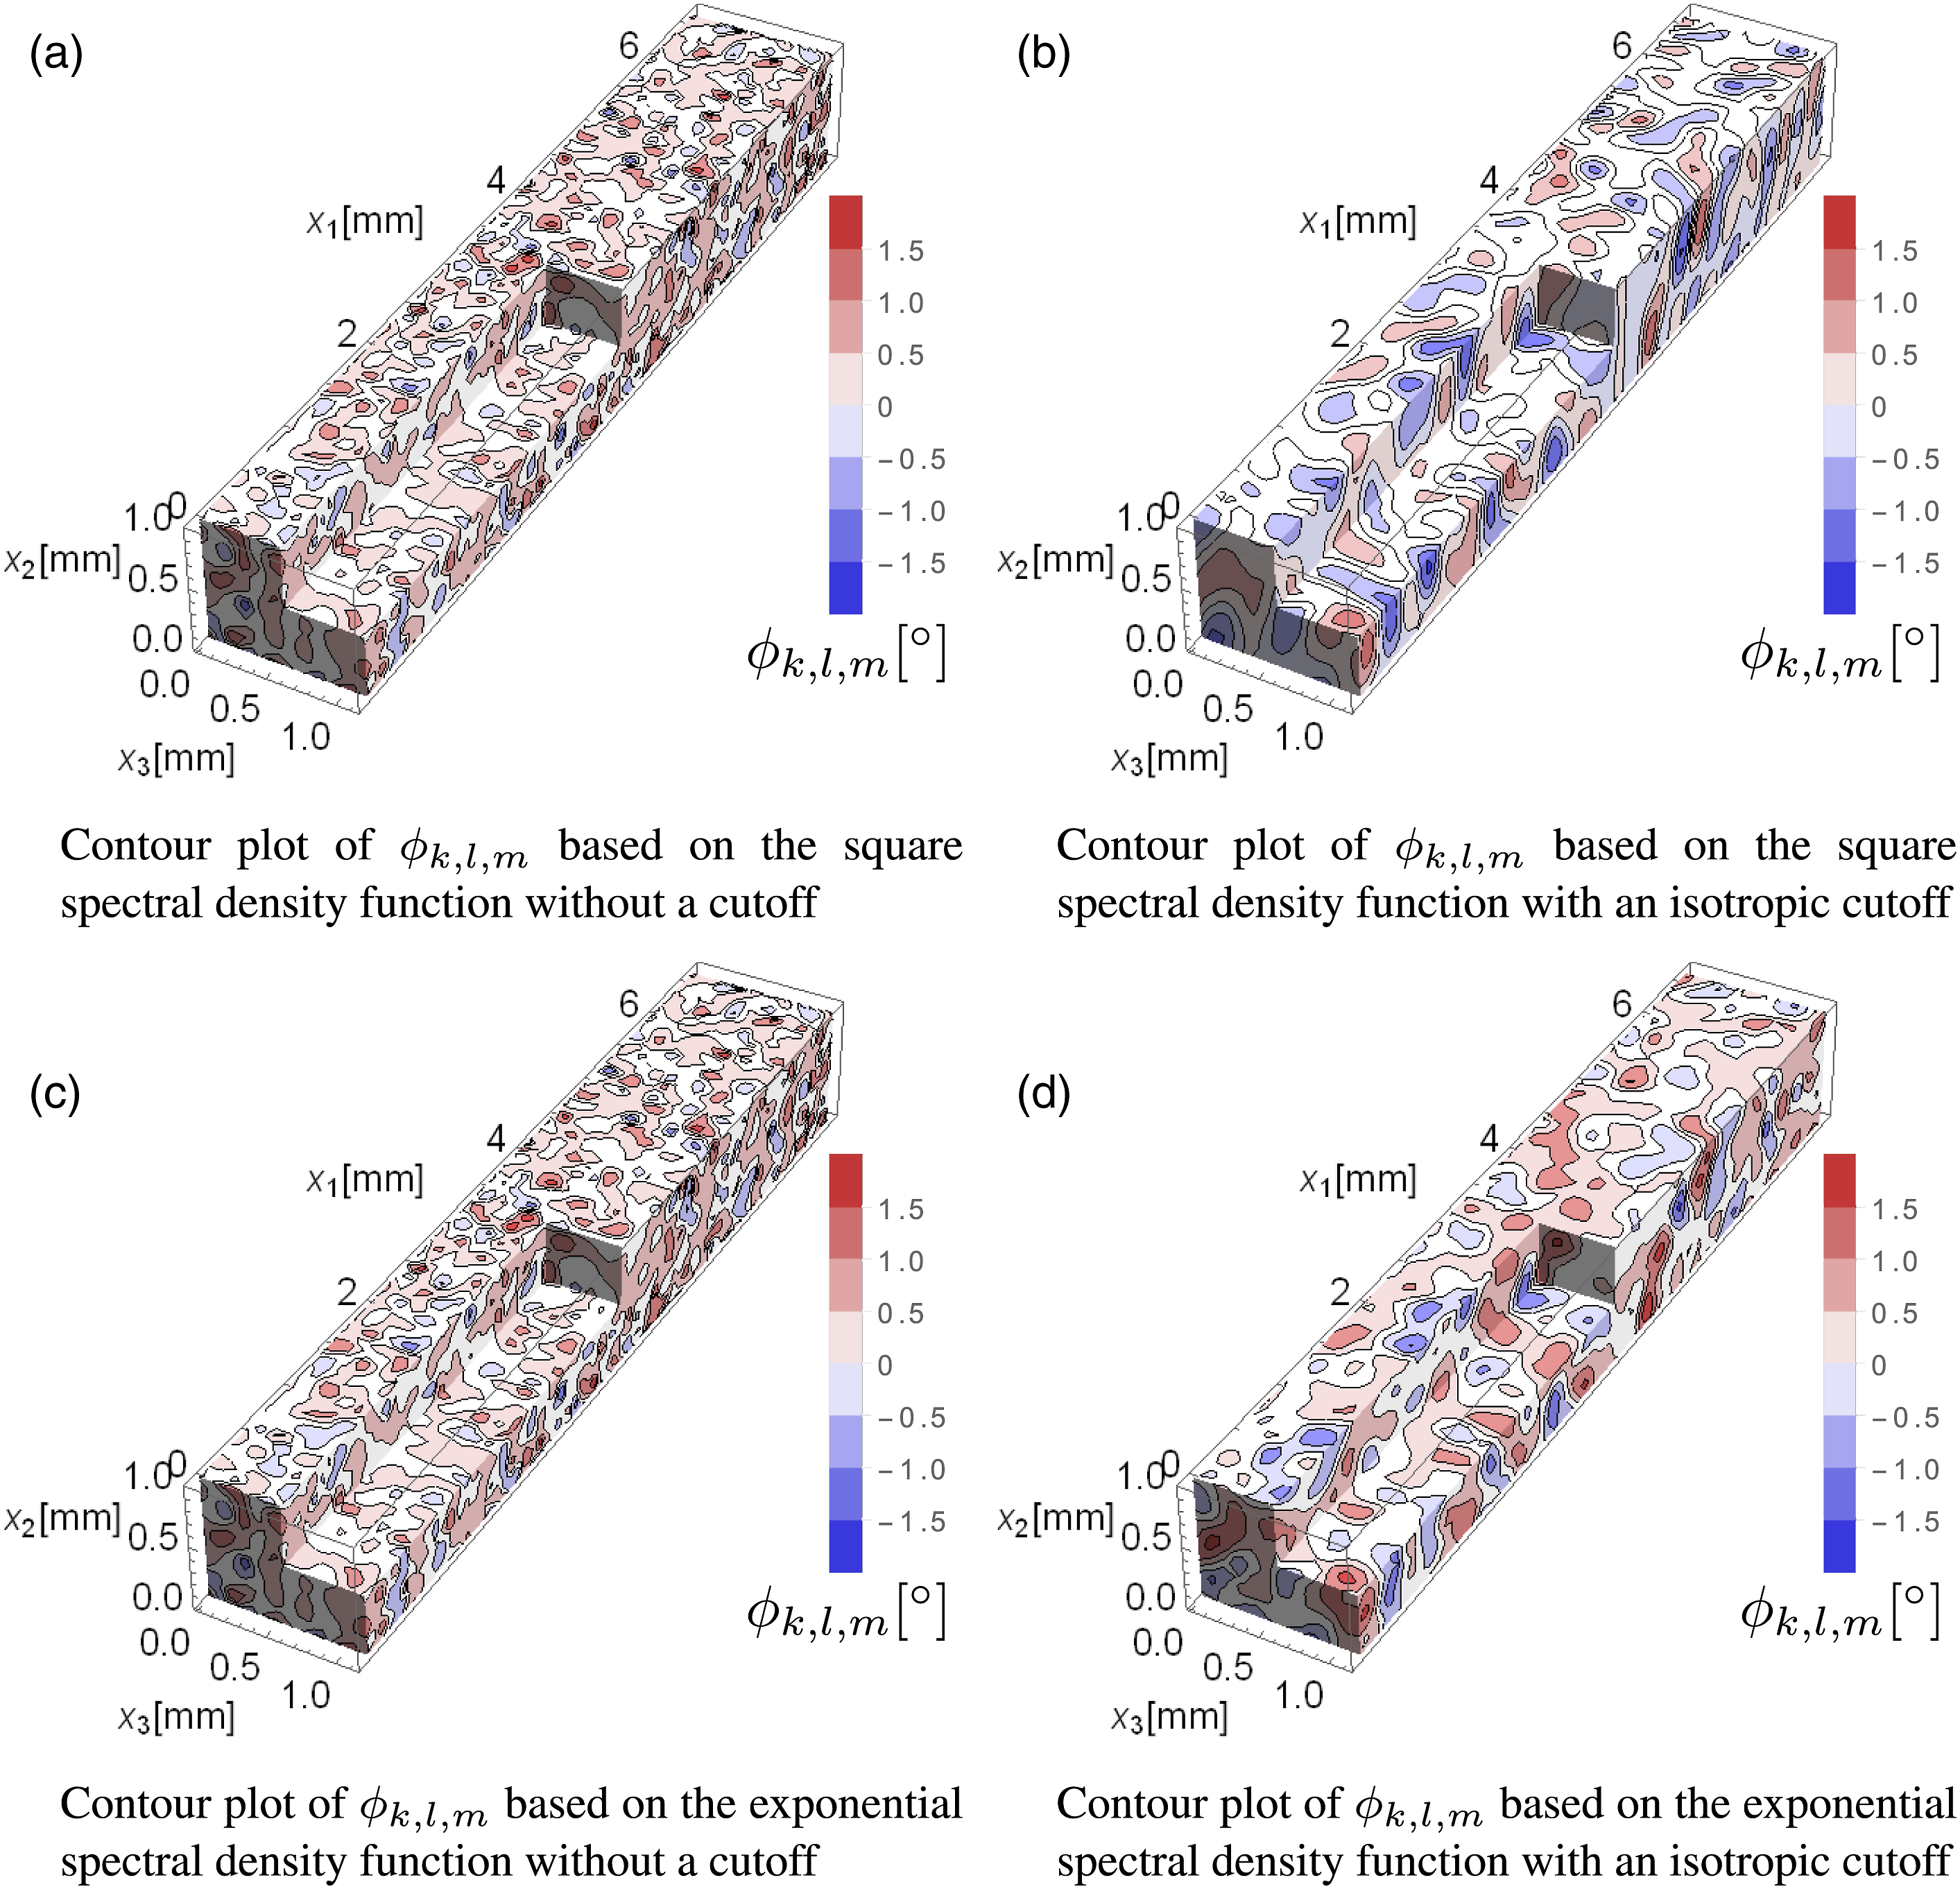
The virtual distributions of the misalignment for θk,l,m and ϕk,l,m were generated by scaling the functional forms of spectral densities in such a way that the mean square spectral densities Ξ
θ
and Ξ
ϕ
for each misalignment correspond to the experimentally measured value given in Table 2. The functional forms of spectral densities were scaled by the parameter S
o
, called the initial spectral density. The first model series considered no cutoff frequency which implies that the model contained all possible frequencies from fundamental frequency (largest wavelength) to the Nyquist frequency (smallest wavelength) in each direction. Figure 6(a) and (c) show 3D contour plots of θk,l,m for a realization each using square and exponential forms of the spectral density without a cutoff frequency, respectively. Similarly, contour plots ofϕk,l,m for a realization each are shown in Figure 7(a) and (c) using square and exponential forms of spectral density, respectively. It can be seen that without using a reasonable cutoff in the discrete sampling of the spectral density, the resulting virtual distributions of the misalignment show an unreasonable noise in the pattern which is unlike the experimentally measured distributions and subsequent reference model distributions shown in Figure 3. The noise in the pattern results in much smaller regions of misalignment compared to the measured and virtually generated 3D reference topologies shown in Figure 3. This is due to the effect of very small wavelengths contributing to the pattern of the virtually generated distributions. Virtually generated 3D contour plots of the in-plane misalignment angle θk,l,m using functional forms of the spectral density as an input. The spectral representation method was used for the generation of virtual distributions of misalignment angles. Although contour plots based on S
square
and Sexp without a cutoff appear quite similar, the underlying wave behavior is different. These differences lead to differences in the prediction of compression strength distributions. Virtually generated 3D contour plots of the in-plane misalignment angle ϕk,l,m using functional forms of the spectral density as an input. The spectral representation method was used for the generation of virtual distributions of the misalignment angles.
To improve on the distributions generated using functional forms of spectral density without a cutoff, a second model series with certain cutoffs was considered. For this purpose, cutoff frequencies of ωc1=6.28 (corresponding to
Model geometry
Different series of models were considered in the current investigation. A first preliminary series is used for investigating the effect of misalignment dimensionality on the compression strength. It comprises 2D plane stress models with 4 × 2 mm in dimension and 3D models in the form of cuboids of 4 × 2 × 2 mm in dimension, each containing simple sinusoidal undulation. These dimensions are chosen for sake of simplicity as the purpose of first series is comparison of 2D vs 3D modeling. The second series of models are intended for performing probabilistic analyses under axial compression load. The probabilistic series comprise reference models whose topology is based on experimental measurements of misalignment, see reference topologies section. It also contains models which are based on functional forms of spectral densities, see generated topologies section. All models of the probabilistic series are in 3D in the form of cuboids, representing a region of a unidirectional FRP [0]4-laminate. Figure 8 illustrates the schematic of the 3D FE model geometry from the probabilistic series. The geometry of models from the preliminary series is similar. Nominal fiber direction was parallel to the 1-axis. The 2 and the 3-directions were the in-plane and the out-of-plane transverse directions, respectively. The FE model dimensions and the discretization were kept same as the volumetric dimensions and the discretization of the virtually generated topologies presented in misalignment topologies section. The nominal dimensions of the FE models for the probabilistic series were 6.657 × 1.1412 × 0.951 mm in 1-2-3 directions, respectively. Schematic of the FE model geometry used for the probabilistic series. (a) depicts a [0]4 laminate with large in-plane dimensions compared to the thickness in 3-direction. The laminate was stacked in direction 3. The laminate consists of representative volumes which are periodic in directions 1 and 2. One such volume is marked in dark blue color. (b) illustrate the geometry of the representative volume used in numerical modeling. The contour of an in-plane distribution of the fiber misalignment angles is plotted on the back planes of the cuboid shaped volume. The direction 1 is the nominal fiber direction, and 2 and 3 are the in-plane and the out-of-plane transverse directions, respectively. The FE mesh is shown with the grid on the back planes of the cuboid with blue lines.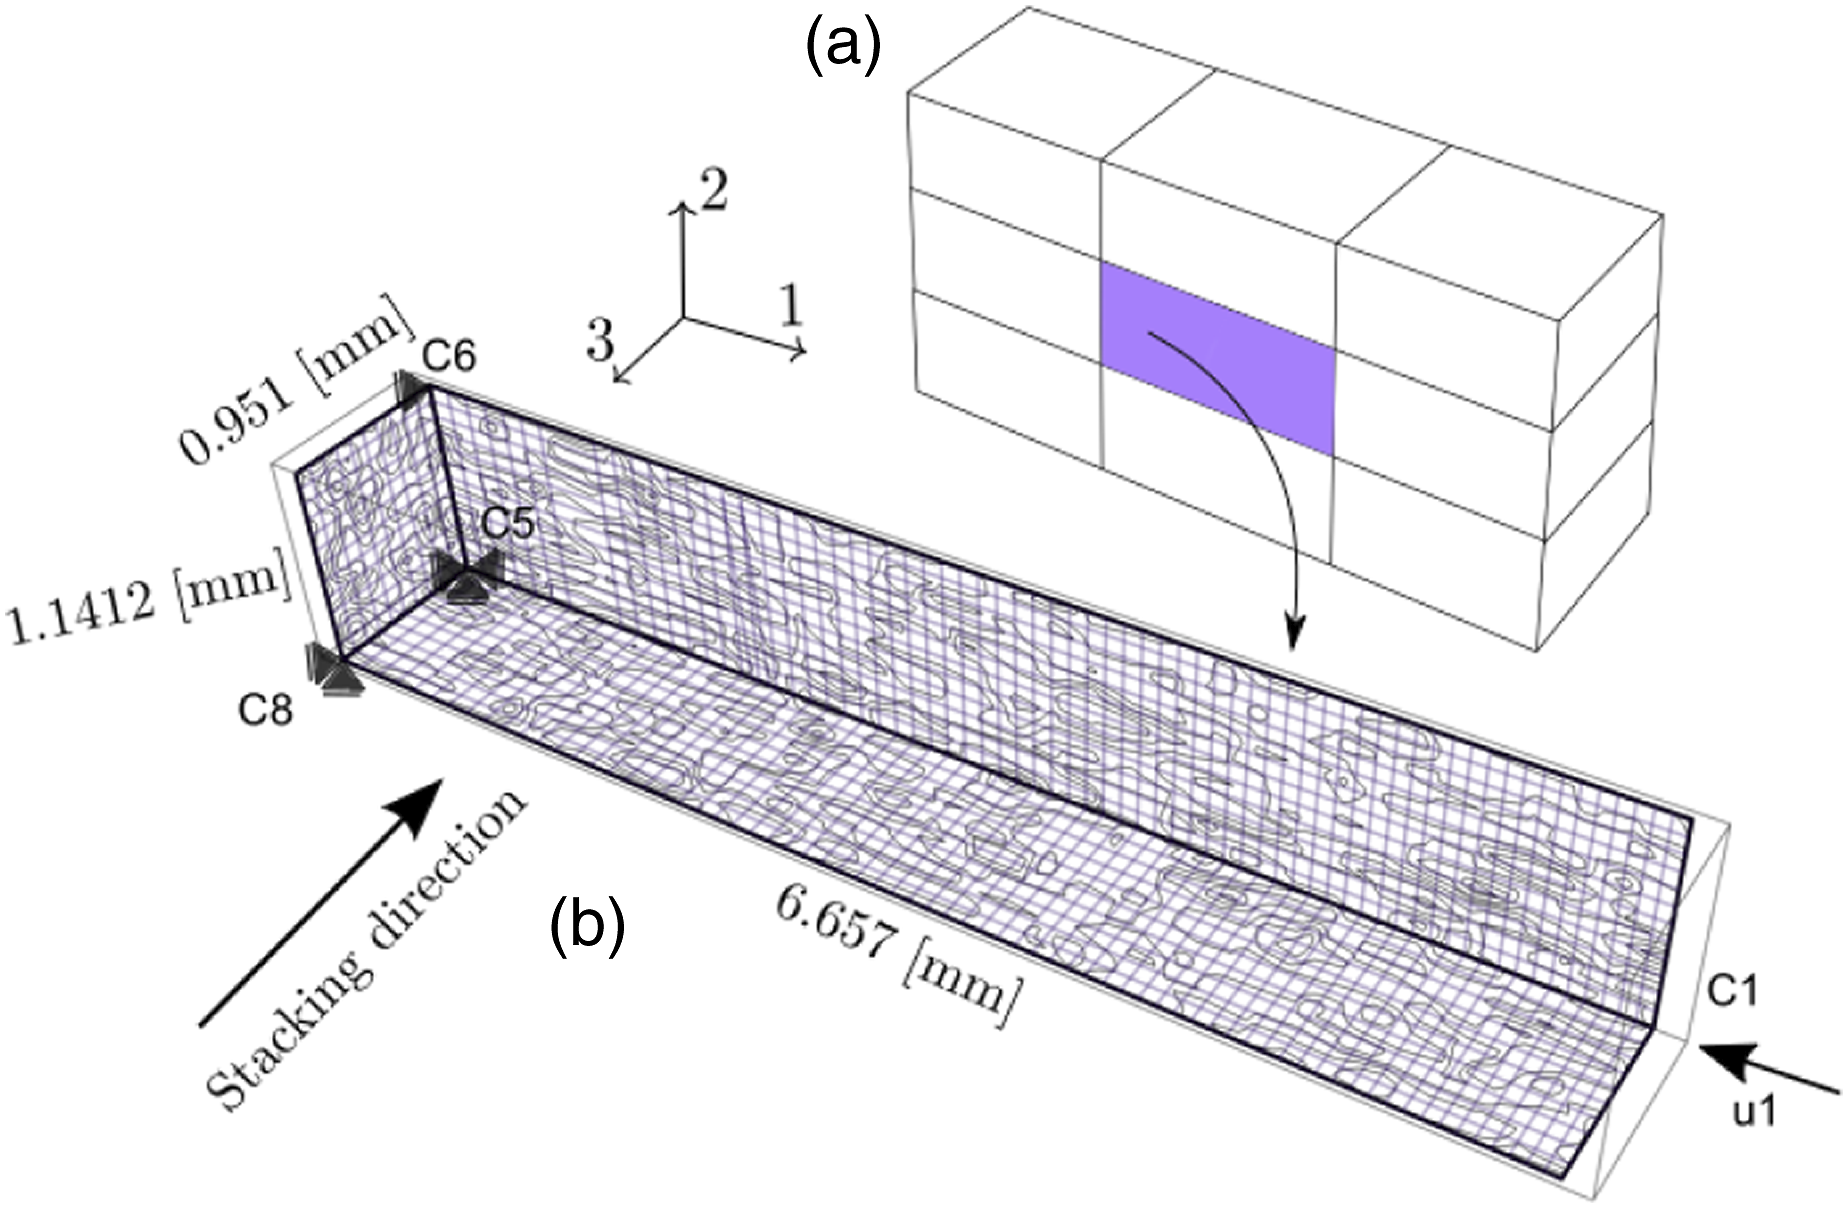
3D models were meshed using cubic three dimensional fully integrated 20 node C3D20 elements in the commercial software Abaqus 2016, whereas 2D models were meshed using 8 node CPS8 plane stress elements. The resulting mesh for the preliminary series of models comprised 40 × 20 square elements of 0.1 mm edge length and 40 × 20 × 20 cubic elements with 0.1 mm edge length for 2D and 3D models, respectively. The resulting mesh for the probabilistic series comprised 70 × 12× 10 cubic elements with 0.0951 mm edge length, each. The distributions of the fiber misalignment generated using the spectral representation method were mapped onto the integration points of each element of the corresponding mesh as the material orientations. This was achieved by defining a local coordinate system for each finite element. The local coordinate systems were defined in such a way that they were rotated in-plane and out-of-plane from the global coordinate system by the corresponding values of misalignment angles at those spatial locations. A script written in Python Scripting Interface of Abaqus was used for this purpose.
Periodic boundary conditions were applied in directions 1 and 2 for the preliminary series of 2D and 3D models, whereas plane stress condition was applied on 3D models of the preliminary series in direction 3 for a direct comparison with 2D models. This was achieved by applying multi point constraints (MPC) on surfaces in direction 3 of the 3D models of the preliminary series using the method employed by Ref. 49 As the model schematic in Figure 8 shows, the FE model the probabilistic series represents a section of a large plate extending in directions 1 and 2. The model thickness is same as the laminate, hence, there is no periodicity in direction 3. Therefore, the 3D FE models of the probabilistic series were representative of a cutout region from a unidirectional FRP laminate based panel with same thickness but larger in-plane dimensions, hence, periodic boundary conditions were used in directions 1 and 2 only. Both the surfaces perpendicular to direction 3 for the probabilistic series had traction free boundary conditions. To suppress rigid body motions in 3D models of both series corner node C5 was constrained in all directions and corner node, C8 and C6 were fixed in both transverse directions and in-plane transverse direction, respectively. Constraints and loads on 2D models were applied in a similar fashion. The axial compression load was applied in the form of displacements u1 at the corner node C1. Node C1 was coupled to the whole of the right surface/edge, therefore, the load applied on node C1 got transferred to whole of the right surface/edge. Since the surfaces/edges in direction 1 were periodic, the coupling of node C1 with the right surface/edge ensured the periodic application of load on the right and left surfaces/edges. Additionally, node C1 was constrained in transverse directions 2 and 3.
It is well established in the literature that MB is the failure mode under axial compression load for unidirectional FRPs. The global response of the model until the MB-failure is approximately linear. Locally at the location of the critical fiber misalignment, there is significant matrxi hardening before MB failure. When the geometric softening of the material due to compression load outpaces the materix hardening at a local location, the material fails in an unstable manner with a snap-back response. The failure is defined as the point after which the material suddenly sees a drastic reduction in the global load carrying capacity. Thus, the failure point of the model was defined as the peak load. Since the peak load is of interest, the analyses were terminated when reaction force RF1 in the direction 1 at the control node C1 dropped by 5% from the peak load with the help of URDFIL user subroutine of Abaqus 50 in order to speed up. Moreover, the solution procedure was performed in two load steps for higher efficiency. The 1st step up to approximately 40% of the expected mean failure strain was solved with larger sub-steps as the response was linear in this range. Both the implicit dynamic and the arc-length based Riks′ solver gave the same prediction up to peak load. The major advantage of the arc-length method is the prediction of the snap-back response, which is out of scope of the current work. The arc-length method tends to suffer from convergence problems whereas the implicit dynamic solver is more reliable and shows reliable convergence past the peak load. With the implicit dynamic method, there was the added advantage of easier post processing because the reaction force RF1 and displacement u1 from multiple steps could be extracted simultaneously, which was not possible in the Riks′ arc-length method in Abaqus. Therefore, the implicit dynamic solver was deemed a better choice for probabilistic simulations. Hence, the geometrically non-linear dynamic implicit solver with quasi static load application was employed. By using the quasi static application of load in Abaqus, it was ensured that the static analysis does not get any effect of the inertial forces. The quasi static condition was guaranteed by the observation of negligible values of the kinetic energy over the complete solution until peak load.
Engineering definitions of (small) strains ɛ and stresses σ are used in this work. Since the displacement load u1 was applied at the reference node C1, far field strain was defined as the displacement of control node C1 divided by the initial length in the nominal fiber direction L1 i.e. ɛ11=u1/L1. The length L1= 4 mm for models of first group whereas the length L1= 6.657 mm for the model series used in the second group. To calculate percentage strains, they were multiplied by the factor 100. Similarly, far field stresses were calculated from reaction forces RF1 at the node C1 divided by the initial cross sectional area perpendicular to the nominal fiber direction A1 i.e. σ11=|RF1|/A1. Compression stresses were defined positive in this work. The area A1=2 × 1 and 4 × 2 mm2 for 2D and 3D models of the preliminary series, respectively. The area A1=1.1412 × 0.951 mm2 for the models of probabilistic series. For the sake of brevity, the peak load for the axial compression load case was given a special symbol i.e., σ c : = max(σ11).
Results and discussions
Effect of the misalignment dimensionality on the compression strength prediction
Four models were considered in the preliminary series in order to analyze the effect of the fiber misalignment dimensionality on the strength prediction, see Figure 4. The resulting far field stress-strain behavior of all four models is plotted in Figure 9. Strength prediction using the Budiansky’s analytical model given in equation (1) depends on a single misalignment angle ψ. Moreover, equation (1) is consistent with the so-called infinite band assumption. The angle ψ is frequently identified with the largest misalignment in a given domain, i.e. ψ = 2.5° for the topologies considered in Figure 4. However, it will be shown in the following that this assumption is a simplification and it held only in case of the infinite band topology. Accepting this simplification of ψ for now and solving the maximization problem of equation (1) for ψ = 2.5° along with the consideration of the experimentally characterized nonlinear shear behavior of the material, Budiansky’s model gives a prediction of 721 MPa for compression strength. It is plotted as a dotted line in Figure 9. The result of the 2D model with a 1D misalignment (Figure 4(a)) coincides with the prediction of the analytical model, as it emulates the misalignment assumptions of the analytical model. Counter-intuitively, the 2D model with same maximum and minimum values of the misalignment angle, i.e. 2D model with a 2D undulation shown in Figure 4(b) results in an increase in strength with a value to 1051 MPa. Similarly, the 3D model with an in-plane 2D undulation and in-plane boundary conditions with a value of 1063 MPa shows an equivalent prediction to the 2D model with a 2D undulation. The 3D model with an in-plane 3D undulation and in-plane boundary conditions shows the strongest response among the four models with a strength value of 1326 MPa. The increase in strengths of the models with increasing misalignment dimensionality, albeit with the same absolute value of the maximum angle, can be understood by considering the statistics of the misalignment. The standard deviations s
θ
of the misalignment angle from the models containing higher dimensional undulation are smaller, see Table 3. This is due to the fact that a region with different superposing waves contributing to the misalignment results in a dilution of misalignment in space. In the spatial sense, it means that only a few fibers are misaligned with a bigger portion of relatively straight fibers supporting the misaligned region. Comparison of results from 2D and 3D models of preliminary series, each containing a sinusoidal undulation with 1D, 2D and 3D misalignment characteristics.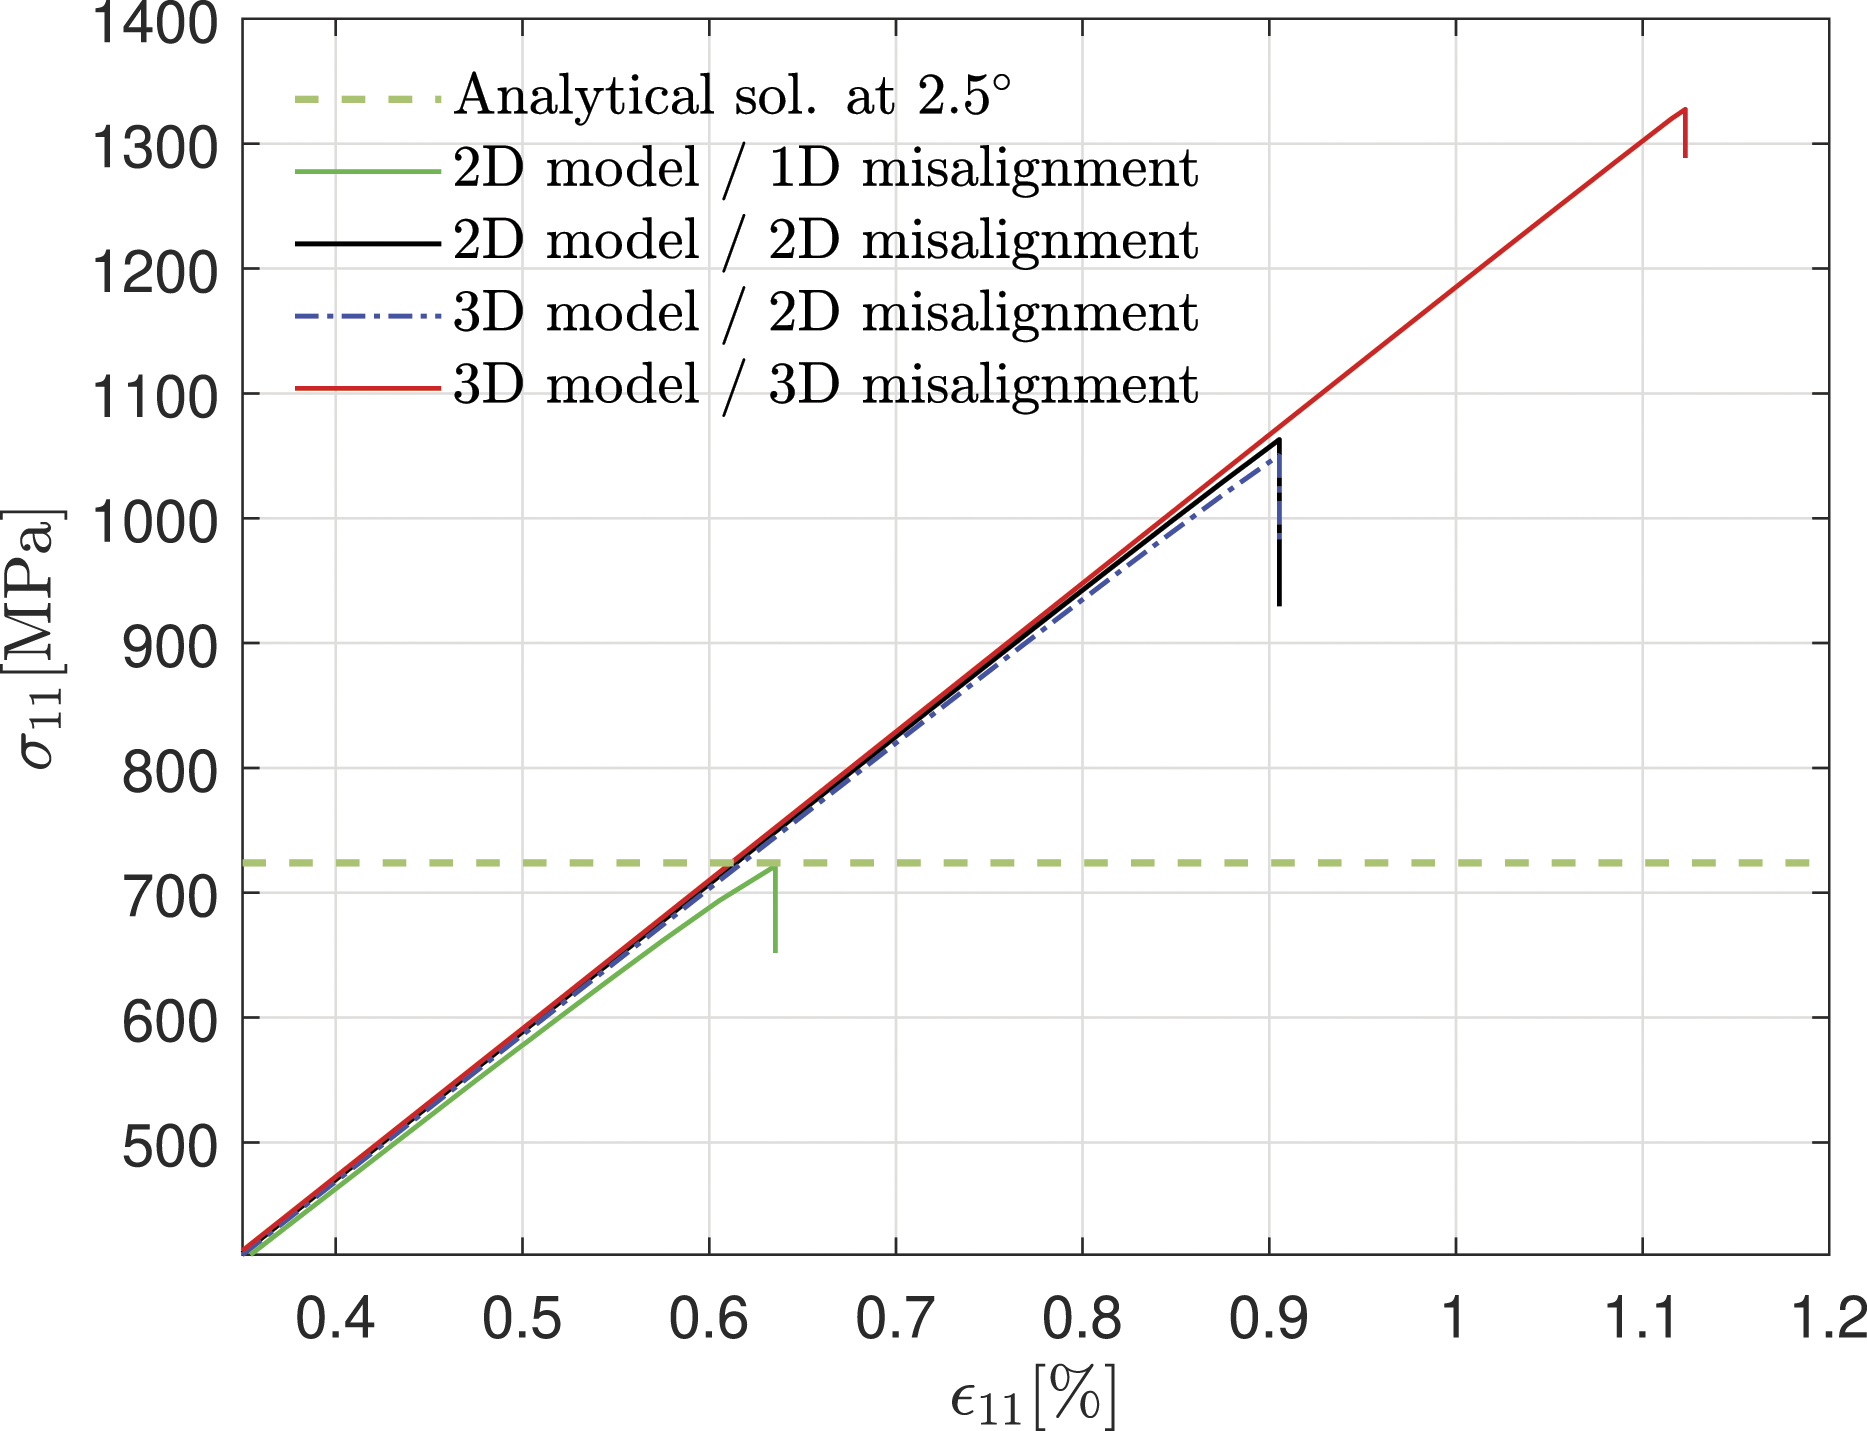
This analysis shows that the use of an absolute maximum value of the misalignment angle alone for the prediction of compression strength has significant drawbacks. The statistics of the misalignment such as the standard deviation of the misalignment angle also need to be taken into account. Moreover, these results highlight the limitations of modeling the misalignment in FRPs in 2D, and point towards the need for realistic modeling. In real composite structures, the misalignment has 3D characteristics and a single angle based representation is inadequate. The 3D misalignment of fibers from a FRP based structure can be modeled using the in-plane θ and the out-of-plane ϕ angles as shown schematically in Figure 1. The measurements of the misalignment angles θk,l,m and ϕk,l,m shown in Figure 3(a) and (c) depict that not only the statistics of the misalignment but also topology needs to be taken into account. The spectral representation method was used to generate such topologies for probabilistic analyses, the results of which will be discussed in the next sections.
Effect of cutoff frequencies on the compression strength prediction
In order to investigate the effect of the cutoff frequencies ωc1, ωc2, and ωc3 on the resulting numerical prediction of the compression strength of models containing realistic representation of the fiber misalignment, 250 realizations of each model from the probabilistic series were simulated. The resulting probabilities of survival of each model based on the functional forms of the spectral densities are plotted in Figure 10. Additionally, the probability of survival of the reference model discussed in reference topologies section, which was based on the spectral densities calculated from the experimental measurements of the fiber misalignment, is also plotted in Figure 10. At a sufficiently low load level, all the realizations survive. As the applied far field load σ11 increases, the proportion of the failed realizations increases. At a sufficiently high value of σ11, all realizations fail giving a P(σ
c
) of 0. The mean and standard deviation values of all the models are provided in Table 4. Empirical probability of survival P(σ
c
) over the compression strength σ
c
for 3D models with cutoff frequencies and 3D models without cutoff frequencies. The survival probability using the reference model is also plotted for comparison. Mean and standard deviation of the compression strength σ
c
from different models of the probabilistic series. In addition, the shape m and scale R
o
parameters for a 2-parameter Weibull distribution are also given as they will be needed for comparison to the experimental results in later sections.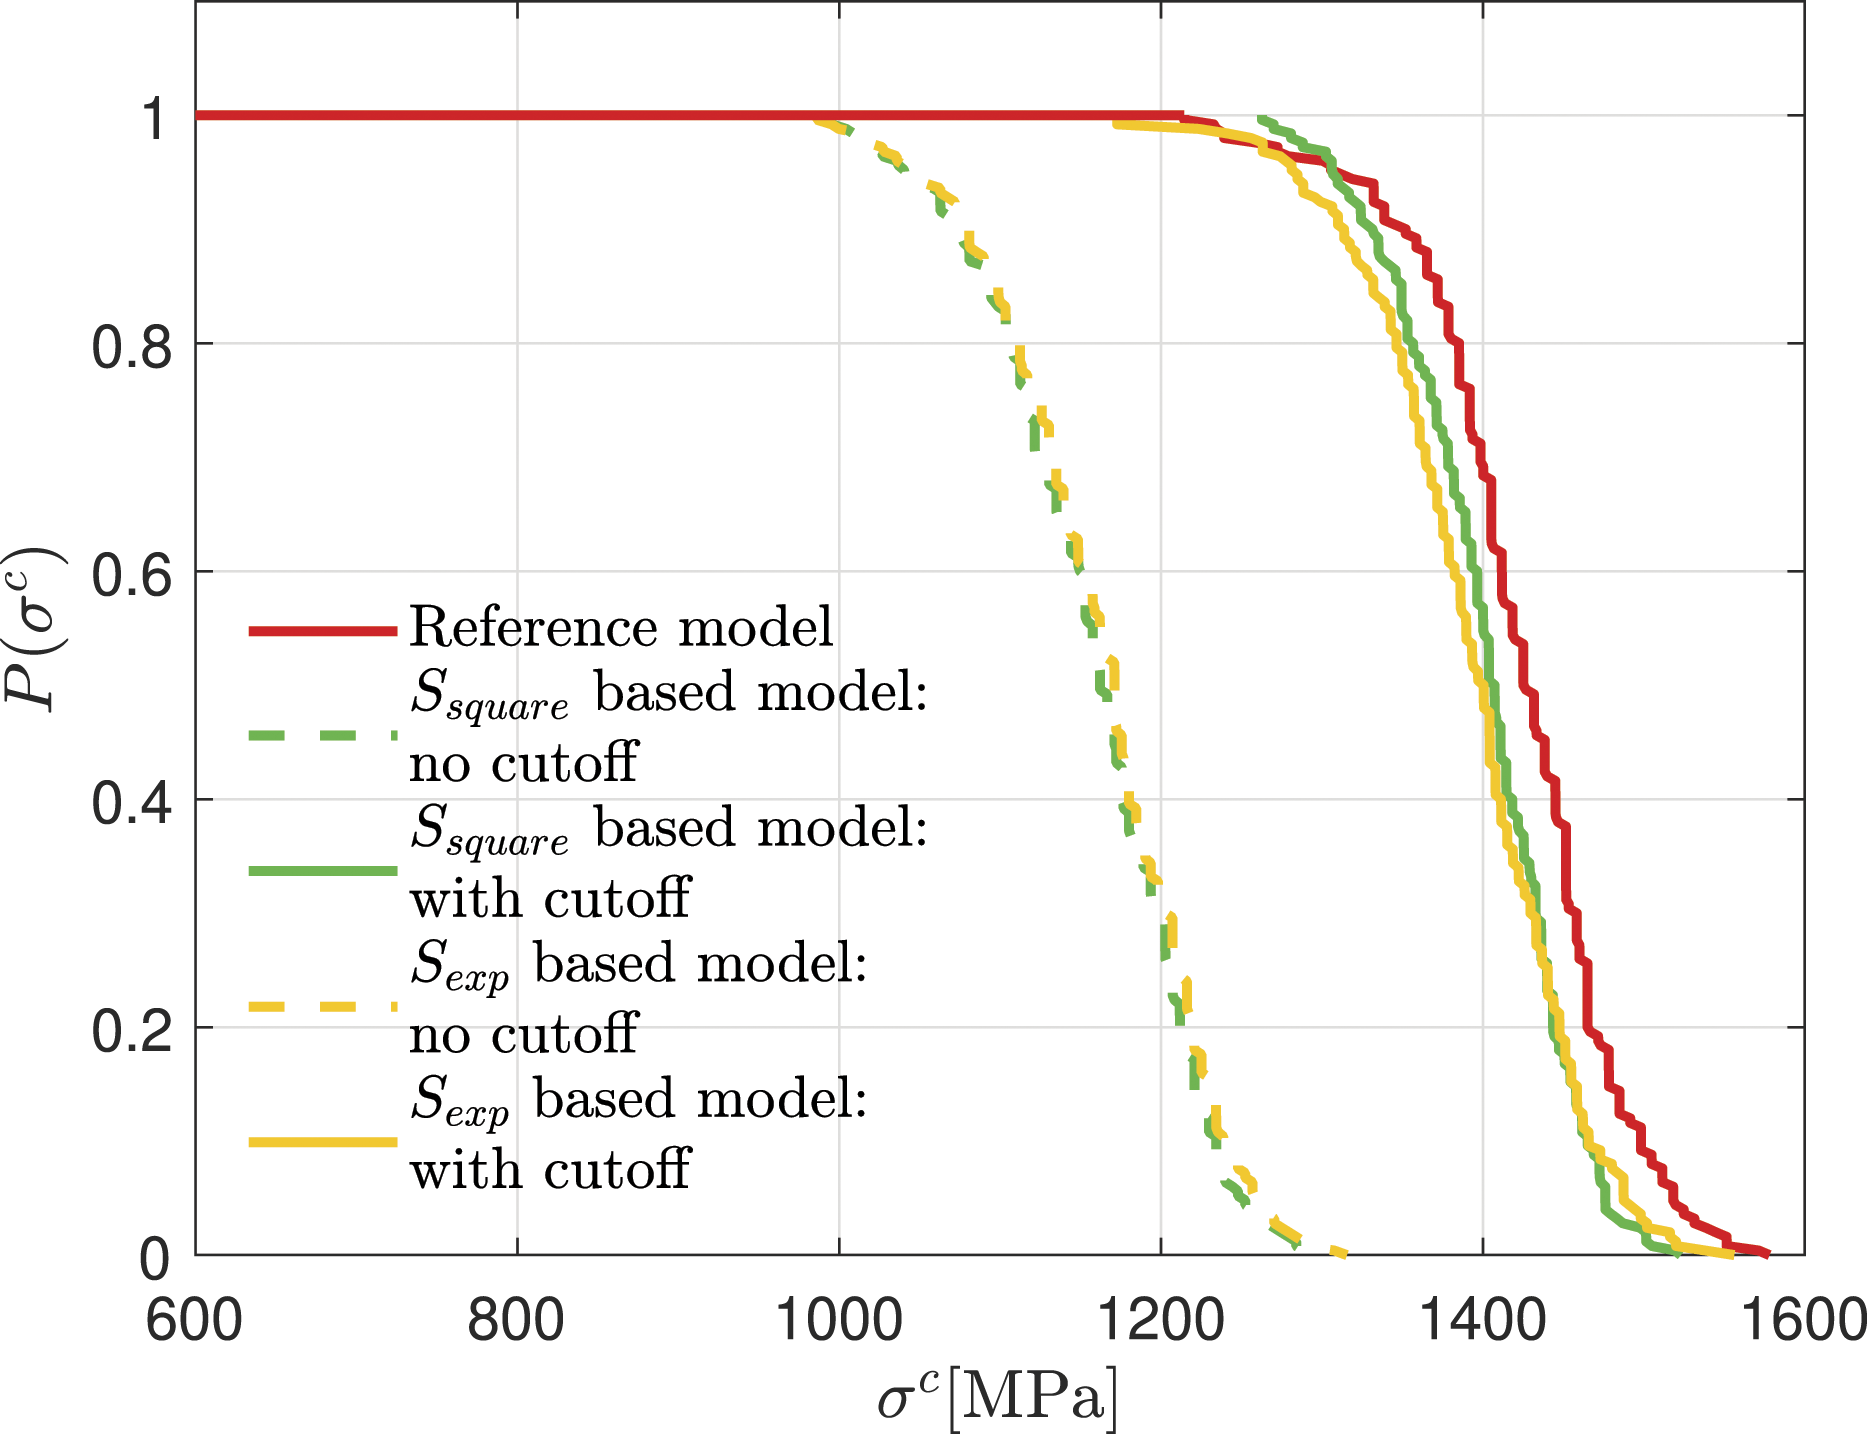
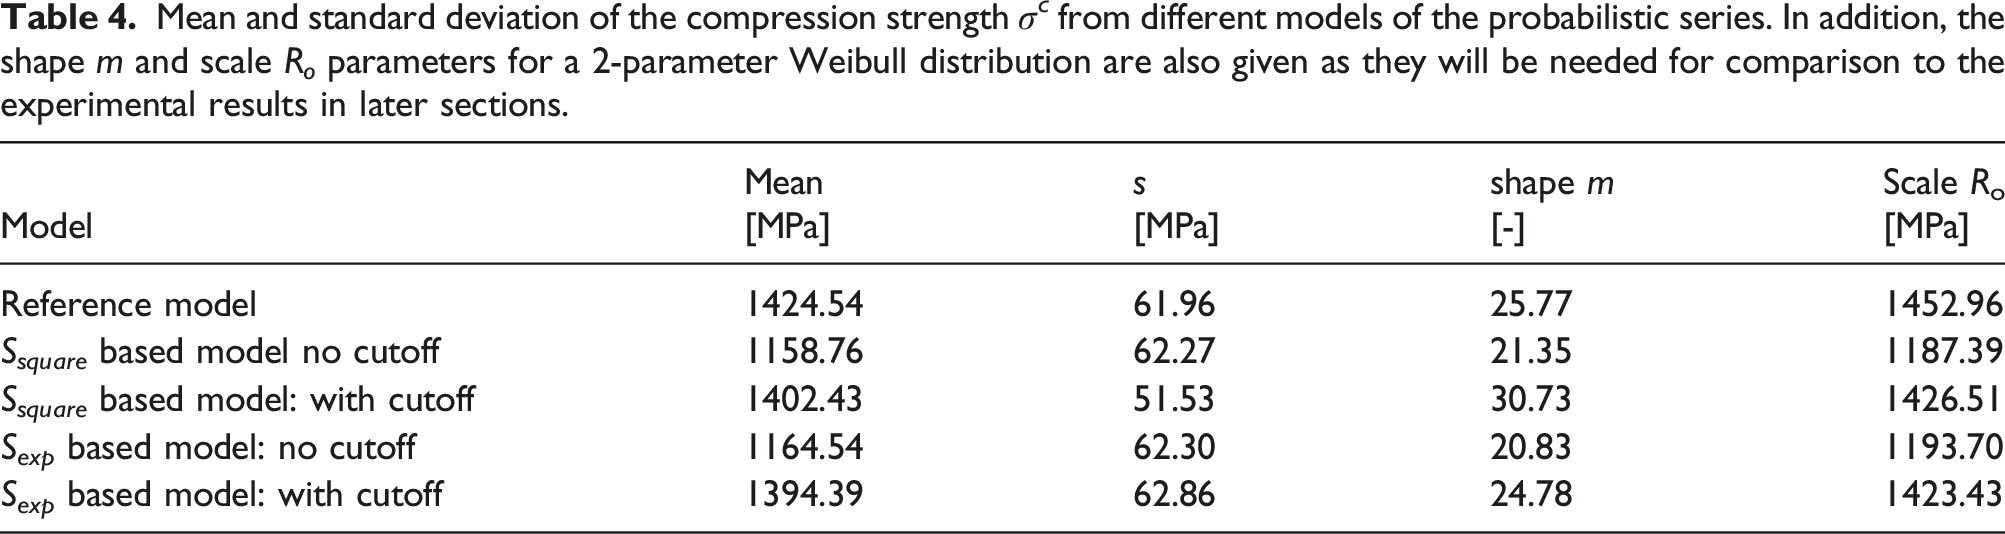
A glance at the Figure 10 already shows that even though the mean square spectral densities Ξ θ and Ξ ϕ , and thus the standard deviation of the misalignment angle, of the models with and without cutoff are equal, the resulting strength predictions vary widely. The models without any cutoff frequencies have a sizable proportion of larger frequencies sampled from the functional forms of the spectral densities, which result in a sizable proportion of small wavelengths in each direction. It results in a large number of weak regions, which consequently result in a decrease of approximately 16–18% in the mean compression strength compared to the reference model based on CT scanned driven spectral densities. The models with the appropriate cutoff frequencies on the other hand show a probability of survival of compression strength very close to the reference model. This results highlights that in addition to the mean square spectral density of the misalignment, the frequency range of the misalignment also needs to be preserved in virtually generated models.
Looking at the range of the compression strength results using the corresponding standard deviation of each model’s strength distribution, some further observations can be made. All the models show standard deviations of predicted compression strength close to the reference model, except the model based on S square with cutoff. Seemingly, when there is no cutoff, the results of the model series based on S square and Sexp are almost identical. When appropriate cutoffs are applied, the mean strengths of both model series are still very close but values of the standard deviations and the Weibull parameter m vary significantly. The standard deviation and the Weibull parameter m values of the model series based on Sexp are almost identical to those of the reference model. But the standard deviation is lower and the parameter m value is higher of the model series based on S square , showing a lower spread of the compression strength prediction. The reason behind this peculiar behavior can be understood in the discretized spectral densities. The experimentally measured spectral densities show larger values at lower frequencies. The model series based on Sexp emulates the observed allocation of higher intensity to lower frequencies. On the other hand, the model based on S square discretizes the spectral density with equal weightage for all frequencies. This apparently translates into lower spread of the resulting distribution of the numerically predicted compression strength. It is concluded based on this observation that in addition to the statistical parameters of the distributions, the spectral parameters including the shape of spectral density curve need to be preserved for accurate prediction of the distribution of the compression strength.
Numerical predictions against experimental results using a scale law
For comparison of the model against experimental results, values of strength under axial compression load are taken from an earlier contribution of the authors, see Ref.
47
The dimensions of the gauge section of the experimental specimens were 5 × 5 mm with a thickness of 1.15 mm. The experiments resulted in a mean strength of 1140 MPa and a standard deviation of 188.2 MPa. The volume of the CT-scans for measuring the fiber misalignment was limited due to the fine voxel resolution of 1.902 µm. The gauge section dimensions of the numerical models were hence limited by the available scan data for measuring the fiber misalignment to 6.657 × 1.1412 × 0.951 mm, see reference topologies section. Since the volume of the gauge section of the experimental specimens Vexp = 28.75 mm3 and the volume of the numerical models Vmodel = 7.2247 mm3 were significantly different, a direct comparison between numerical and experimental results cannot be made. Different experimental51,52 as well as numerical41,53 investigations have shown that the compression strength due to MB failure decreases with increasing sizes and vice versa in homogeneously loaded composites under axial compression load. This decrease in compression strength is attributed to the increasing number of the fiber misalignment induced defects in larger sizes based on the Weibull statistic driven weakest link model.
54
Similar change in strength with changing sizes has been observed in brittle materials such as ceramics.
55
To obtain a mathematical model for the size effect predictions, a power law proposed by Weibull is combined with the weakest link model resulting in following relation: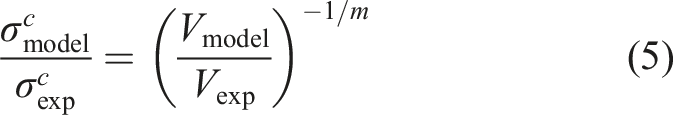
The values of the parameter m for the reference model and the models based on assumed forms of spectral densities with cutoffs are given in Table 4. The value of m is 7.11 for the experimental results given in Ref.
47
Figure 11 shows the aforementioned two parameter form of the scale law for all three model series as well as experiments. The inclination of the scale law is based on the respective m parameter. The scaling law appears as a straight line because of the double logarithmic scale in the figure. To aid the comparison, another variant of the scaling law for 0.5 cumulative probability of failure is included in the plot with a dotted line. For this variant, the line starts at the mean strength of the experimental results and the parameter m was adjusted so that it passes through the mean strength of the reference model. The corresponding value for m is 7.75 which is very close to the value 7.11 of the distribution fitted to the experimental results. As expected based on the Weibull scaling law, the results in Figure 11 indicate that there is a significant increase in the predicted mean strength with smaller model sizes compared to the experiments. Given the mean experimental strength, the value m = 7.75 for the Weibull based scale law can predict the numerical mean strength of the reference model quite accurately. The m values from different series of the numerical models on the other hand are quite high due to less scatter in corresponding probability distributions. The high m values from numerical models can be partially attributed to periodic boundary conditions limiting edge driven failure. Previous numerical investigations in the literature
41
observed similar high values of the m parameter. The complete distributions of the numerically predicted strengths and the experimental strengths are also plotted using error bars. Comparison of σ
c
from the reference model and the models based on assumed forms of spectral densities with cutoffs against the experimental results using the Weibull scaling law given in equation (5).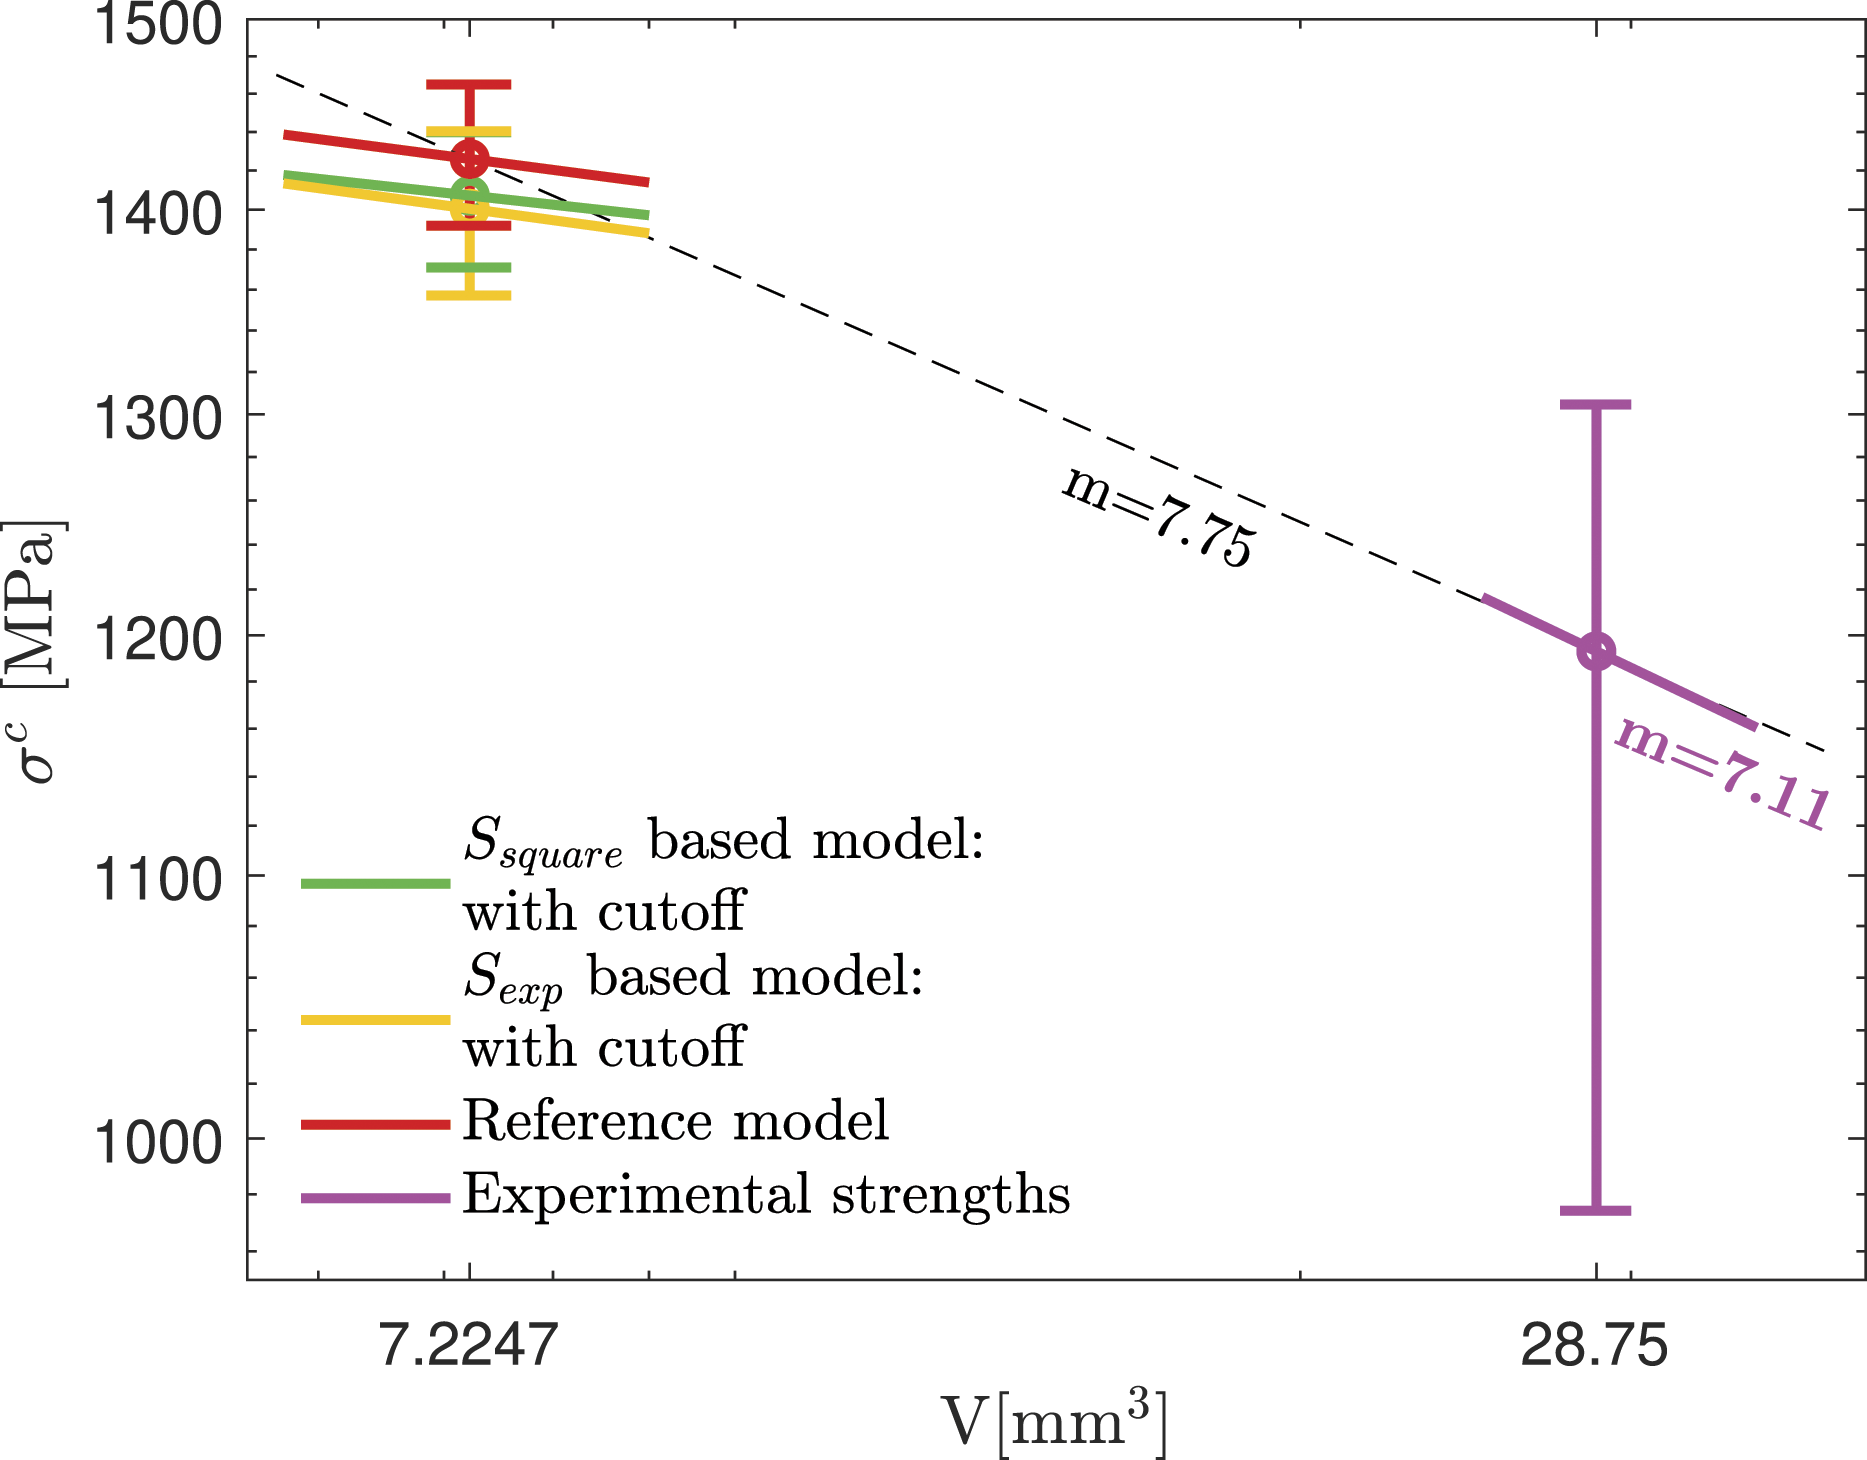
Effect of scaling mean square spectral densities on the prediction of the compression strength
In all previous investigations the standard deviation of misalignment for both the in-plane and the out-of-plane misalignment were held equal to the experimentally measured values given in Table 2. Consequently, the mean square spectral densities Ξ
θ
and Ξ
ϕ
were also same for different models. In this section, however, the effect of scaling mean square spectral densities on the prediction of the compression strength for same model dimensions (6.657 × 1.1412×0.951 mm) are considered by scaling Ξ
θ
and Ξ
ϕ
. For this purpose, three distinct models with each of them using both square and exponential forms of spectral densities were considered. For each of the two functional forms of the spectral densities, the values of Ξ
θ
and Ξ
ϕ
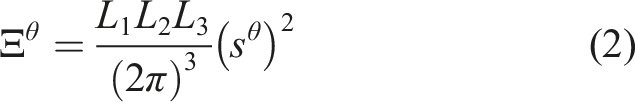
were scaled by factors of 0.25, 4, and 9, resulting in six distinct models. The relation between Ξ and s is given in equation (2) i.e., the resulting scaling of s
θ
and s
ϕ
was by factors of 0.5, 2, and 3. 250 realizations of each scaled model were simulated. The resulting probabilities of survival P(σ
c
) of scaled model series are plotted in Figure 12 along with the unscaled models based on the average experimentally determined values of Ξ
θ
and Ξ
ϕ
. The mean and standard deviation values of all these model series are provided in Table 5. Empirical probability of survival P(σ
c
) over the compression strength σ
c
for models with cutoff frequencies and different scaled values of the mean square spectral densities Ξ
θ
and Ξ
ϕ
. Mean and standard deviations of the compression strength σ
c
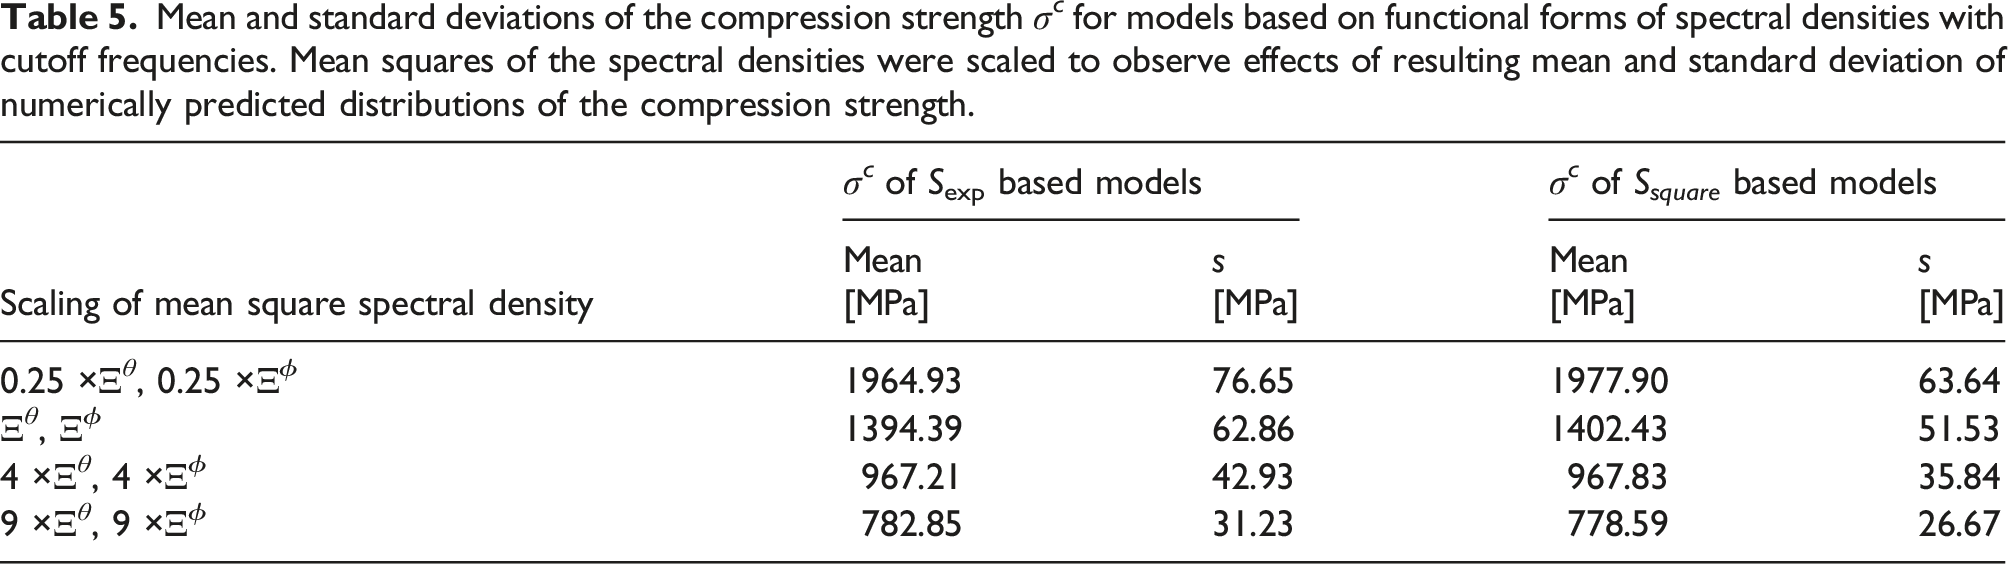
for models based on functional forms of spectral densities with cutoff frequencies. Mean squares of the spectral densities were scaled to observe effects of resulting mean and standard deviation of numerically predicted distributions of the compression strength.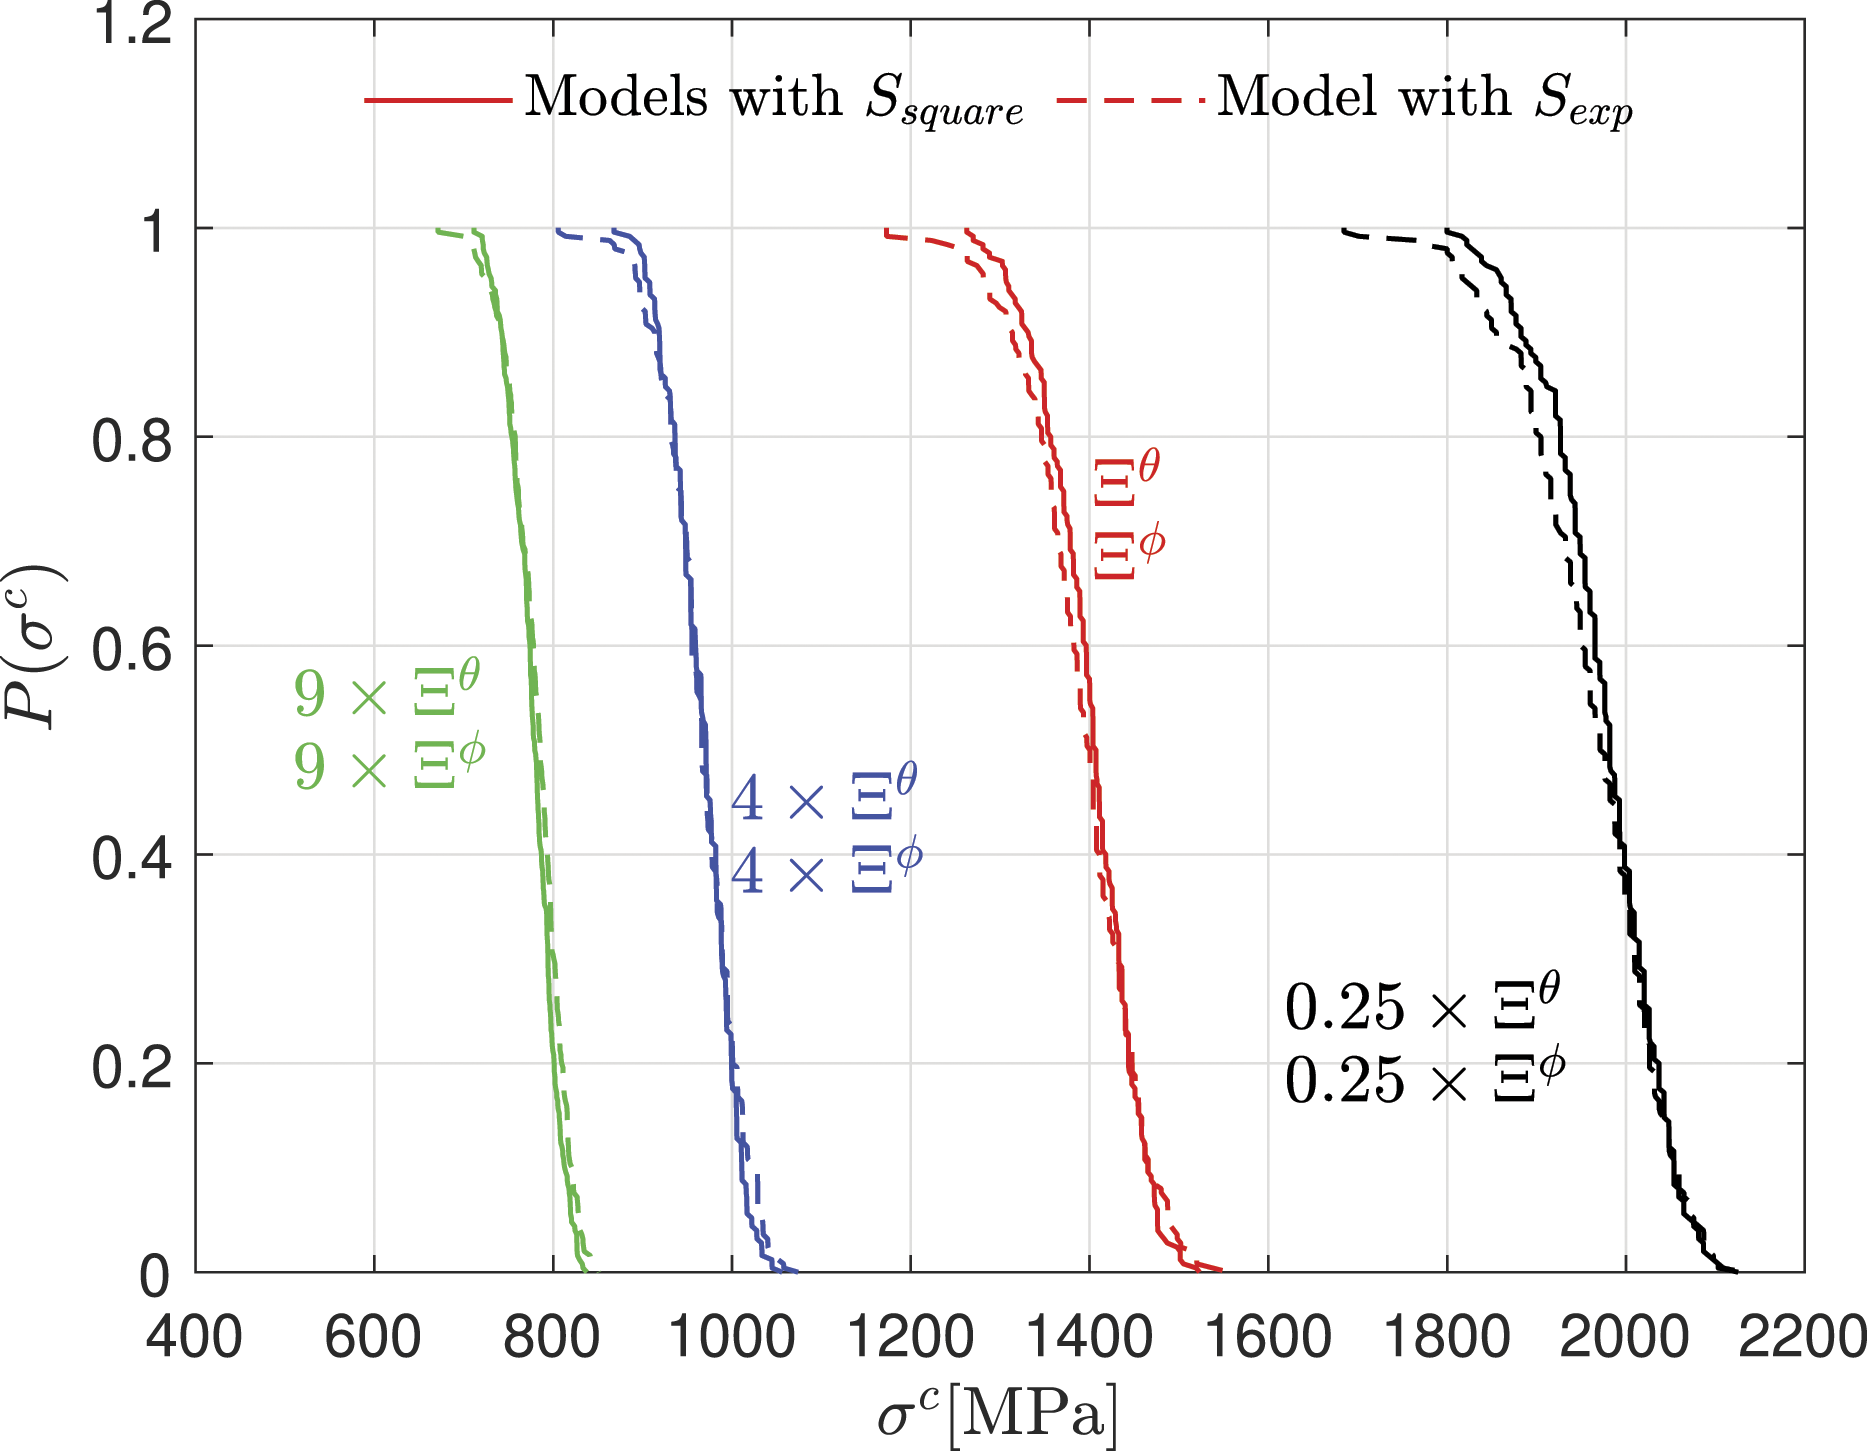
Solid lines in Figure 12 depict results of models based on S square forms of spectral density whereas dotted lines illustrate results of models based on Sexp for both θk,l,m and ϕk,l,m. When the values of Ξ θ and Ξ ϕ were increased, the resulting distributions of σ c were shifted towards lower values and vice versa. This is because increasing values of Ξ θ and Ξ ϕ means higher values of misalignment angles θk,l,m and ϕk,l,m, resulting in lower values of the compression strength σ c .
Some further observations can be made when analyzing the range of the results using the corresponding means and standard deviations of distribution of compression strength from each model. The mean and standard deviation statistics are given in Table 5. Not only does the mean value of each model decreases with an increase of Ξ θ and Ξ ϕ , but the standard deviations of compression strengths also decrease for both Sexp and S square models with increasing mean square misalignment. The larger the misalignment is, the more severe certain regions of the misalignment become, resulting in a smaller range of the distributions of σ c . The analytical solution of Budiansky’s formula given in equation (1) indicates a hyperbola prediction of σ c against misalignment. The slope of this hyperbola at larger angles is smaller compared to the steep slope at very small angles, which implies that the strength variations for models with larger s θ and s ϕ is smaller as predicted here. Interestingly, the standard deviation of S square based model becomes comparable with that of the reference model when Ξ θ and Ξ ϕ are scaled by a factor of 0.25. It again highlights that the exponential form of the spectral density is more suitable in light of the measured spectral density for the current material.
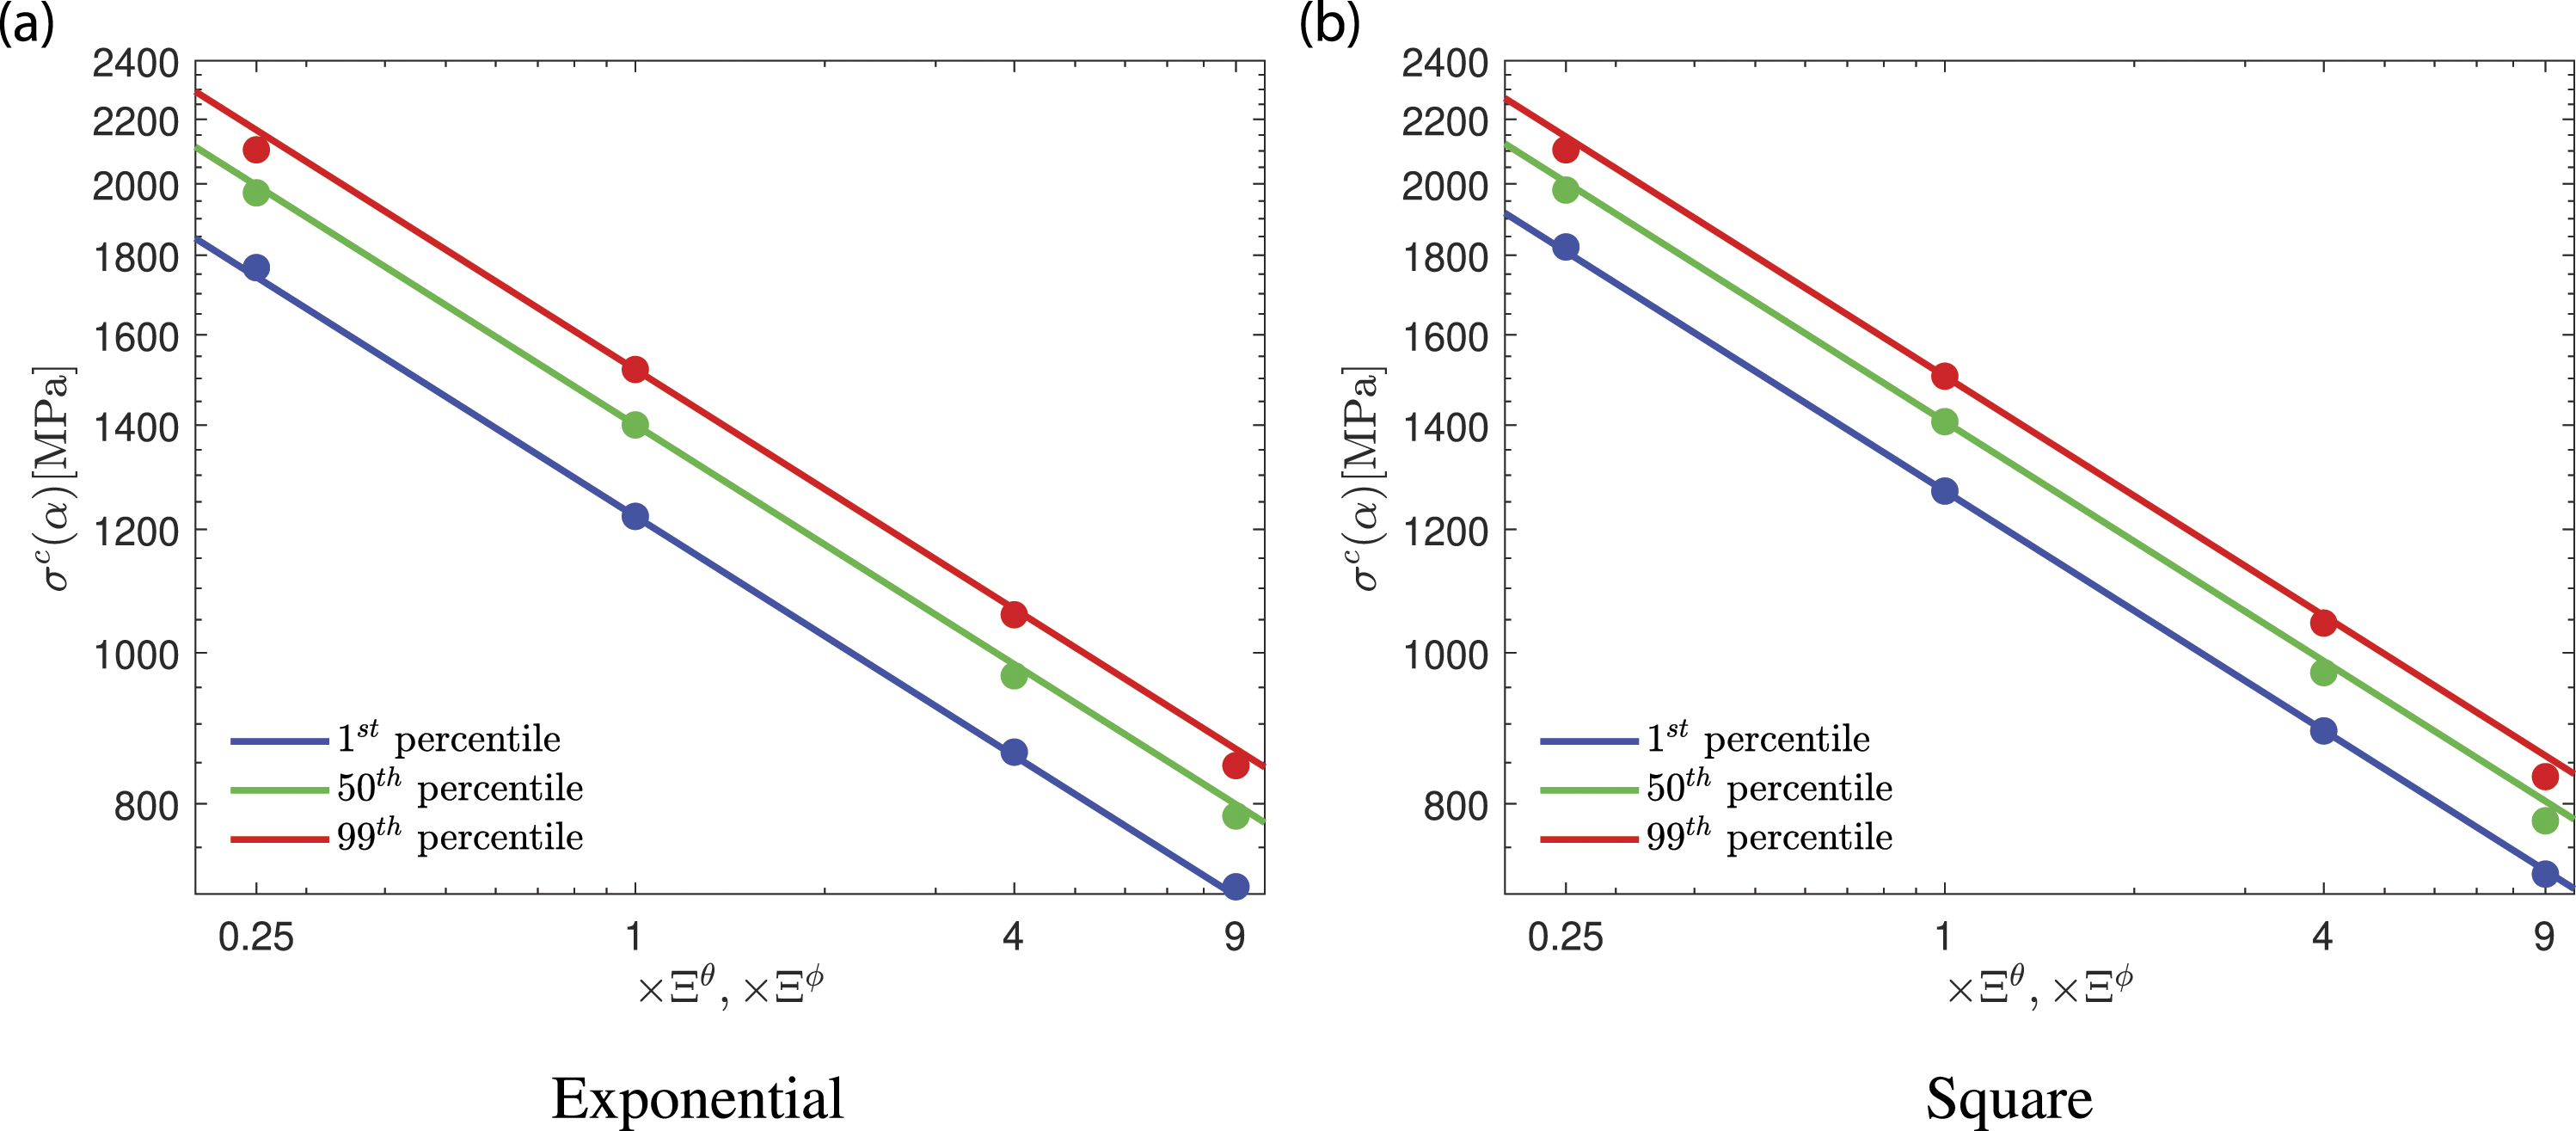
Using the results of Figure 12, a relation for different percentiles of distribution of compression strength
p
σ
c
(α) as a function of scaling factor α of Ξ
θ
and Ξ
ϕ
was defined. There, left super script p indicates the percentile of survival. The relation is applicable to all the percentiles of the distribution of the compression strength and is written as: 1st, 50th (median), and 99th percentiles of the distribution of the compression strength σ
c
as a function of Ξ based on results of models with cutoff frequencies and different scaled values of the mean square spectral densities Ξ
θ
and Ξ
ϕ
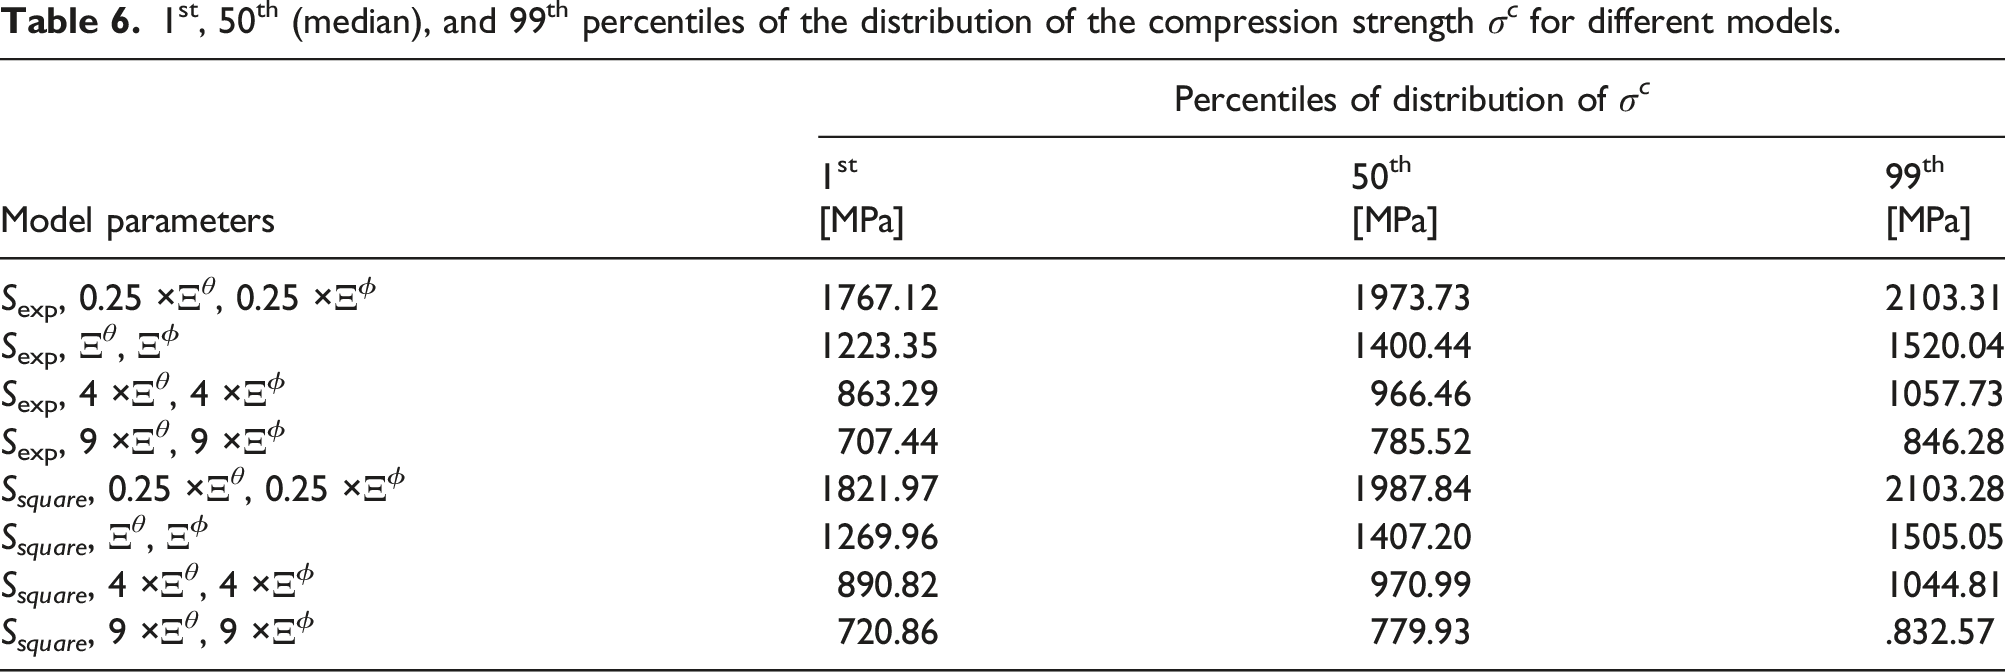
. The corresponding values from each cases are plotted as scatter points on each curve. 1st, 50th (median), and 99th percentiles of the distribution of the compression strength σ
c
for different models.
Conclusion
For best utilization of FRP based structures, the prediction of failure uncertainties and their derivative analyses is a fundamental requirement. Microbuckling (MB) is the dominant failure mode under axial compression load for unidirectional FRPs. The underlying uncertainties in MB failure lead to conservative design practices. This motivated the use of a numerical methodology with homogenized representation of fiber and matrix materials for quantifying the uncertainties in MB failure. Different aspects of the problem were investigated in this regard. Effect of the misalignment dimensionality on the compression strength prediction was investigated using simpler sinusoidal misalignment distributions in the homogenized approach. It was shown that the maximum misalignment angle alone is not the deciding factor but rather the whole distribution of the misalignment modeled in appropriate dimension plays a major role in prediction of compression strength.
The assumption of functional forms of the spectral densities for generation of virtual distributions of the fiber misalignment was investigated. Results of the models based on the different functional forms of the spectral densities were compared against results of a reference model informed by the experimental measurements of the fiber misalignment. The results imply that functional forms of the spectral densities can be assumed as an approximation. However, it was shown that proper cutoff frequencies need to be used for accurate prediction of compression strength. The effect of scaling mean square spectral densities on the prediction of the compression strength were also analyzed and an empirical relation for scaled spectral densities is provided. It was shown that the exponential form of spectral density gave better prediction for whole distribution of the compression strength for the material investigated in the current work.
It is expected that the presented numerical methodology and corresponding results can help in the further exploration of uncertainty quantification in FRPs. Eventually, it may enable more reliable design practices. Additionally, the proposed methodology offers an easy path to the probabilistic investigations of new fiber reinforced materials under compression dominated loads.
Footnotes
Acknowledgements
Funding by the Deutsche Forschungsgemeinschaft (DFG - German Research Foundation) under the project International Research and Training Group (IRTG1627) is gratefully acknowledged.
Declaration of conflicting interests
The author(s) declared no potential conflicts of interest with respect to the research, authorship, and/or publication of this article.
Funding
The author(s) disclosed receipt of the following financial support for the research, authorship, and/or publication of this article: This work was supported by the Deutsche Forschungsgemeinschaft (IRTG1627).