
Abstract
Objective:
This study examines whether New Jersey’s state-funded merit-aid program, which was designed to benefit community college students, including first-time full-time student enrollment, associate degree completion, and transferring out. We compared STARS to programs in other states by applying a typology that categorizes state-funded merit-aid programs by whether they are designed to be inclusive of community college students.
Methods:
Using institution-level data between 2001 and 2021, we used propensity score matching to select comparable community colleges to be included in the untreated group, as well as difference-in-differences and event study approaches to test our hypotheses about the relationship between STARS program adoption and community college outcomes.
Results:
We found that New Jersey’s STARS programs increased White students’ enrollment and associate degree completion in community colleges relative to community colleges in states with merit-aid programs that disproportionately favor 4-year students. However, we did not find the same relationship for non-White students. It was unlikely that the enrollment increase was the result of community colleges siphoning off enrollments from other higher education sectors. Additionally, we did not find any evidence that STARS reduced students transferring out before completing credentials.
Conclusions/Contributions:
By examining a unique merit-aid program focused on community college students, we discuss implications to adopt and design more equitable financial aid policies to support community college enrollment, completion, and transfer. Our results help advance current scholarship by considering tensions among access, social mobility, and merit, while studying whether merit-aid programs can serve as an equitable mechanism for improving community college outcomes.
Introduction
The nation depends on public community colleges to be a first point of entry into higher education and to serve as a conduit that helps students transfer to other colleges and universities. Public community colleges offer some of the most affordable opportunities to earn postsecondary credentials. They can also help students save money or incur less debt than enrolling directly at a 4-year institution (Hu et al., 2018; Kisker et al., 2023). Although racially minoritized students are underrepresented across the landscape of U.S. higher education, they are overrepresented in the public community college sector. Therefore, state policies should focus on helping community colleges improve access, completion, and opportunities to transfer to 4-year universities as part of a broader strategy to address persistent college attainment gaps (National Student Clearinghouse Research Center, 2017).
Many states use merit-aid programs to promote academic excellence and attract academically high-achieving students to enroll in public colleges and universities, especially 4-year institutions (Baum & Schwartz, 1988; Dynarski, 2000). Over the past few decades, many states have moved from allocating their student aid through need-based grants and now rely primarily on merit-based programs (The National Association of State Student Grant and Aid Programs, 2023). While community college students are technically eligible for the majority of state-funded merit-aid programs, only a handful of state-funded merit-aid programs actually provide substantial financial aid to support students to attend a community college.
Although 47 state-funded merit-aid programs formally allow community college students to apply for financial aid, on average, 97% of dollars awarded through those programs go to 4-year college students (Hu et al., 2024). This disparity between what community college students are eligible for, and what they receive, reflects a broader critique of state-funded merit-aid programs—that they use “merit” criteria to disproportionately direct resources to White students and students from higher-income households (e.g., Brown, 2007; Dynarski, 2000; Heller & Rasmussen, 2001). Within a broader sociological approach to examining the role that community colleges in US higher education, it is unclear whether even a merit aid policy that directs awards to community college students can serve as a mechanism for overcoming the tensions of expanding access to college while protecting privilege and preserving selectivity at 4-year institutions.
This study helps advance current scholarship on community colleges because many scholars who examine the influence of state-funded merit-aid programs on student and institutional outcomes tend to limit their analyses to 4-year institutions (e.g., Birch & Rosenman, 2019; Cohodes & Goodman, 2014; Curs, 2008; Henry et al., 2004; Leeds & DesJardins, 2015). When studies focus on the impact of merit-aid programs on community colleges, they tend to examine how a single state policy affects that state’s 2-year colleges (e.g., Welch, 2014; Zhang et al., 2016) and how the policy redirects in-state students from 2-year to 4-year colleges (e.g., Bruce & Carruthers, 2014; Gurantz & Odle, 2022; Zhang et al., 2013). Scholars have largely avoided using data from multiple states and making cross-state comparisons, which means research has overlooked how community college outcomes vary under different state merit-aid policies (Hu et al., 2024). This obscures whether merit aid policies can be more equitably designed to impact different groups of 2-year college students.
This study focuses on one of only a handful of state-funded merit-aid programs that are designed to benefit community college students: New Jersey’s Student Tuition Assistance Reward Scholarship (STARS) Programs. STARS was first implemented in July 2004 to offer students in the top 15% of their high school graduating class free tuition for full-time attendance at their local community college (Higher Education Student Assistance Authority [HESAA], 2024a). In 2006, STARS II was implemented to support STARS recipients who successfully earned an associate degree and transferred to a 4-year institution with additional scholarships to pursue their baccalaureate degrees (HESAA, 2024b). This study examines whether New Jersey’s state-funded merit-aid program, which was designed to benefit community college students, influences community college outcomes, such as first-time full-time student enrollment rates, associate degree attainment rates, and transfer-out rates.
Literature Review
Historically, community colleges provide access to higher education with a broad array of sub-baccalaureate programs and the opportunity to transfer to a 4-year institution (e.g., Dougherty, 1994; Kisker et al., 2023). State governments often support community colleges’ access and transfer mission with policies that address college readiness, articulation agreements, and tuition assistance programs (Boatman & Soliz, 2018; Page & Scott-Clayton, 2016). However, state policies aiming to increase community college access and transfer can have unintended consequences. For example, when Florida made placement test scores optional and allowed students to opt out of developmental education courses, Florida community college administrators worried that the policy prioritized efficiency over equality in the pursuit of cost savings (Nix et al., 2020).
Another example of unintended consequences comes from financial aid policy. Multiple studies have shown that offering free tuition programs can increase community college enrollment (e.g., Lee et al., 2022), but part of the enrollment increase was a substitution effect—that is, the policy redirected students toward community colleges and away from 4-year institutions (Li & Gándara, 2020; Nguyen, 2020). Similarly, Baker (2016) examined the influence of structured transfer pathways in California and suggested that academic departments that offer transfer degrees benefited more from high-achieving students crowding in. Taken together, these studies suggest that state policies can sometimes be more impactful at redirecting students rather than increasing overall higher education enrollment or improving educational equity.
Merit-Aid Programs and Community College Access and Success
Merit-aid programs are often designed to retain academically high-performing students, who are disproportionately from more affluent and advantaged families, to attend college and work in the state (Guinier, 2015; Heller & Rasmussen, 2001). As Ness (2010) discussed, the process of determining merit-aid eligibility is highly political. The traditional measures used to evaluate students’ academic merit, such as standardized test scores and class ranks, may not be the most equitable measures of merit for diverse groups of community college students (Isserles, 2021). Community colleges serve a broad array of students (American Association of Community Colleges, 2024), and opening merit aid programs to community college students does not challenge the underlying assumption that some students (e.g., recent high school graduates) are more deserving of aid than others (e.g., adult learners).
State-funded merit-aid programs typically work like vouchers, and students can use merit-aid awards at different types of colleges. Therefore, policy design features (e.g., eligibility, generosity) can influence not just whether students attend college but also where they choose to enroll. Research on merit-aid programs has typically focused on 4-year students, including outcomes such as college enrollment (Birch & Rosenman, 2019; Leeds & DesJardins, 2015) and retention and completion outcomes (Cohodes & Goodman, 2014; Zhang et al., 2016). Single-state case studies of merit-aid programs and community college students examined the HOPE scholarship programs in Tennessee and Georgia, as well as the Bright Futures scholarship in Florida. Bright Futures increased enrollment by 19.1% for students attending community colleges full-time and by 44% for students attending community colleges part-time (Zhang et al., 2013). While Zhang et al. (2013) found that merit aid increased enrollment at community colleges in Florida, Cornwell et al. (2006) suggested that Georgia’s HOPE program had no direct impact on community college enrollment. Welch (2014) examined student-level data and found that being eligible for Tennessee’s HOPE scholarship did not impact community college students’ likelihood of persistence, upward transfer, or degree completion.
As previously mentioned, studies have found that Promise programs can redirect students among higher education sectors (Li & Gándara, 2020; Nguyen, 2020). Similarly, researchers have cautioned that merit-aid programs can shift enrollments between sectors, rather than increase total enrollment in higher education. Depending on the value of grants, merit-aid programs can redirect students who would otherwise attend community college to 4-year universities by reducing the cost of directly enrolling in a baccalaureate institution (Cornwell et al., 2006). Bruce and Carruthers (2014) estimated that Tennessee’s HOPE program diverted students to enroll in 4-year institutions instead of community colleges. Similarly, Gurantz and Odle (2022) found that the Florida Medallion Scholars merit-aid program induced a substitution effect that pulled students away from 2-year colleges and pushed them to 4-year colleges. Finally, Zhang et al. (2016) suggested that while Bright Futures was successful at retaining Florida’s high school students to attend public in-state higher education, it increased the probability that students chose to attend 4-year over 2-year colleges. Zhang and colleagues worried that “this might lead to undesirable educational outcomes such as . . . reduced student transfer from two-year to four-year institutions” (2016, p. 143).
State-funded merit-aid policies have not all favored 4-year colleges at the expense of 2-year colleges. If designed differently, state-funded merit-aid policies have reversed the flow of students from 4-year to 2-year colleges. Missouri’s A+ Schools Programs increased the 2-year college-going rate by 5.3 percentage points, while 4-year enrollment declined (Muñoz et al., 2016). Domina (2014) examined student-level data and showed that when state-funded merit-aid programs cover less than the cost of tuition, student beneficiaries tend to enroll at community colleges. While increasing community college enrollment has helped expand college access, scholars have shown that many students who first enroll in a community college do not progress toward baccalaureate degree completion (Broton, 2019; Delaney, 2024; Hu et al., 2018). Therefore, when state-funded merit aid increased enrollment at 2-year colleges, it is important to consider whether it changed their relative share of in-state enrollment and whether those colleges increased degree completion and transfer-out.
Merit-Based Aid for Community Colleges in New Jersey
New Jersey’s community colleges enroll about 45% of undergraduate students in the state’s public higher education sector (U.S. Department of Education, 2022). About 38% of students transfer out within 6 years of first enrolling at a New Jersey community college, which is higher than the national average of 33% (Community College Research Center, 2024). The State of New Jersey values upward transfer from its community colleges, as demonstrated by a statewide transfer agreement aiming to create a “seamless transition” to public 4-year universities (New Jersey President’s Council, 2008, p. 1). Through this agreement, students are assured that if they complete all general education requirements and earn an associate’s degree at any New Jersey community college, their coursework will fulfill general education requirements and count for exactly half of the credits required to earn a bachelor’s degree at any in-state public 4-year university. The state’s commitment to college access and upward transfer is reflected in the community college focused design of New Jersey’s merit aid system, STARS.
While the majority of state-funded merit-aid programs practically exclude community college students altogether (Hu et al., 2024), New Jersey’s STARS programs target aid to community college students. Specifically, STARS is unique among merit programs due to the sequence of two stages: the first stage of STARS Program focuses on supporting students to attend their local community college, and STARS II Program focuses on supporting students to transfer to a 4-year university (HESAA, 2024a, 2024b). In the first stage of the STARS program, students in the top 15% of their high school graduating class are eligible to receive last-dollar awards up to the cost of tuition that can be used for up to five semesters at their local community college. This is a clear mechanism to get high-achieving students to consider attending their local community college instead of a 4-year institution. STARS recipients who complete their associate’s degree with a 3.25 GPA and gain admission to a New Jersey 4-year public university are eligible for STARS II. While not as generous as the tuition award provided by STARS, STARS II offers last-dollar awards of up to $1,250 per semester to assist with 4-year university tuition for up to four semesters. The combination of these programs creates a clear pipeline for high-achieving high school graduates to advance toward the baccalaureate by enrolling and transferring through local community colleges. This is a stark contrast to the more common approach to merit aid in other states, which tends to focus on supporting students who go straight from high school to 4-year institutions (Hu et al., 2024).
In Fiscal Year 2005, 789 community college students received a total amount of $1.7 million in STARS (HESAA, 2005). The total expenditure quickly increased to $6.7 million for 2,593 community college students for STARS and $850,000 for 272 community college transfer students for STARS II in Fiscal Year 2007 (HESAA, 2007). In Academic Year 2023-24, a total of 2,285 students received $6.6 million awards from the two STARS programs. In 2022-23, the average in-state tuition and fees required to attend a public 4-year university in New Jersey were about $15,000 (National Center for Education Statistics, 2024). By partially, but not fully, covering the cost of earning a baccalaureate after transfer, STARS II subsidized students and families who could afford to pay the uncovered costs of attendance.
Theoretical Framework
Sociologists have long studied the paradoxical dynamics that define community colleges. They offer broad access to higher education, but in doing so, they act as a pressure valve that relieves demand for 4-year universities to be less selective. In other words, as the nation’s demographics changed, community colleges created opportunity for racially minoritized students to achieve some type of postsecondary education even as they protected the privilege of White students who disproportionately attended 4-year universities (Brint & Karabel, 1989; Labaree, 1990; Schudde & Goldrick-Rab, 2015).
STARS fits within this sociological tradition of studying community colleges. In one sense, by directing money to students who attend community colleges, STARS challenges the existing hierarchy of colleges and universities, which provides greater resources to selective 4-year universities (e.g., Schudde & Goldrick-Rab, 2015). However, as a merit-aid program, the program inherently reflects the meritocracy ideology in American higher education (Liu, 2011). In other words, it perpetuates inequity by using eligibility criteria centering on traditional measures of academic performance that disproportionately benefit middle- or upper-class students. Taken together, STARS’ two stages draw students into community college with the promise that it offers a feasible path to 4-year universities. That transfer function has historically been “a key part of the social significance” of community colleges: “they keep alive a belief in the possibility of achieving social mobility and in the existence of a meritocratic distribution of social rewards” (Labaree, 1990, pp. 234–235). In fact, omitting the transfer function would decouple American beliefs in both social mobility and meritocracy. Labaree (1990) argued: “To disband the transfer function . . . would deny community college students the hope of getting ahead and freeze them in a lower educational track heading inevitably away from the more desirable social positions” (p. 235). By awarding supplemental aid to transfer students, STARS II legitimizes and prioritizes the definition of student success as transferring out of a community college to a 4-year university (Bills, 2019; Brint & Karabel, 1989; Witteveen & Attewell, 2020).
State policies that are shaped by the meritocracy ideology can also be racialized (Au, 2016; McCambly et al., 2023). Castro (2013) pointed out that many existing college readiness interventions failed to recognize how sociopolitical dynamics of structural racism disproportionately pose obstacles for students of color in achieving college readiness. Similarly, George Mwangi et al. (2023) used critical policy discourse analysis to examine state policy to incentivize transfer. She found that “transfer incentives can contribute to educational inequity for racially minoritized students via color-evasive and meritocratic policies” (pp. 75–76). The stratification of higher education—that selective admissions and the distribution of financial aid ration seats at the most well-resourced universities (e.g., Taylor & Cantwell, 2019)—further contributes to students’ beliefs in meritocracy and exacerbates racial inequality (Mijs, 2023; Walton et al., 2013). In the larger context of the U.S. society (e.g., the racialized K-12 education system), policymakers can use community colleges to reinforce higher education stratification by disproportionately offering White students a path to upward transfer to 4-year universities (Dougherty & Kienzl, 2006; Dowd et al., 2008; Wassmer et al., 2004).
By examining New Jersey’s STARS programs in the context of broader literature, we aim to understand the influence of community college merit aid on student enrollment, completion, and transfer, while acknowledging that the policy may disproportionately benefit White students compared to all other students. Our paper is grounded in a larger sociological tradition of studying community colleges, while also answering a recent call “to show the mechanisms that produce differential transfer rates and degree attainment across socioeconomic status and race” (Schudde & Goldrick-Rab, 2015, p. 39). We seek to contribute to sociological scholarship on how community colleges may be points of access to sub-baccalaureate education and training, while bottlenecking movement to 4-year universities by testing three hypotheses:
Methods
This study used institution-level data from the Integrated Postsecondary Education Data System (IPEDS) between 2001 and 2021, state-level data from the National Center for Education Statistics and the Education Commission of the States, and county-level data from the Bureau of Labor Statistics and the Bureau of Economic Analysis. We used propensity score matching to select comparable community colleges to be included in the untreated group, as well as difference-in-differences and event study approaches to test our hypotheses about the relationship between STARS program adoption and community college outcomes.
Variables
To explore the relationship between STARS program adoption and student enrollment, completion, and transfer, we included three sets of dependent variables at the institution level. The first set of dependent variables included the (logged) number of first-time full-time (FTFT) students enrolled for each group (i.e., total, White, non-White) for entering cohorts in each year between 2001 and 2021. To account for potential enrollment shifts across sectors, we also calculated the share of FTFT students each institution enrolled out of all FTFT students in any sector in the state.
Because STARS II was only available to students who earned an associate degree before transferring, we included dependent variables measuring college performance on associate degree completion and non-completion transfer-out within 150% of normal time (i.e., 3 years after matriculation) for entering cohorts 2001 to 2018. Specifically for the share of associate degree completers, we calculated this measure by dividing the total number of completers of programs of two but less than 4 years (150% of normal time) by the number of students in the adjusted FTFT cohort. We calculated this measure for the White and non-White groups, respectively (i.e., the share of associate degree completers for White students = the total number of White completers / the number of White students of the adjusted FTFT cohort). Because we hypothesized that STARS II could deter students from transferring out without first earning an associate degree, regardless of reasons (e.g., aiming to obtain a bachelor’s degree, transferring to another community college), we included a third set of dependent variables measuring the share of transfer-out students 3 years after matriculation. These measures were calculated as the share of non-completion transfer-out by dividing the total number of transfer-out students who have not completed or graduated by the number of students of the adjusted FTFT cohort for each group (i.e., total, White, non-White).
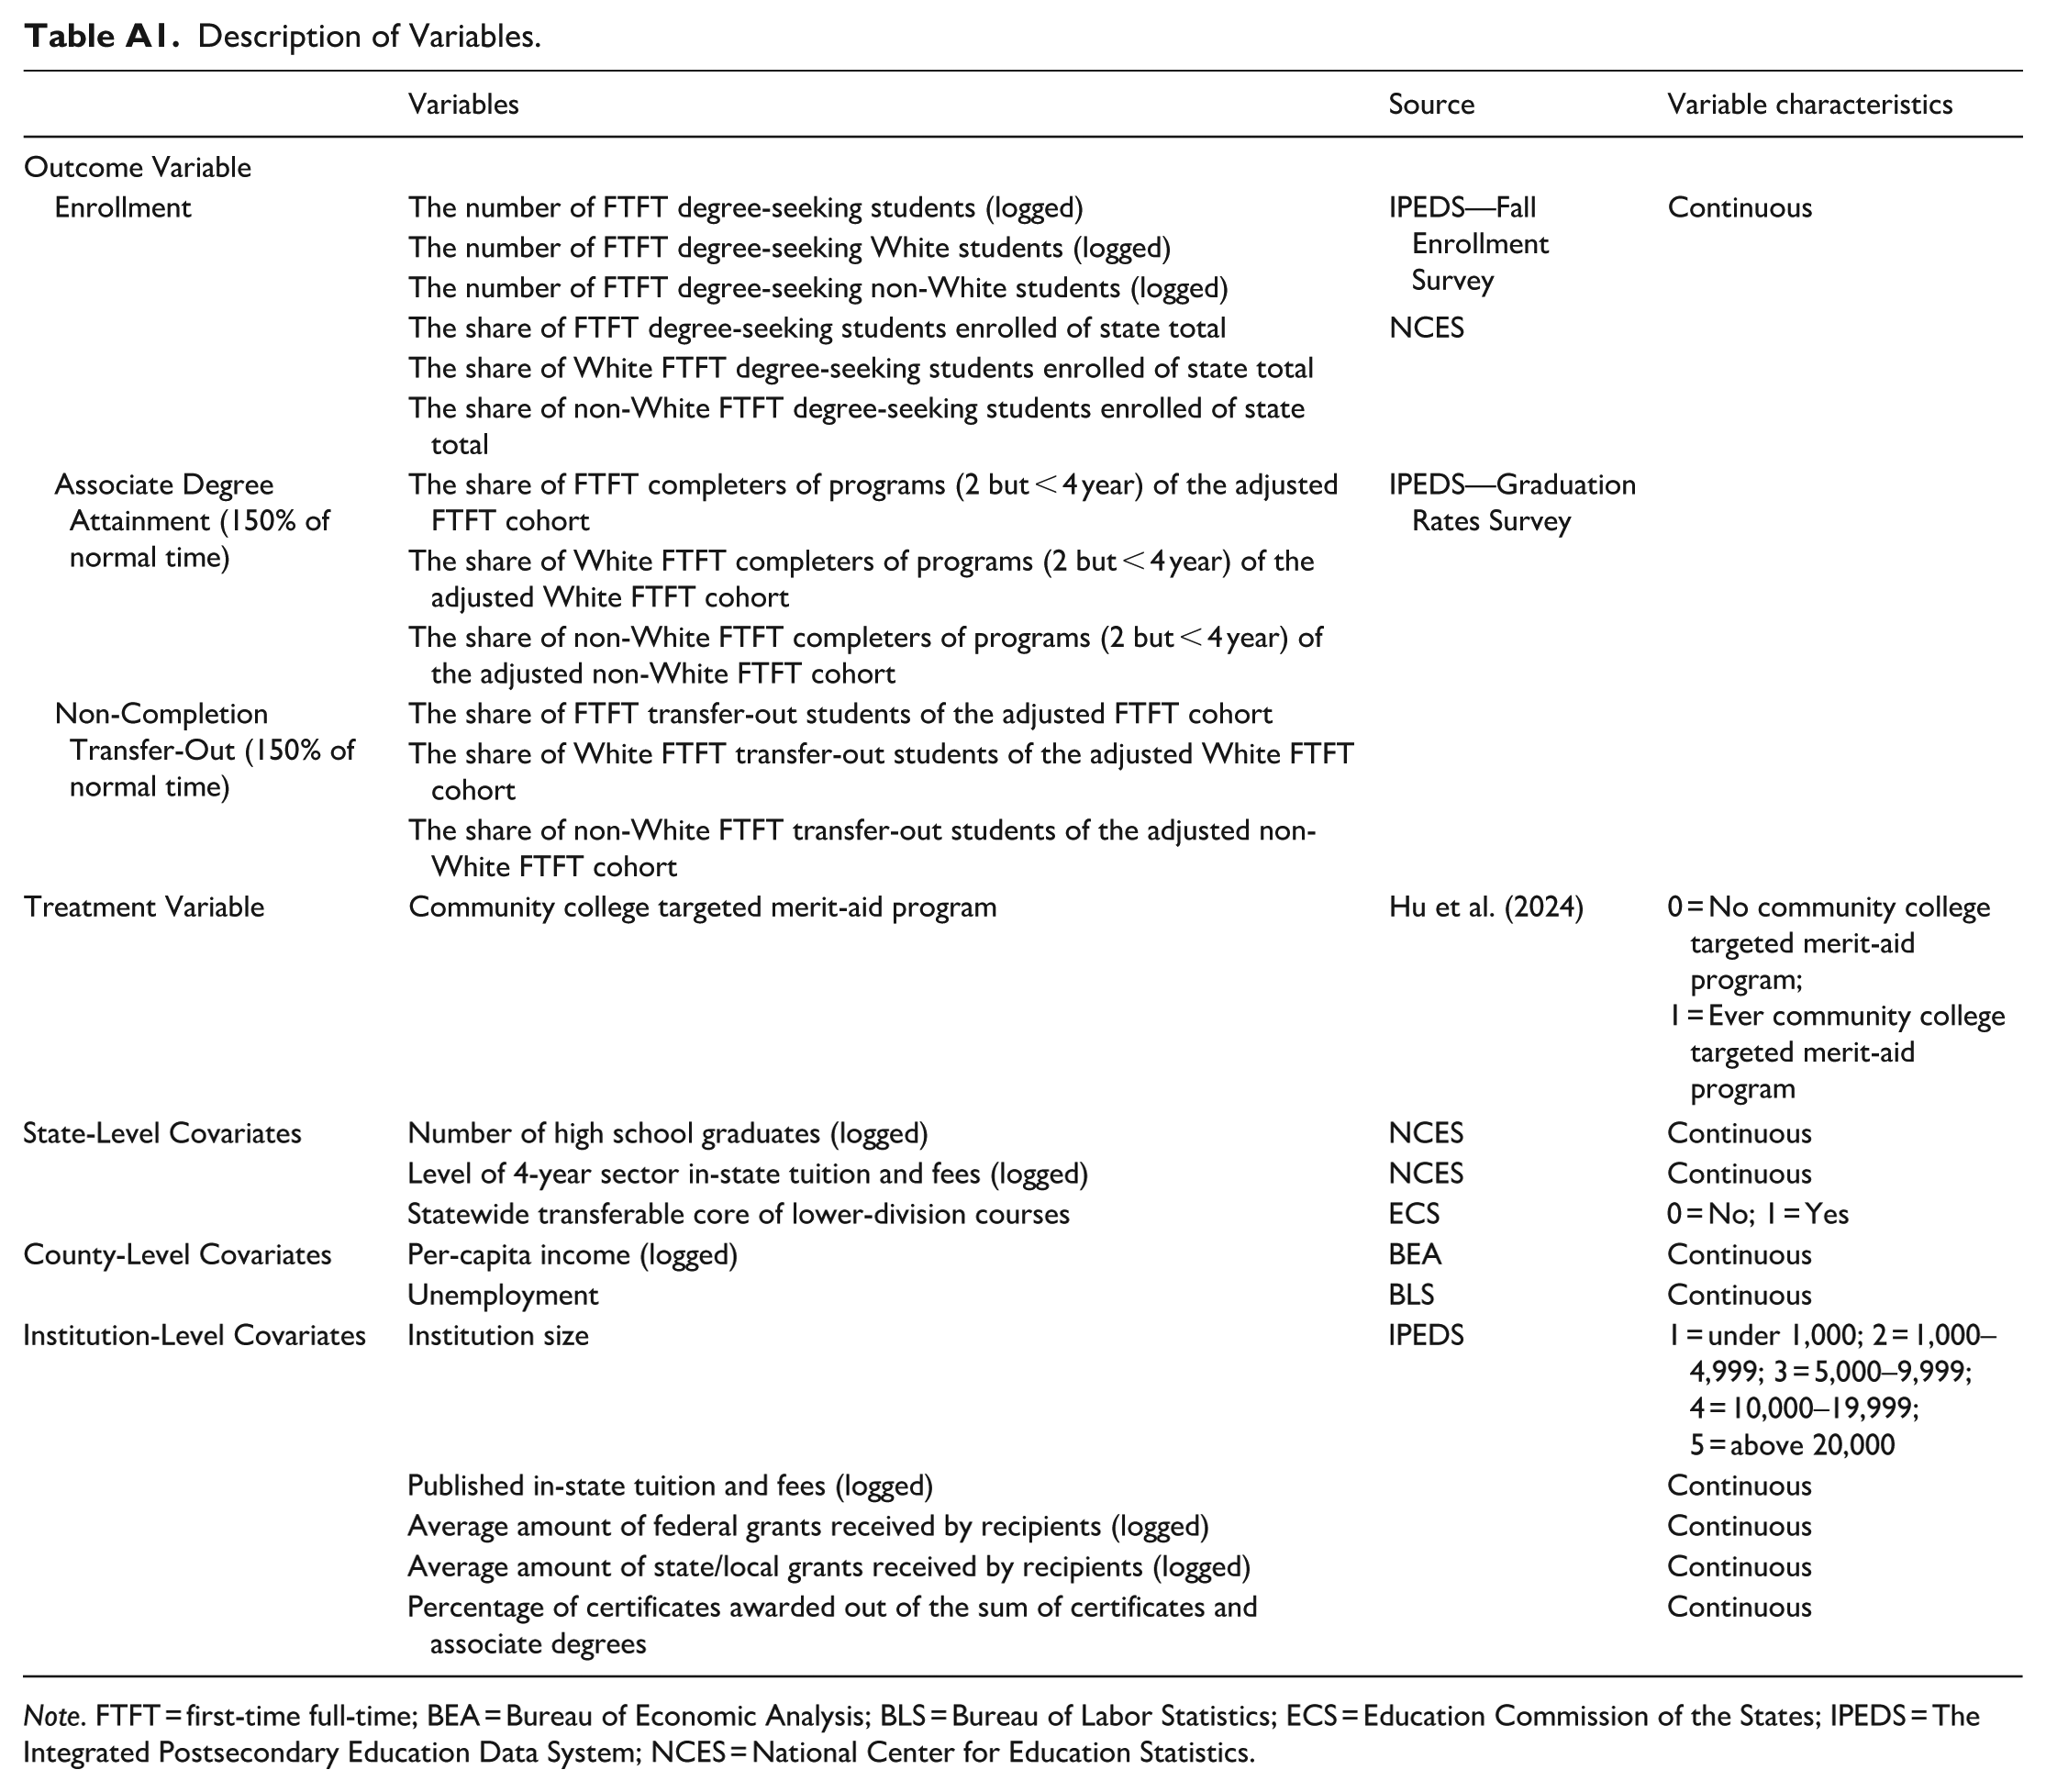
The treatment variable was a binary indicator of cohorts being eligible for STARS programs in New Jersey after 2004. Between 2001 and 2021, 19 public 2-year institutions in New Jersey were subject to STARS (n = 399). We controlled for state-, county-, and institution-level covariates that could influence college enrollment and transfer-out based on prior literature (e.g., Baker, 2016; Frederick et al., 2012; Hillman & Orians, 2013). Specifically, we controlled for the number of high school graduates, average in-state tuition and fees of the 4-year sector, and whether a statewide transferable core of lower-division courses was in place. At the county level, we controlled for per-capita income and unemployment rate. At the institution level, we controlled for institution size, published in-state tuition and fees, the average amount of federal and state/local grants received by recipients, and the percentage of certificates awarded out of the sum of certificates and associate degrees as a proxy for the college’s vocational orientation. Some continuous variables were transformed using the natural logarithm to meet the statistical assumptions using multiple linear regression (Hu, 2023). We followed the interpretation of log-level models that 100 times of the coefficient gives the percentage change of the outcome when the treatment changes by one unit (Wooldridge, 2016). All dollar amounts were adjusted to 2021 constant dollars. Appendix A lists all variables used in the analyses.
Comparison Group Selection
Prior studies have found that whether state-funded merit-aid programs encourage students to attend community colleges or 4-year institutions depends on policy design features (Cornwell et al., 2006; Domina, 2014). We set out to apply a typology (Hu et al., 2024) that categorizes state-funded merit-aid programs by whether they are designed to be inclusive of community college students. The typology was developed using latent class analysis (LCA) to analyze specific state-funded merit-aid program characteristics in policy adoption, eligibility criteria, and program dosage. Based on these characteristics, LCA sorts state-funded merit-aid programs into three groups: The Community College Marginalizing Programs (n = 47 or about 69% of programs), The Community College Targeted Programs (n = 4 or about 6% of programs), and The Balanced Programs (n = 17 or about 25% of programs). We use this typology to select comparison groups for analyzing the effects of STARS programs (as presented in Table 1). Specifically, the first comparison group included 262 public 2-year institutions in 17 states with merit aid, but none of the programs in place were Community College Targeted Programs throughout the 2001 to 2021 period (n = 5,502). Then, because some states in the first comparison group had multiple merit-aid programs concurrently in place, we created a second comparison group of 187 public 2-year institutions in 11 states with only Community College Marginalizing Programs during the study period (n = 3,927).
Comparison Group Selection.
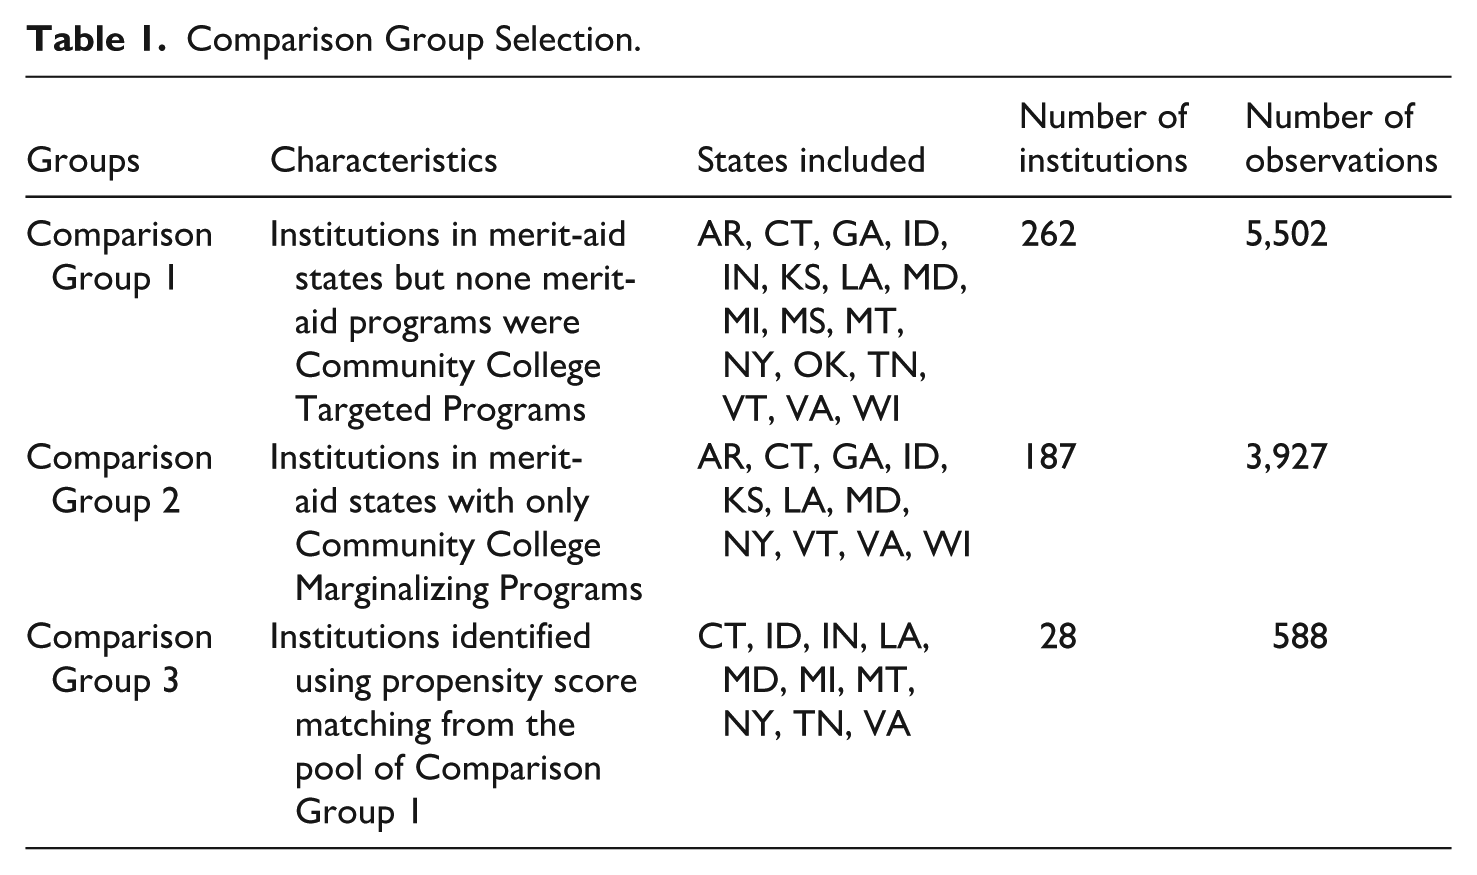
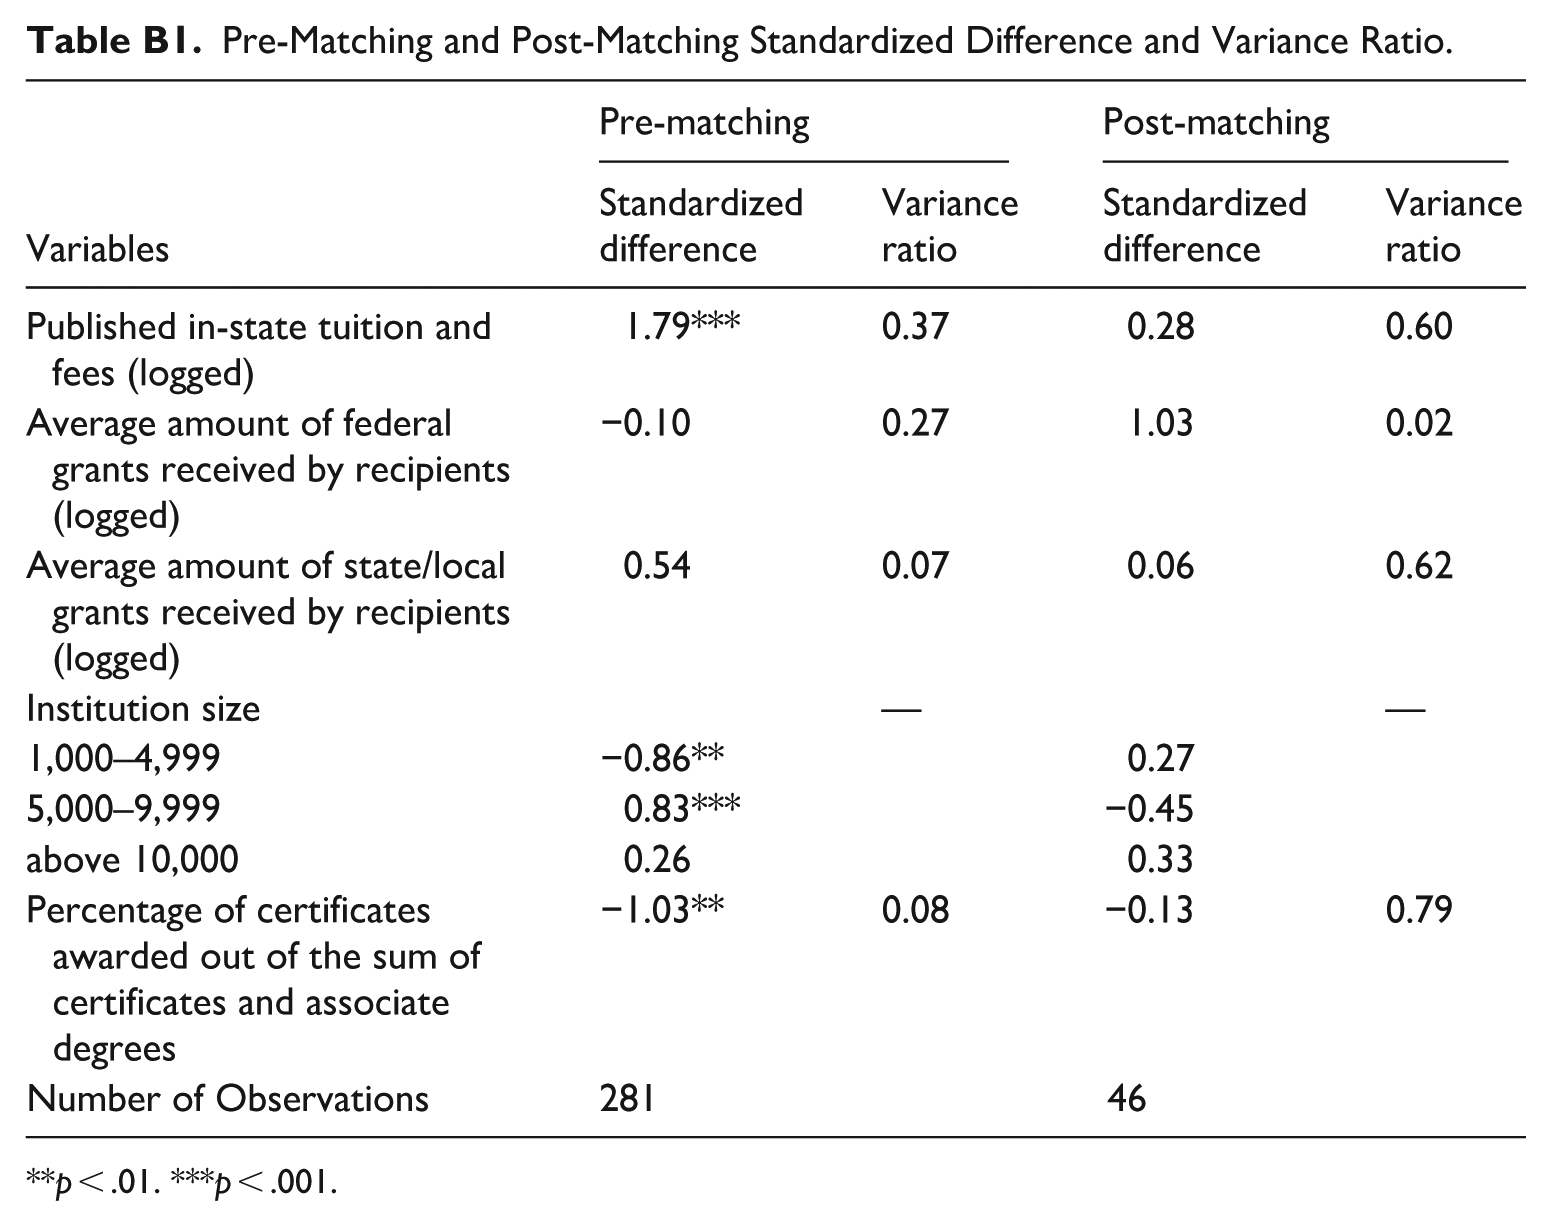
To ensure the community colleges in the untreated groups were comparable to the treated community colleges in New Jersey, we created a third comparison group from the pool of 262 public 2-year institutions identified above. We used propensity score matching to identify 28 community colleges in 10 states based on institution-level variables (n = 588). Given the small sample size of treated colleges, we used nearest neighbor matching algorithm with replacement and one-to-five matching ratio to achieve better covariate balance between the treated and untreated groups (Bottigliengo et al., 2021; Cenzer et al., 2020; Guo & Fraser, 2015). We followed suggestions by Pirracchio et al. (2012) and Stuart (2010) to prioritize covariates associated with the dependent variables. Specifically, we used logit models to estimate propensity scores, which represent the probability of treatment assignment given observed institution-level covariates as mentioned above. The estimated propensity scores were then used to match treated and untreated units to reduce confounding bias between treatment and untreated groups. Table 2 presents the descriptive summary of all variables, and Appendix B provides more details on the reduction in bias achieved through matching.
Descriptive Summary of All Variables.

Note. Standard deviation in parenthesis. All dollar amounts in 2021 constant dollars. FTFT = first-time full-time.
Analytic Strategy
To estimate the average treatment effect of STARS adoption (STARS in 2004-05 and STARS II in 2006-07) on eligible cohorts’ community college enrollment, associate degree completion, and non-completion transfer-out, we used a difference-in-differences (DD) model to compare the difference in the outcomes between treated and untreated units after STARS adoption and then subtract the difference in outcomes before STARS adoption (Furquim et al., 2020). Formally, we used ordinary least squares (OLS) regression in the model, holding covariates constant:

where
Additionally, we conducted a series of event studies for all comparison groups to examine the presence of pre-treatment trends and identify year-by-year treatment effects (Miller, 2023). Following Clarke and Tapia-Schythe’s (2021) suggestions, we used the Stata command eventdd and included a series of binary variables denoting leads and lags of STARS adoption, ranging from 3 years before treatment to 5 years after treatment. We again controlled for fixed effects and estimated standard errors clustered by institutions. Different from the DD approach, the results from the event study enable us to discern whether the changes in each dependent variable (i.e., enrollment, associate degree completion, non-completion transfer-out) varied over time after the adoption of STARS.
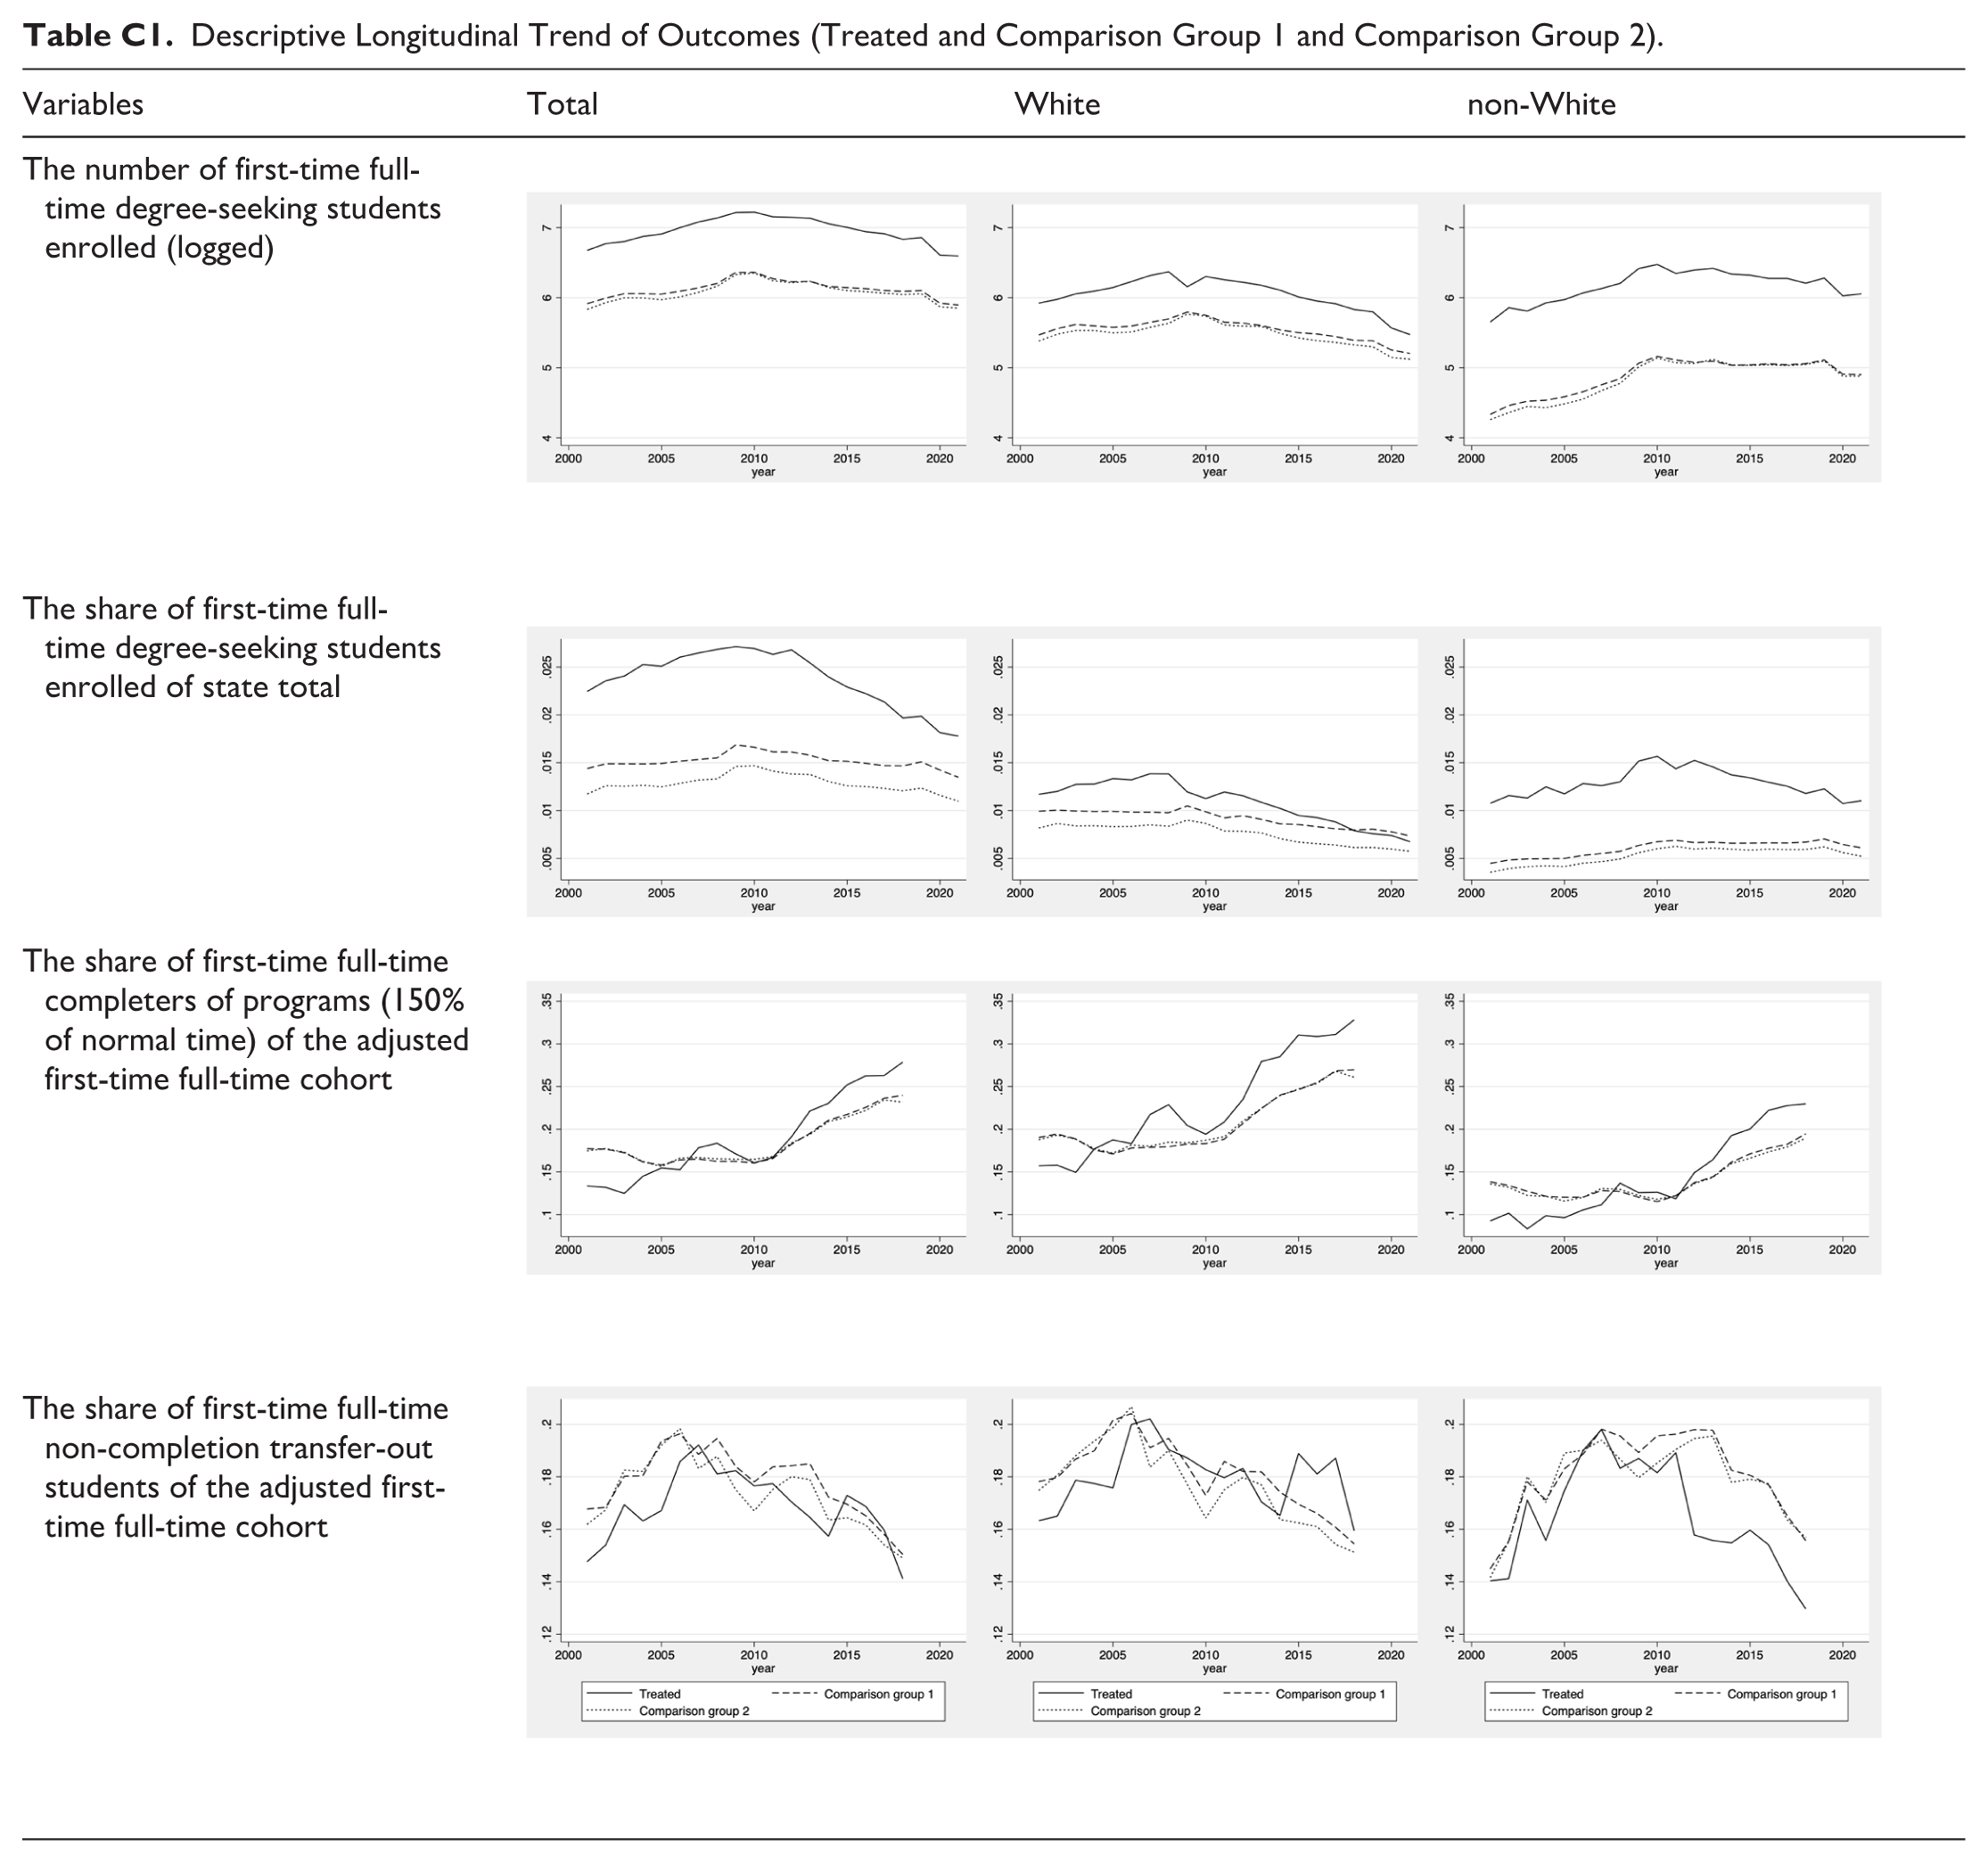
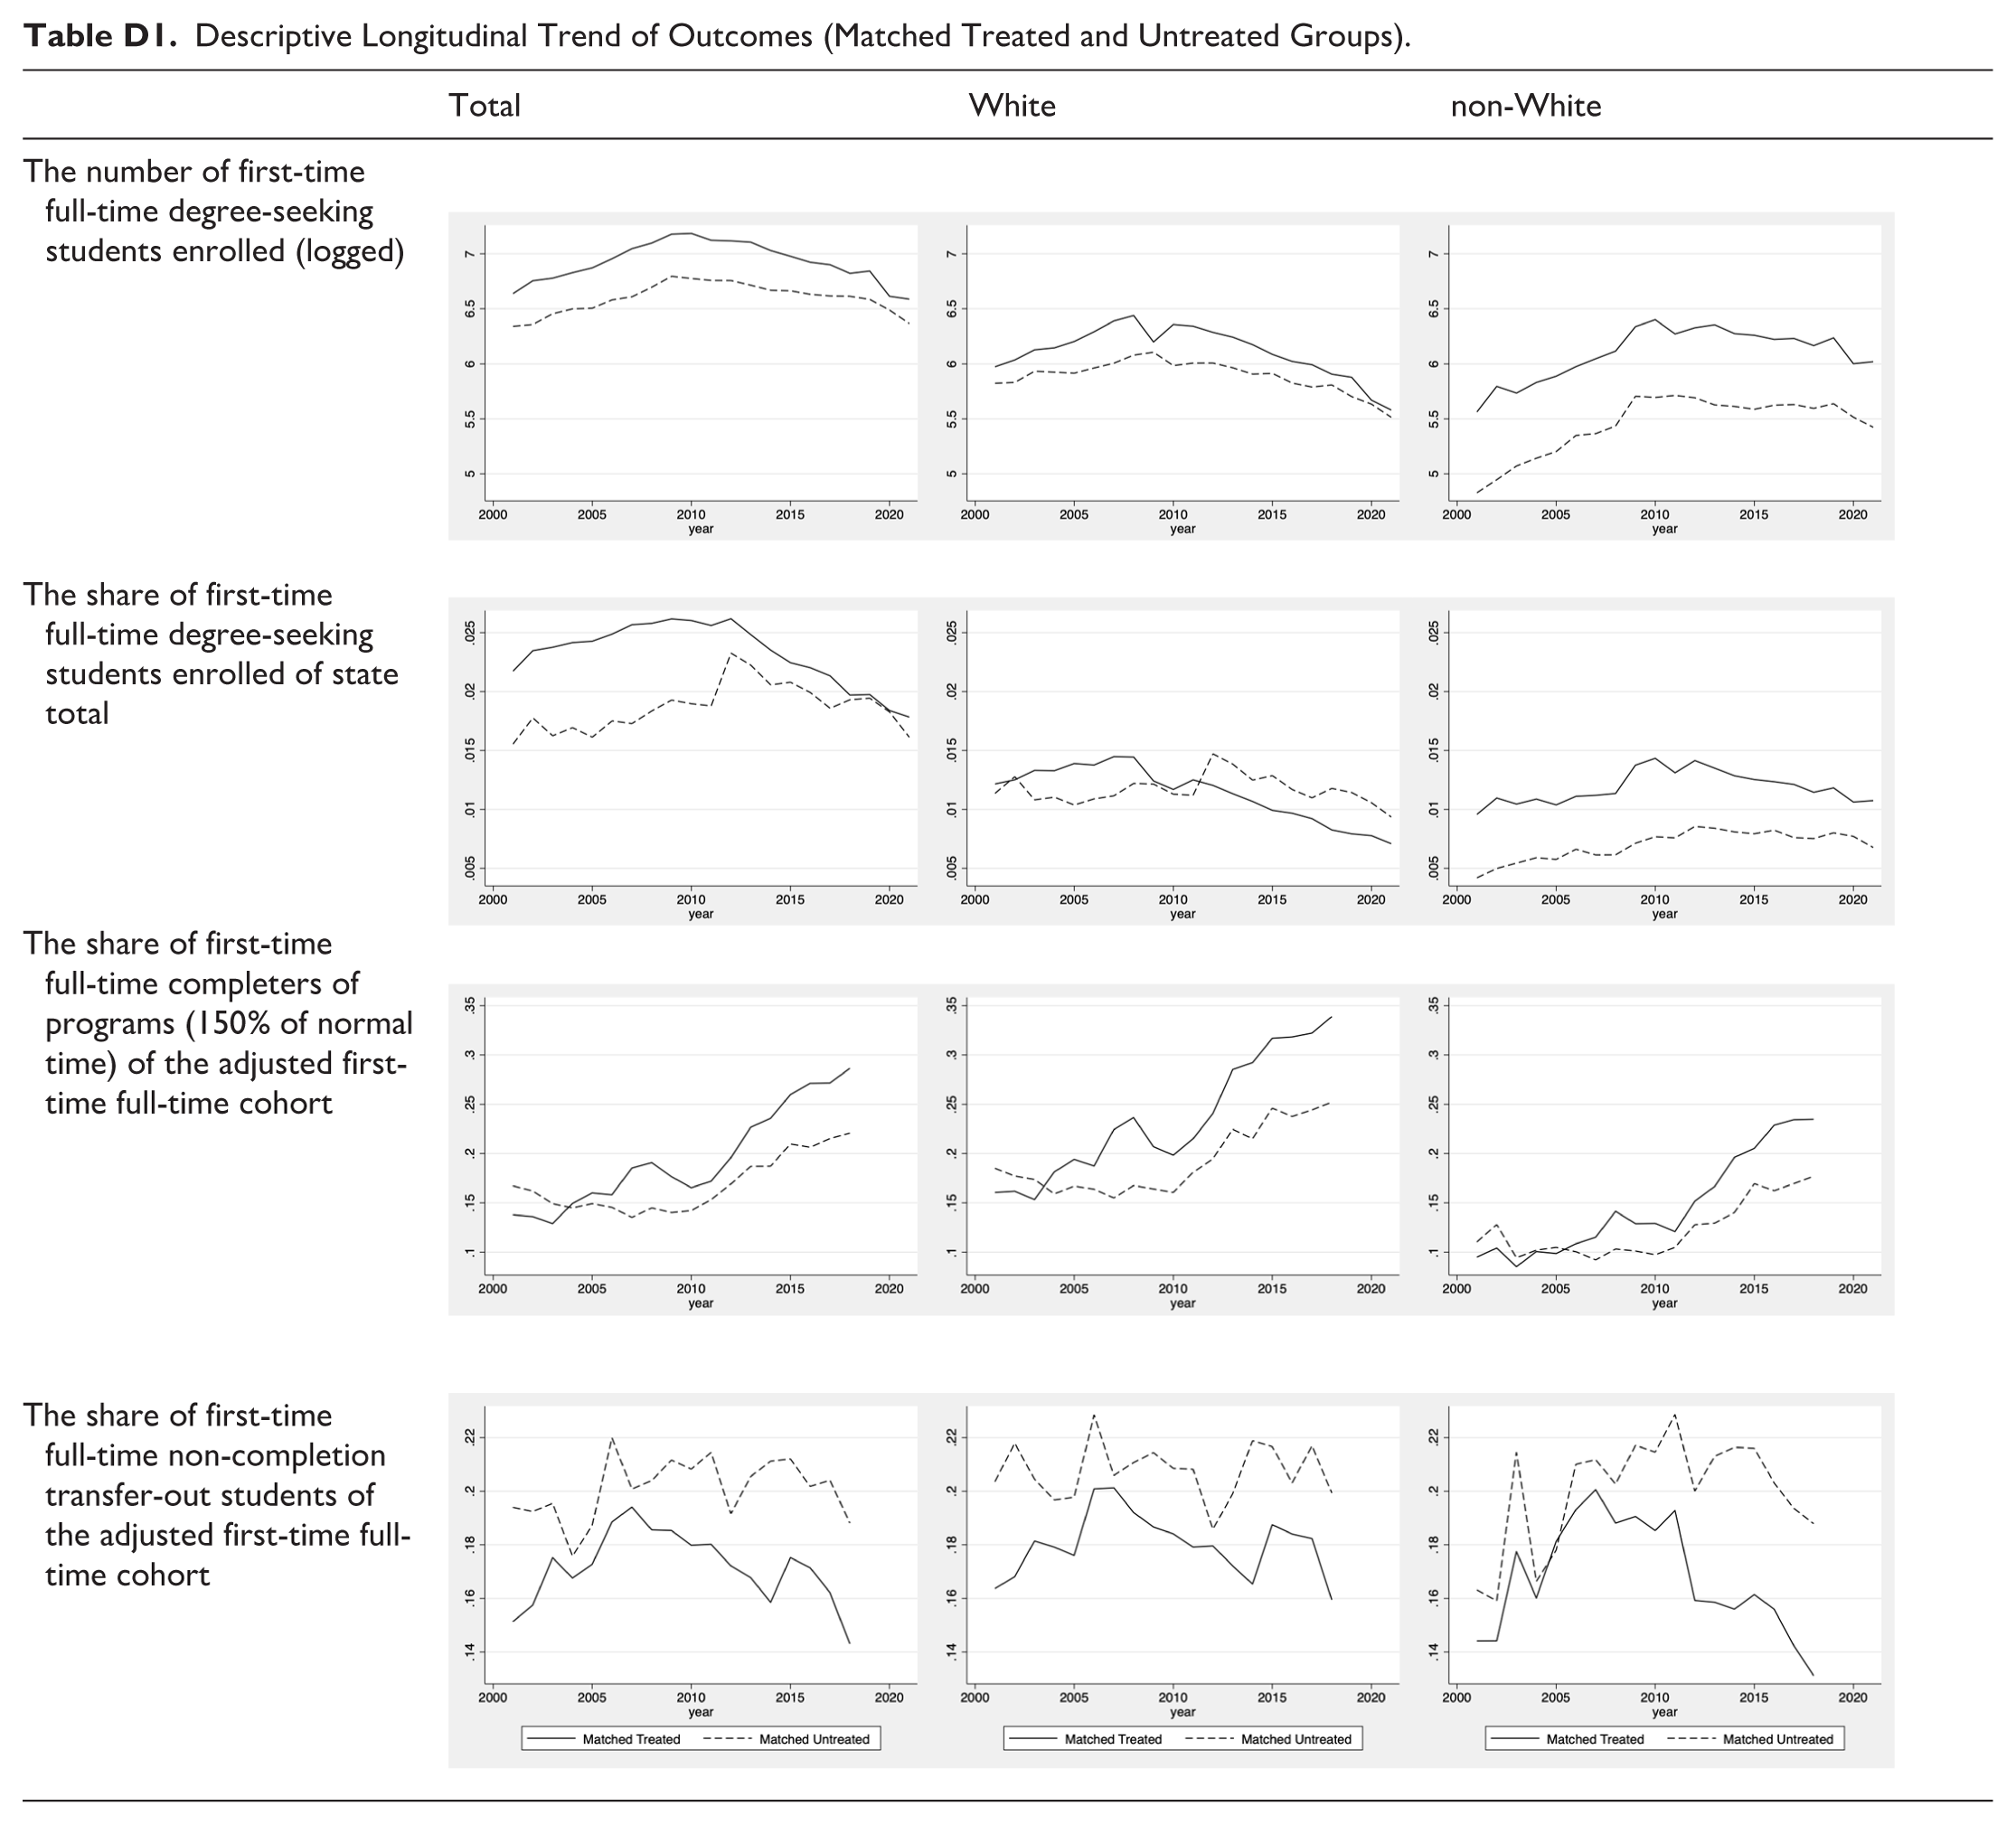
The most important identifying assumption for the DD approach was that there were fixed, time-invariant differences across groups and that treatment was the only factor altering these differences over time (Furquim et al., 2020). Tables C1 and D1 examined this assumption by showing the trends of outcome variables among the treatment and comparison groups. Similar pre-treatment trends were found, in general, suggesting that the parallel assumption was met, and it was appropriate to use DD estimation. Additionally, the event study findings and plots (more detailed discussion in the Results section) indicated that the years leading up to treatment were parallel and not statistically significant, giving some confidence that the parallel trends assumption was met.
Limitations
IPEDS data measured community college entering cohorts’ outcomes 3 years after their matriculation. However, only about 30% of community college students received any postsecondary credential at their starting institution within 6 years, and the persistence rates varied based on student race and ethnicity (Shapiro et al., 2018). It is possible that STARS Programs may have shortened students’ time-to-degree, but the average treatment effect was not detected by 3-year completion outcomes. Future research should examine STARS Programs’ influence on students’ credential completion outcomes (e.g., 6-year completion, time to degree) by racial and income groups beyond 3 years after their matriculation.
Additionally, non-completion transfer-out only captured the number of students who did not receive any postsecondary credential before enrolling at a different institution, and it could simultaneously include baccalaureate-aspiring upward transfer students and undecided swirling students who transfer laterally. Yet, these students could have transferred out of a community college without any postsecondary credentials for very different reasons. Ideally, the average treatment effect of STARS Programs can be best analyzed with data capturing the number of transfer students who have earned an associate degree with a 3.25 GPA and gain admission to a New Jersey 4-year public university, because that is the targeted population for STARS II. While IPEDS started to capture transfer-in student enrollment in Fall 2006, this data point was not available before STARS was in place to allow DD analyses on whether STARS increased the number of transfer-in students at public 4-year institutions in New Jersey. States and institutions can use administrative records to track student progress across sectors and qualitative approaches to document the influence of STARS programs with additional details.
Another limitation when examining disparities in academic outcomes between racial groups was that certain racial and ethnic groups were underrepresented in postsecondary education, making it difficult to disaggregate the groups and still meet statistical assumptions required to generate reliable estimates due to high variability. For example, over a quarter of observations in the sample had no students identified as Asian American and Pacific Islander, which was also an aggregated group, enrolled as full-time first-time students. Combining students of color into one group allowed us to detect broad patterns of inequality noted by previous research on merit aid’s regressive nature to benefit White students (e.g., Brown, 2007; Dynarski, 2000; Heller & Rasmussen, 2001). Though this aggregation can mask important differences between subgroups, it provided a practical solution to ensure robust analysis and to reflect experience shared across many racial minority student groups. We acknowledge the challenge of balancing analytical feasibility with the need for equity-focused understanding of financial aid programs and call for qualitative insights and the use of more inclusive datasets in future studies.
Finally, the focus of the study was on the design of state-funded merit-aid programs for community college students instead of comparing merit-based aid against need-based aid. We excluded states with no merit aid between 2001 and 2021. These excluded states typically distribute all state-funded grants and scholarships based on community college students’ financial needs with different ideologies on supporting community college student access and success (Perna et al., 2017). Therefore, we acknowledge that this study’s findings cannot offer insights for understanding the relative influence of merit-based versus need-based financial aid. Instead, we specifically examined the influence of a unique merit-aid program focused on community college students, aiming to inform merit-based aid policymaking by comparing the influence of STARS to other merit-based aid policy designs.
Results
Descriptively, Table 2 shows that the number and share of FTFT enrollment and associate degree completion for New Jersey community colleges are consistently higher than the averages for each of the three comparison groups, while the share of non-completion transfer-out has been consistently lower than each comparison group. We present the DD and event study results below by research question.
DD Results on Community College Enrollment
The DD findings in Table 3 indicated that New Jersey’s STARS program adoption was positively associated with the total number of FTFT students enrolled, especially for White students. In the log-level models, relative to community colleges in other merit-aid states, the number of total and White FTFT students enrolled at New Jersey community colleges increased by 18.2% to 19.8% and by 27.4% to 29.4% (p < .01), respectively after STARS adoption. However, no statistically significant relationship was found with the matched sample. There is also no evidence of the relationship between STARS adoption and the share of FTFT students community colleges enrolled, suggesting no enrollment shifting from other sectors to community colleges.
Coefficients of STARS Program Adoption on Community College Enrollment.
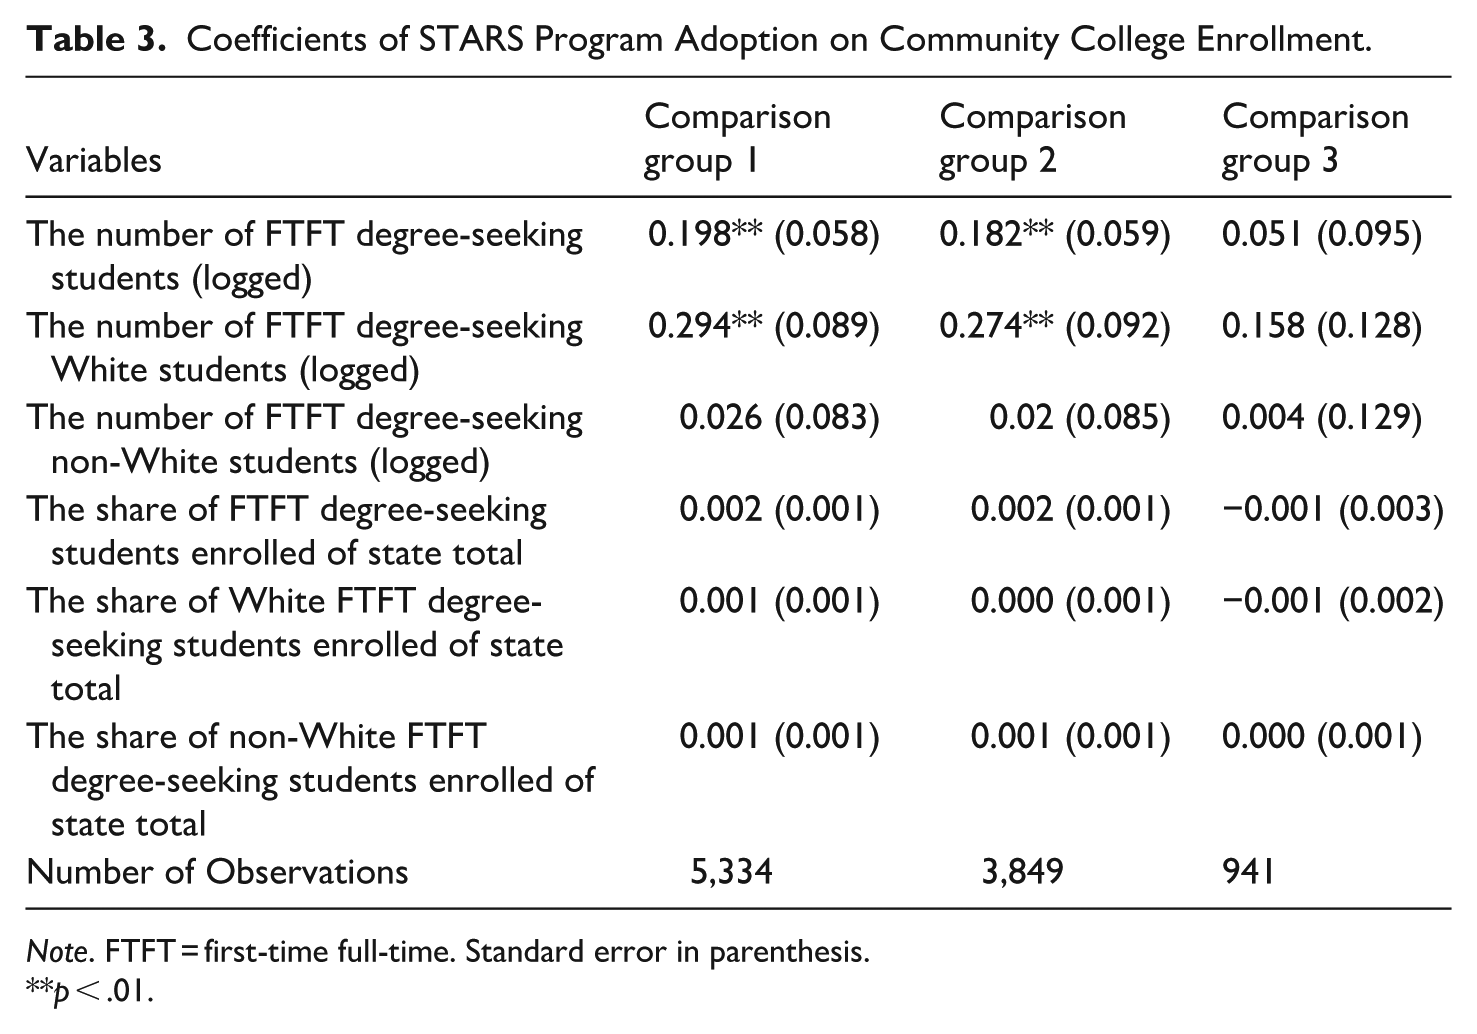
Note. FTFT = first-time full-time. Standard error in parenthesis.
**p < .01.
DD Results on Community College Completion and Transfer-Out
Results consistently revealed a positive relationship between STARS adoption and associate degree completion for White students (Table 4 Panel A). Compared to community colleges that were not eligible for STARS programs, the share of White FTFT 2-year program completers within 150% of normal time was between 2.7 and 4.2 percentage points higher for New Jersey’s community colleges after STARS adoption (p < .01). We did not find consistent results between STARS adoption and associate degree completion for the FTFT cohort or non-White students. Additionally, no significant relationship was found between STARS adoption and non-completion transfer-out after 3 years of college matriculation (Table 4 Panel B).
Coefficients of STARS Program Adoption on Community College Completion and Transfer-Out.
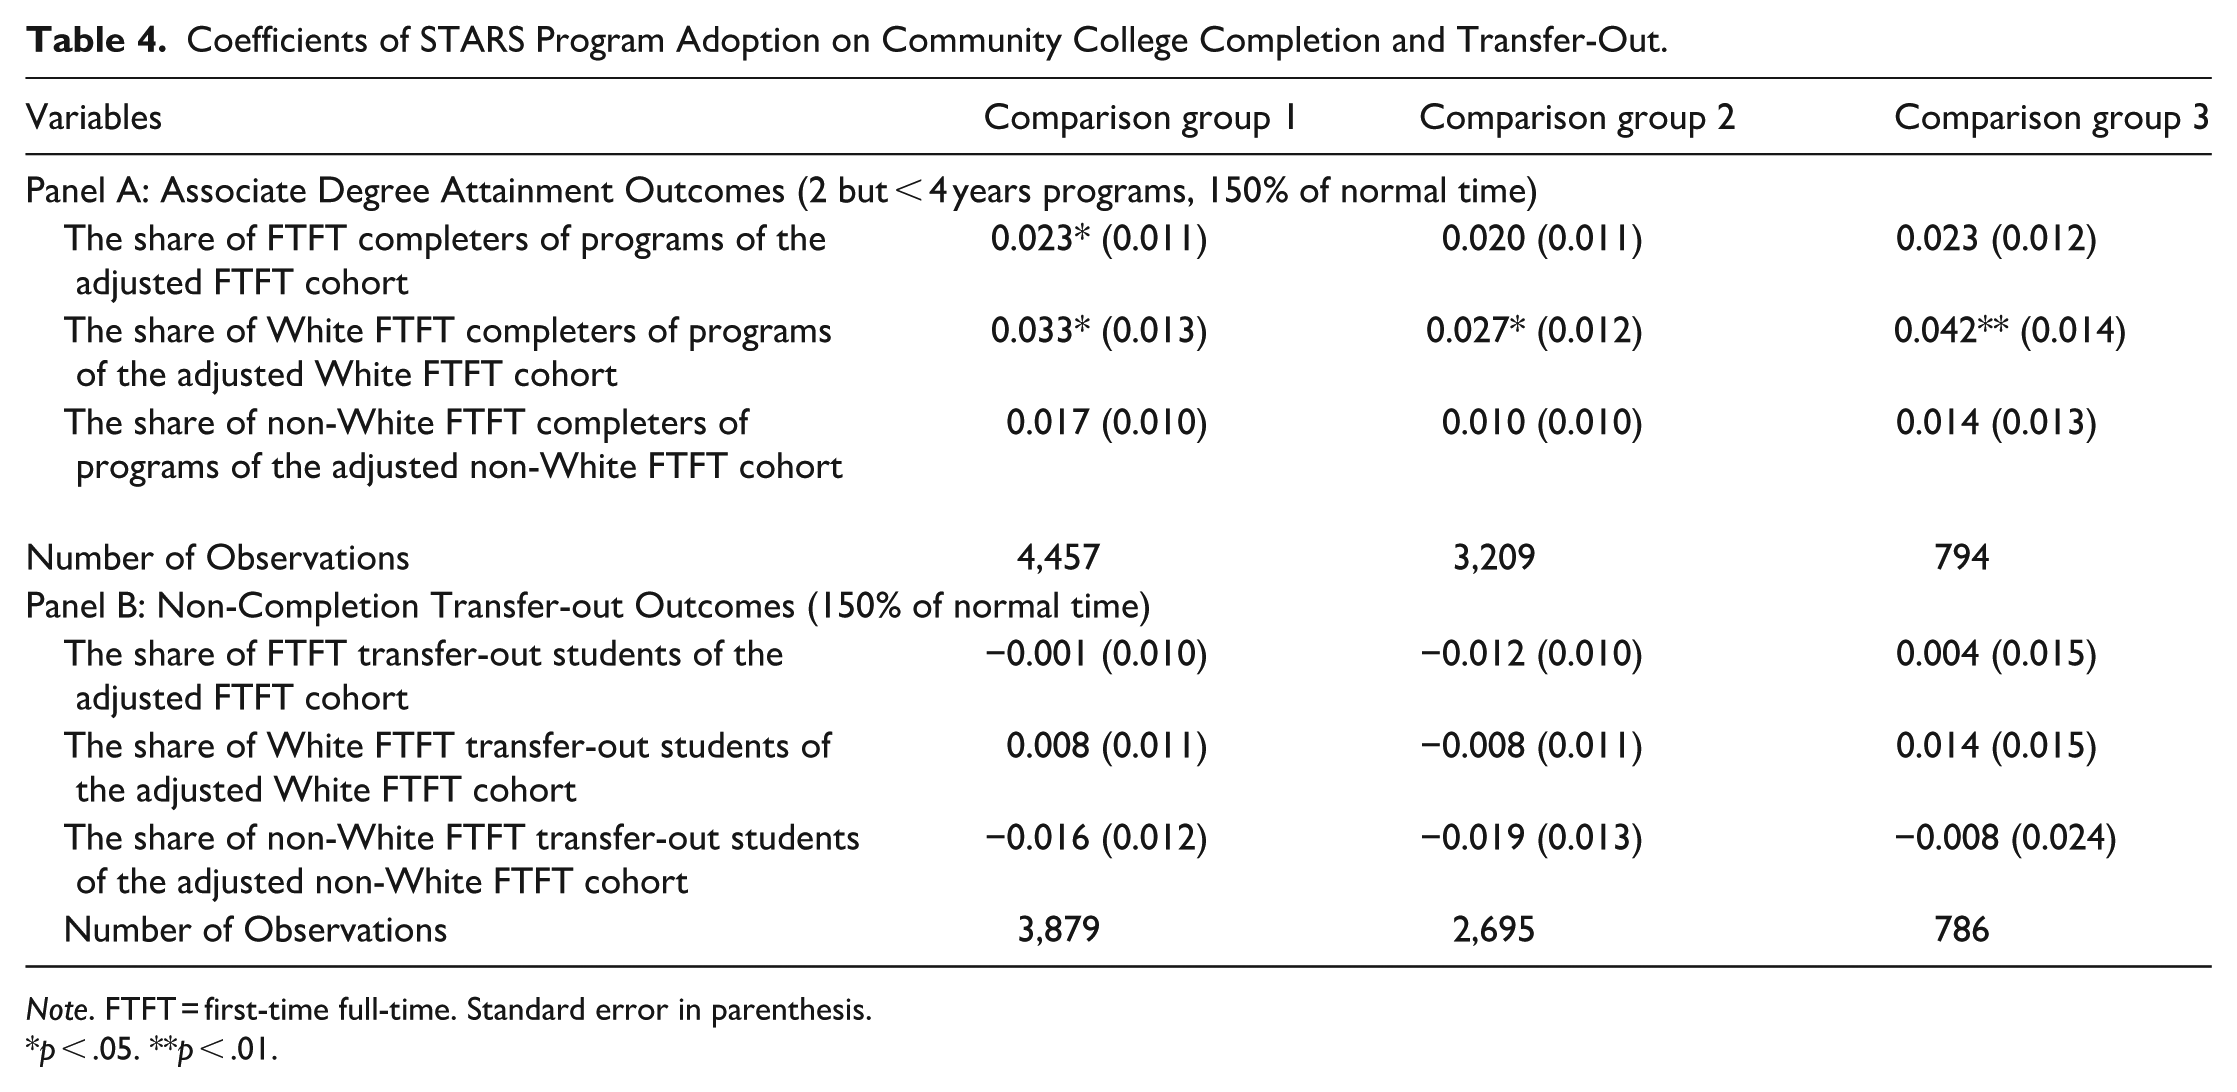
Note. FTFT = first-time full-time. Standard error in parenthesis.
p < .05. **p < .01.
Event Study Results on Community College Enrollment
The event study results were largely consistent with our DD analyses and provide additional evidence on the influence of STARS program adoption on community college outcomes over time after the adoption of STARS. To be conservative with our findings, we focused on event study results that were statistically significant for at least 2 years post-treatment. Table 5 Panel A presents the relationship between STARS Adoption and the (logged) number of FTFT degree-seeking students enrolled. There was evidence of a positive relationship between STARS adoption and total FTFT student enrollment relative to comparison group 1 (i.e., community colleges in states with other types of merit-aid policy) and comparison group 2 (i.e., community colleges in states with only Community College Marginalizing merit-aid policy). However, when using a matched comparison group, event study estimates were generally not significant for total FTFT enrollment in the treated colleges in New Jersey.
Coefficients of Event Study for STARS Adoption on Community College Enrollment.
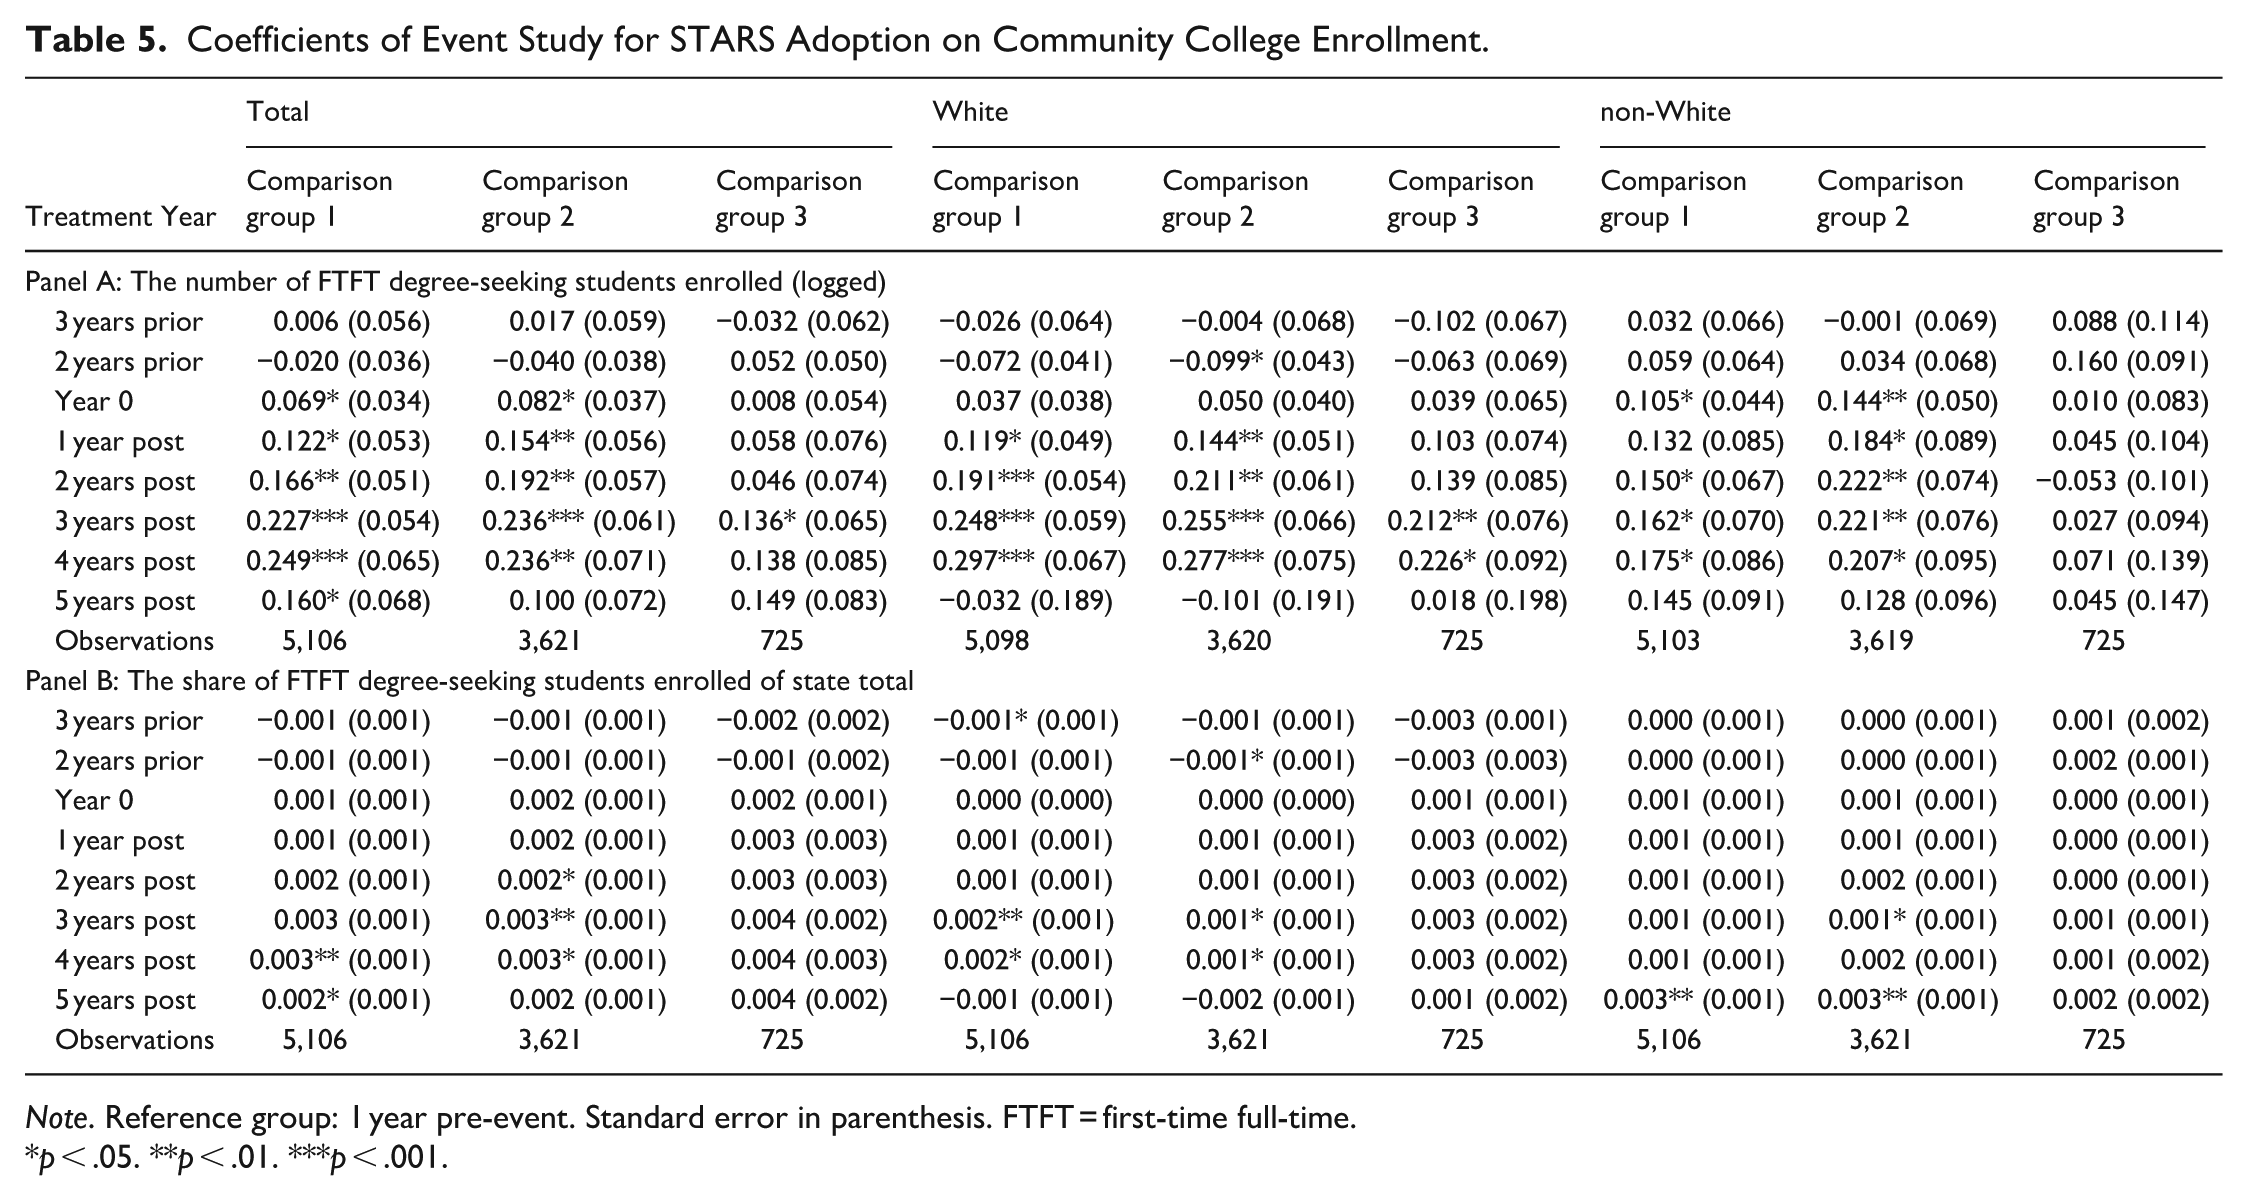
Note. Reference group: 1 year pre-event. Standard error in parenthesis. FTFT = first-time full-time.
p < .05. **p < .01. ***p < .001.
It is worth noting that, the event study analysis contradicts the DD analysis and provides evidence of an increase in the number of FTFT White students enrolled at New Jersey’s community colleges following the adoption of STARS, with a significant increase observed by 21.2% to 25.5% 3 years (p < .01) and by 22.6% to 29.7% 4 years (p < .05) following treatment. This inconsistency between DD and event study analyses suggested the importance of examining the average treatment effect over time after the adoption of STARS, in addition to the aggregated treatment effect post-treatment. The event study results suggested that, while the average treatment effect was not statistically significant after the treatment as indicated by the DD results, when the treatment effect was unpacked by year using an event study, the STARS program seemed to be positively related to the number of White students enrolled 3 and 4 years after STARS adoption. The null findings for non-White student enrollment after STARS program adoption were consistent between DD and event study results.
Similar to our DD findings, there was not a statistically significant relationship between STARS adoption and the share of FTFT students who enrolled at New Jersey community colleges (Table 5 Panel B). In other words, the event study analysis did not yield any evidence of enrollment shift across higher education sectors.
Event Study Results on Community College Completion and Transfer-Out
The event study findings, as presented in Table 6, consistently suggested an increase in the share of FTFT students who completed a credential (from 2-year but less-than-4-year programs) within 150% of normal time following the adoption of STARS in 2004-05, with significant increase observed by 2.0 to 2.8 percentage points for the 2004 entering cohort (p < .05), 2.9 to 4.3 percentage points for the 2005 entering cohort (p < .05), and 5.2 to 6.3 percentage points for the 2007 entering cohort (p < .001). Consistent with the DD findings, this positive relationship was focused among White students but not among non-White students: The share of FTFT White completers out of the adjusted cohort of White students experienced a larger increase following the adoption of STARS in 2004-05, with significant increase observed by 3.5 to 3.9 percentage points for the 2004 entering cohort (p < .01), 4.7 to 5.1 percentage points in for the 2005 entering cohort (p < .01), 3.7 to 4.0 percentage points for the 2006 entering cohort (p < .05), and 6.7 to 8.2 percentage points for the 2007 entering cohort (p < .001). Similar to our DD findings, no significant relationship was found between STARS adoption and non-completion transfer-out within 150% of normal time (Table 7).
Coefficients of Event Study for STARS Adoption on Community College Completion.
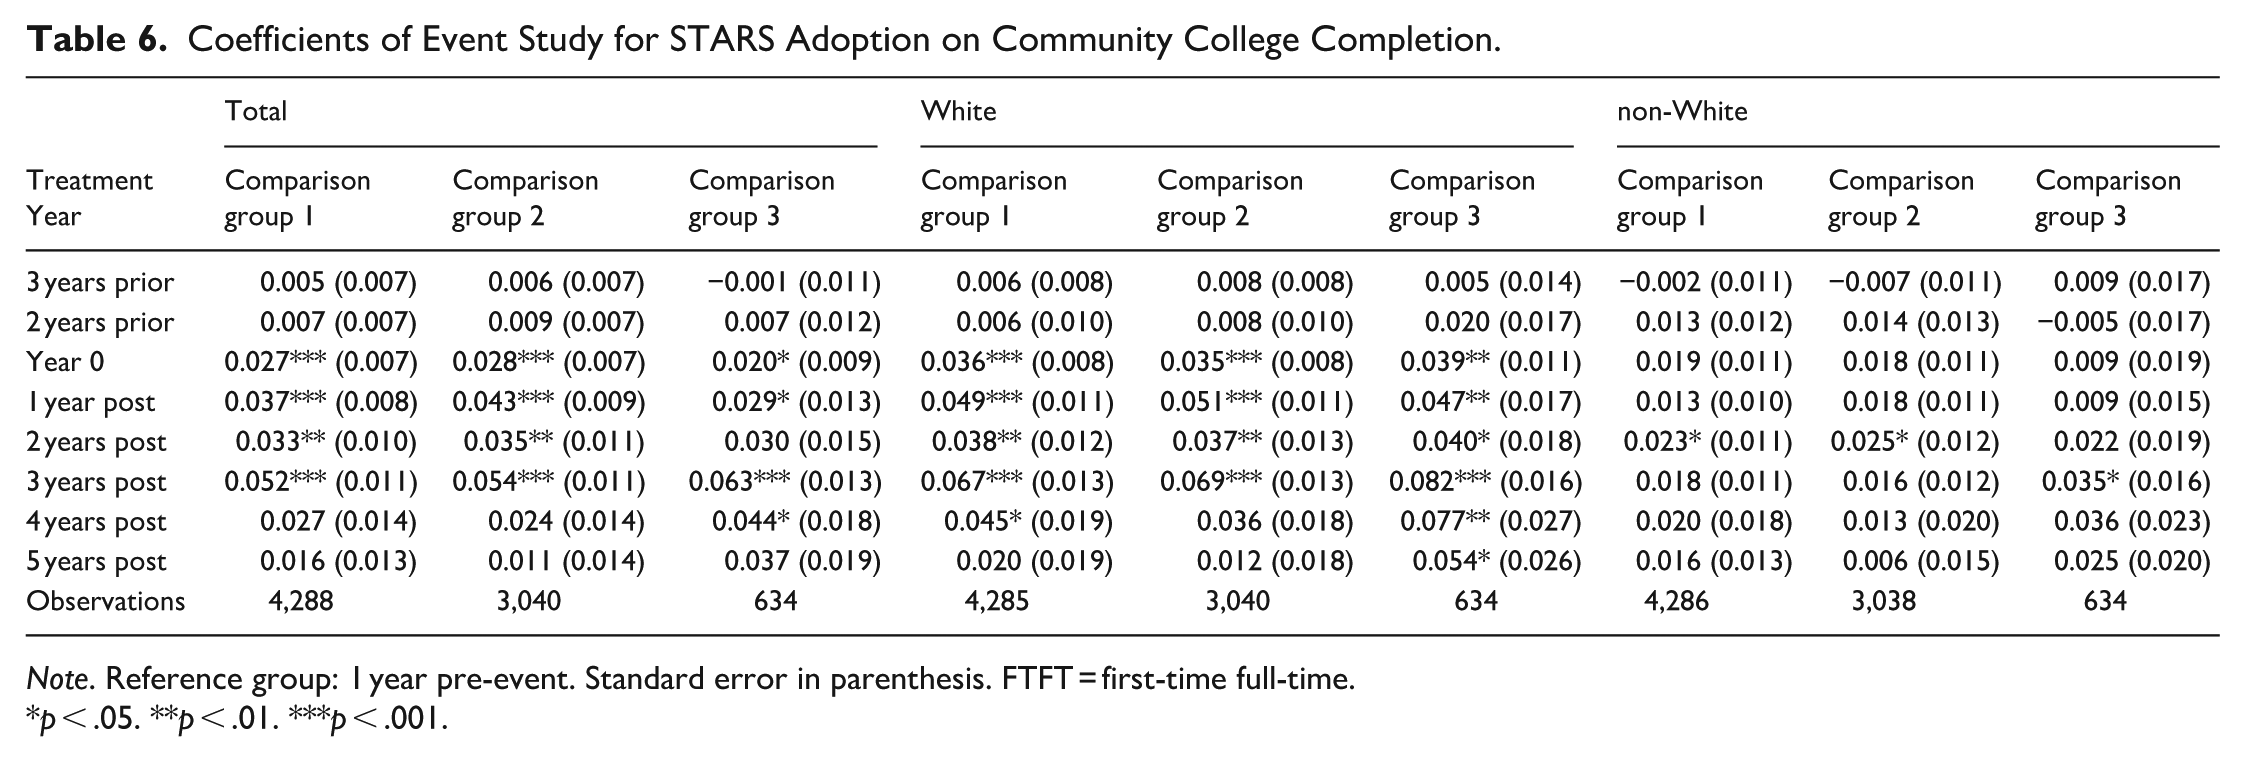
Note. Reference group: 1 year pre-event. Standard error in parenthesis. FTFT = first-time full-time.
p < .05. **p < .01. ***p < .001.
Coefficients of Event Study for STARS Adoption on Community College Transfer-Out.
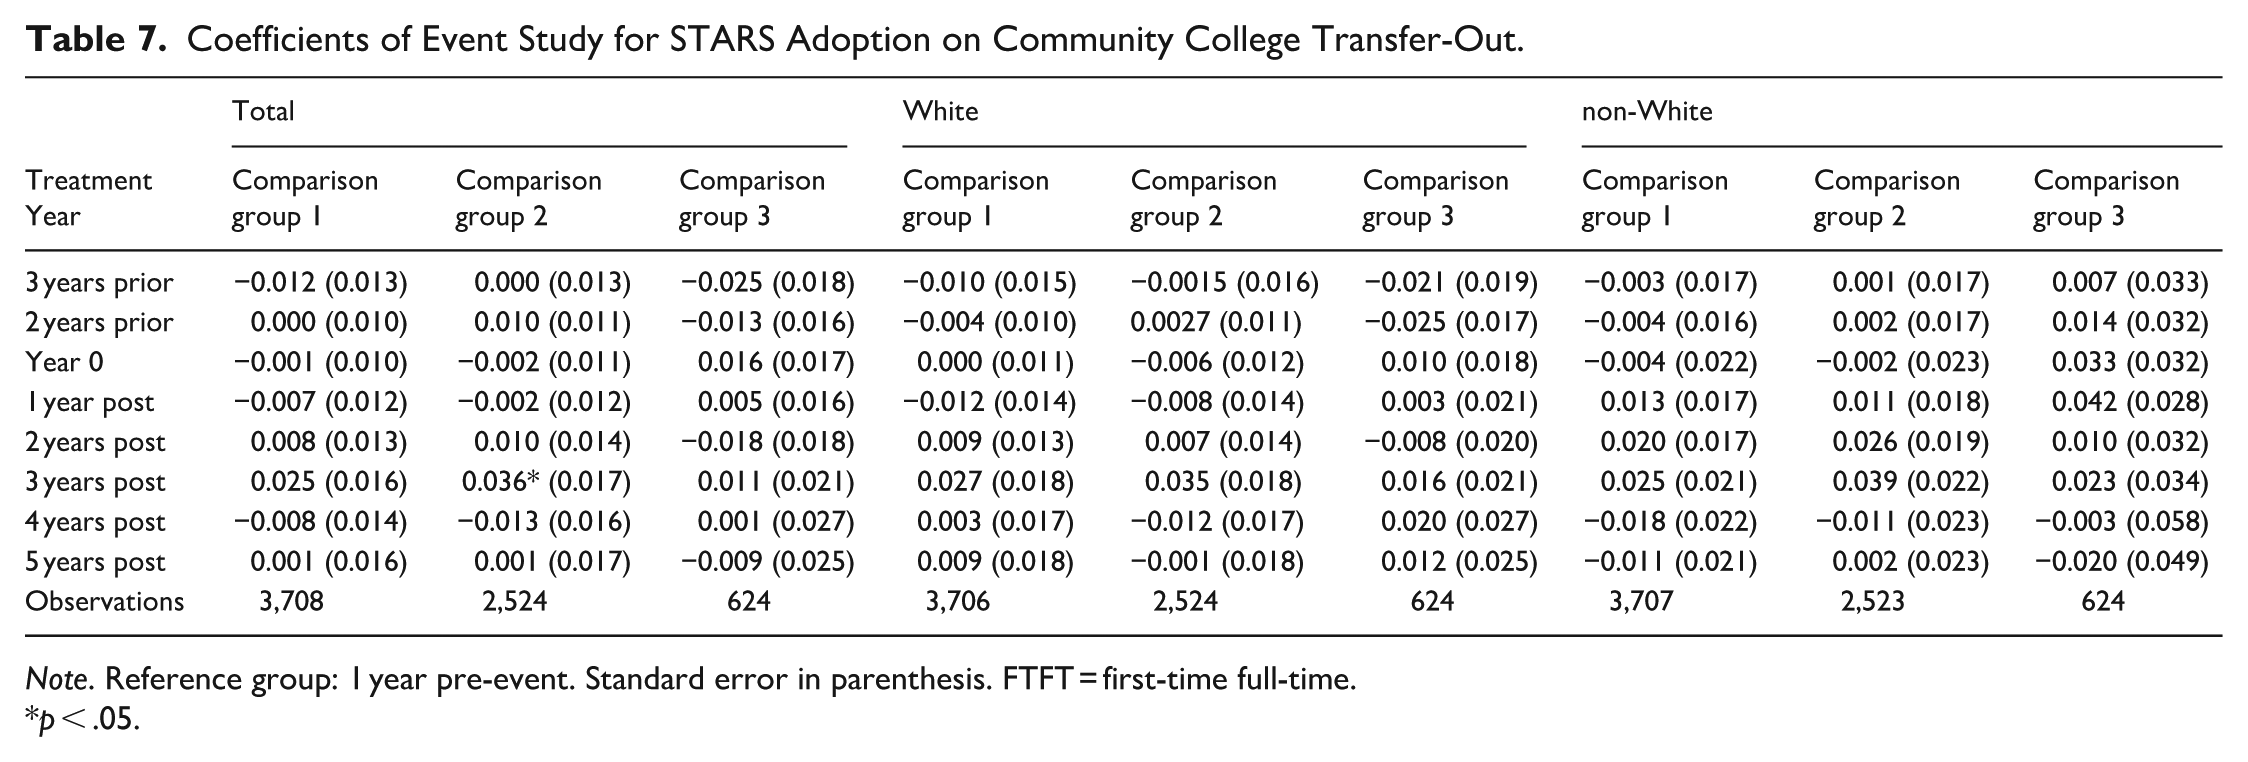
Note. Reference group: 1 year pre-event. Standard error in parenthesis. FTFT = first-time full-time.
p < .05.
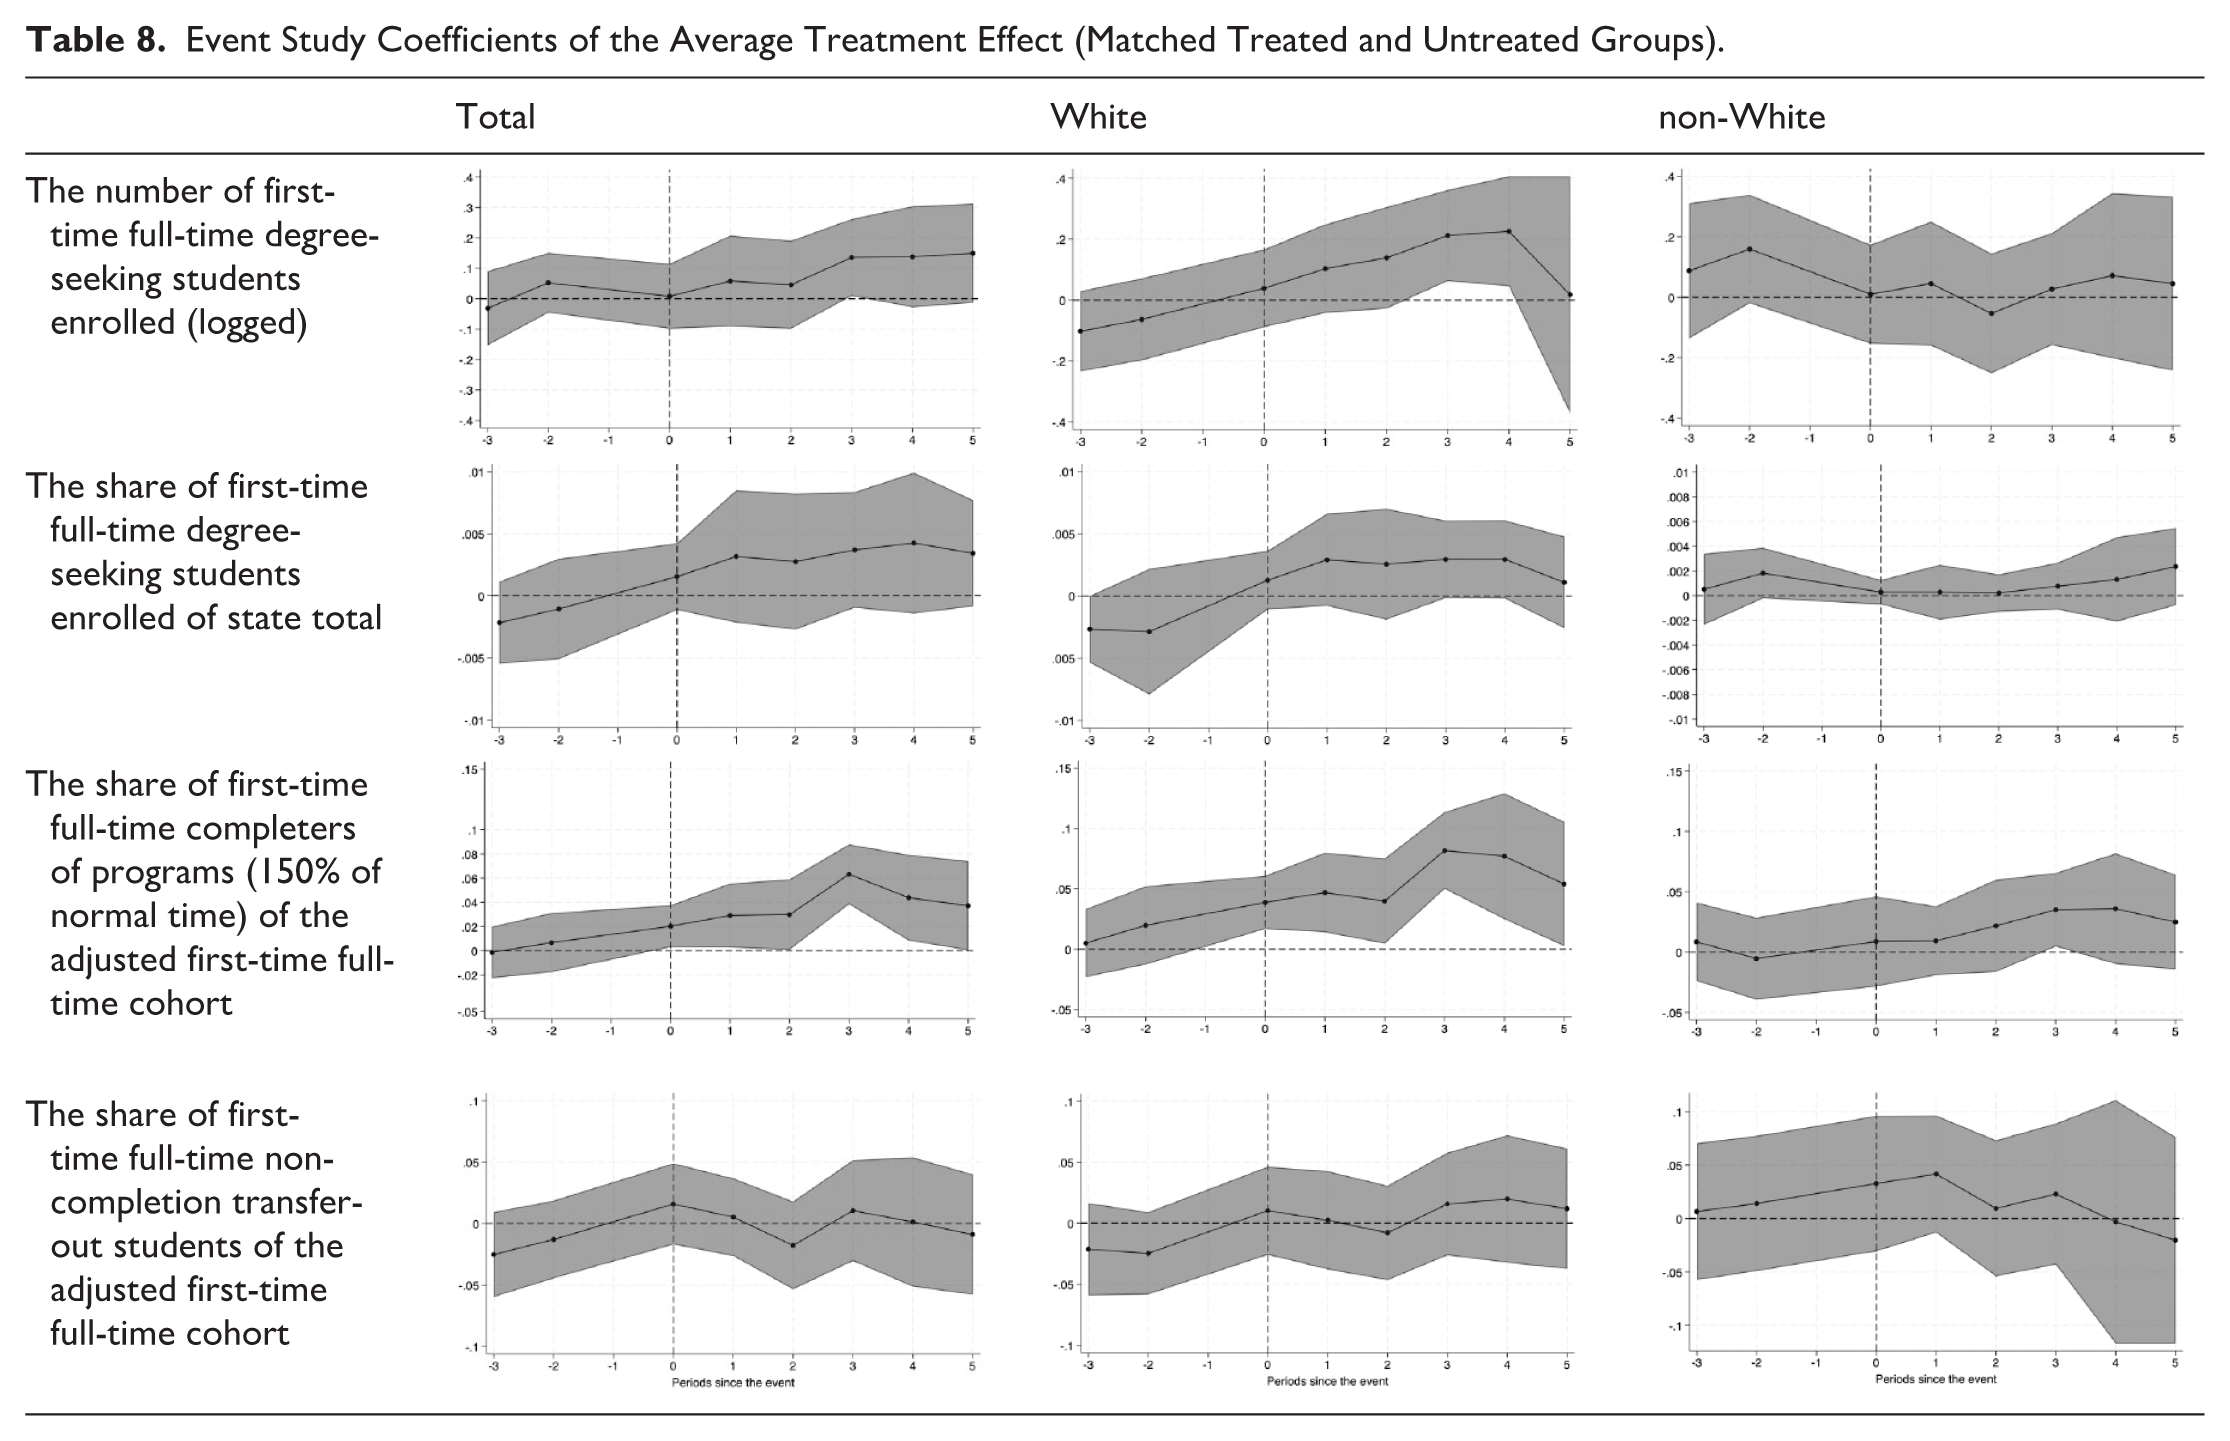
In Table 8, we graphed the event-study plots for the matched comparison group across all pre- and post-treatment years, with the plotted dot representing the point estimate and the bands around the point estimate showing 95% confidence intervals. Each plot showed the estimated differences in all leads and lags in the outcome between treated and control colleges, compared to the prevailing differences in the baseline period (i.e., the year immediately preceding adoption). Specifically, Table 8 demonstrated that the number of FTFT students enrolled (total and White) showed a significant increase in the third year after STARS adoption. For the share of FTFT completers (total and White), we saw significant upticks in year 3. The event studies for other outcomes generally showed that during each of the post-treatment years, the outcomes between the treated and matched control groups were null. As mentioned earlier, we placed the most credibility on results that were consistent across the two methods to answer our research questions: New Jersey’s STARS programs increased White students’ enrollment in community colleges, without siphoning off enrollments from other higher education sectors, relative to community colleges in states with merit-aid programs that disproportionately favored 4-year college students. Additionally, STARS programs increased students’ associate degree completion, especially for White students, but we did not find the same relationship for non-White students. Finally, we did not find any evidence that STARS reduced students transferring out of community college before completing credentials.
Event Study Coefficients of the Average Treatment Effect (Matched Treated and Untreated Groups)..
Discussion
As states have shifted the bulk of student aid dollars from need-based to merit-based programs, too few of those merit-based dollars go to community college students. Even when community college students are eligible to apply for merit-aid grants, they only receive a small portion of the overall value of awards. In this study, we considered whether a unique merit-aid policy design the state of New Jersey adopted in 2004 influences community college outcomes. Specifically, we applied an innovative typology of state-funded merit-aid programs (Hu et al., 2024) to consider whether community college outcomes vary based on whether state merit-aid policies center community colleges and their students.
We found that New Jersey’s STARS programs, a policy approach that was designed to benefit community college students, increased White students and the total overall student enrollment in community colleges relative to community colleges in states with merit-aid programs that disproportionately favor 4-year college students. However, we did not find the same relationship for non-White students. Therefore, it may be that the increase in overall student enrollment is driven by rising White student enrollment. Consistent with the findings from Nguyen (2019) on New York’s tuition-free programs, we did not find any evidence that the enrollment increase was the result of community colleges siphoning off enrollments from other higher education sectors. Similarly, we found that White student completions increased after STARS adoption, but we did not find any evidence that completions increased for the overall cohort or non-White students. Finally, we did not find any evidence that STARS reduced students transferring out of community college before completing credentials. Across different analytical approaches, we found evidence in support of our first and second hypotheses—although gains were likely focused among White students. Contrary to our third hypothesis, we did not find any evidence that STARS decreased the number of students transferring-out without earning credentials.
Future research should continue to examine whether merit-aid policy designs can equitably support community college student outcomes. Community colleges sit at the intersection of American beliefs that higher education can broadly offer social mobility, while also rewarding merit (Labaree, 1990). Through the transfer function, community colleges can allow fluid movement between 2- and 4-year colleges, while also protecting the distinctiveness of 2- and 4-year systems of higher education (Brint & Karabel, 1989). The community college is “an essential expression” (Brint & Karabel, 1989, p. 725) of what Americans hope to see from public higher education, however contradictory those aims may be (Labaree, 1990). As Schudde and Goldrick-Rab (2015) recommended, this study builds on the sociological tradition of studying community colleges by examining one mechanism that might influence enrollment, credential attainment, and transfer rates and how they vary by race. We suggest that even merit-aid policies that are designed to focus on community college students, do not ameliorate critiques of how community colleges preserve privilege and perpetuate inequities in US higher education.
Researchers should also aim to differentiate the influence of merit-based and need-based aid programs as mechanisms that may influence community college student outcomes. While our analyses provide findings about the influence of state policy on aggregate institution-level outcomes, future work would, ideally, leverage student-level data, including data that disaggregate by race and that record whether students benefited from STARS I and STARS II. For instance, it would be helpful to have longitudinal data that track students who benefited from both STARS I and STARS II to follow their progress and outcomes associated with transferring to 4-year institutions (e.g., time-to-degree, indebtedness). Such studies should move beyond our simple binary (White vs. non-White) by taking a QuantCrit approach to further examine the centrality of racism as endemic within U.S. higher education and interrogating how racial data are categorized (e.g., Castillo & Gillborn, 2023; Fong & Irizarry, 2025; Gillborn et al., 2018). QuantCrit approaches that disaggregate across multiple racial groups and social statuses would further add to our understanding of how community policy mechanisms can “produce differential transfer rates and degree attainment across socioeconomic status and race” (Schudde & Goldrick-Rab, 2015, p. 39).
Our findings have important implications for state policymakers. Among the various classes of state-funded merit-based financial aid programs, our results suggest that a community college targeted policy design (e.g., Hu et al., 2024) did influence enrollment and completion, relative to merit-aid programs that disproportionately favor 4-year college students. Among other scholarly work that challenges policymakers to question assumptions about community colleges and merit and to distribute resources to better support community college students (e.g., Schudde & Goldrick-Rab, 2015), this study offers empirical evidence to suggest that merit-aid policy can be designed to increase overall college enrollment (and not just shift students among higher education sectors) and college attainment.
The null relationship between New Jersey’s STARS programs and students’ non-completion transfer-out can probably be attributed to a few factors. Only about 10% of community college students transfer to a 4-year institution with any credential over a period of 6 years (Shapiro et al., 2017), so the number of transfer students who have earned an associate degree with a 3.25 GPA and gain admission to a New Jersey 4-year public university may be a fraction compared to the number of non-credential transfer-out students, which IPEDS was able to capture at the institution level. Despite its community college focus, New Jersey’s STARS programs only offer $1,250 per semester to students post-transfer, and it is likely not enough to influence students’ transfer behaviors. Because the generosity of merit-aid programs can incentivize students to enroll in more selective institutions (Domina, 2014), policymakers and campus leaders should work together to develop—and fund—new approaches to support students’ upward transfer goals. Considering how the upward transfer pathways and complex financial aid packages can penalize community college students in educational aspirations, bachelor’s degree attainment, and labor market outcomes (Broton, 2019; Kopko & Crosta, 2016; Mountjoy, 2022), policymakers in states with merit-aid programs should work with researchers to further analyze and improve their programs to align with transfer articulation goals and support community college student success.
Finally, our findings challenge policymakers to ensure that merit-aid policies attend to, rather than reinforce, racialized enrollment and completion gaps. It is crucial to examine the heterogeneous effect of merit-aid policies, especially with racial equity continuing to diminish over time in state policy documents and community college responses (e.g., Ching et al., 2020). Our findings indicated that, while state policies exclusively dedicate funding to community college students via New Jersey’s STARS programs, they still tend to disproportionately benefit White students. This finding is consistent with prior research indicating that higher education policymaking is racialized (Au, 2016; McCambly et al., 2023; Rodriguez et al., 2022). Even when certain student populations (e.g., students of color attending community colleges) are formally included in the legislation, they can continue to be excluded in practice—what Negrón-Gonzales (2017) described as “constrained inclusion” (p. 105). If racially inequitable outcomes are due to the meritocratic nature of financial aid design, policymakers should reflect their assumptions in the financial aid policymaking process and consider alternative mechanisms in distributing public funding to community college students.
Footnotes
Appendix A
Description of Variables.
| Variables | Source | Variable characteristics | |
|---|---|---|---|
| Outcome Variable | |||
| Enrollment | The number of FTFT degree-seeking students (logged) | IPEDS—Fall Enrollment Survey | Continuous |
| The number of FTFT degree-seeking White students (logged) | |||
| The number of FTFT degree-seeking non-White students (logged) | |||
| The share of FTFT degree-seeking students enrolled of state total | NCES | ||
| The share of White FTFT degree-seeking students enrolled of state total | |||
| The share of non-White FTFT degree-seeking students enrolled of state total | |||
| Associate Degree Attainment (150% of normal time) | The share of FTFT completers of programs (2 but < 4 year) of the adjusted FTFT cohort | IPEDS—Graduation Rates Survey | |
| The share of White FTFT completers of programs (2 but < 4 year) of the adjusted White FTFT cohort | |||
| The share of non-White FTFT completers of programs (2 but < 4 year) of the adjusted non-White FTFT cohort | |||
| Non-Completion Transfer-Out (150% of normal time) | The share of FTFT transfer-out students of the adjusted FTFT cohort | ||
| The share of White FTFT transfer-out students of the adjusted White FTFT cohort | |||
| The share of non-White FTFT transfer-out students of the adjusted non-White FTFT cohort | |||
| Treatment Variable | Community college targeted merit-aid program | Hu et al. (2024) | 0 = No community college targeted merit-aid program; 1 = Ever community college targeted merit-aid program |
| State-Level Covariates | Number of high school graduates (logged) | NCES | Continuous |
| Level of 4-year sector in-state tuition and fees (logged) | NCES | Continuous | |
| Statewide transferable core of lower-division courses | ECS | 0 = No; 1 = Yes | |
| County-Level Covariates | Per-capita income (logged) | BEA | Continuous |
| Unemployment | BLS | Continuous | |
| Institution-Level Covariates | Institution size | IPEDS | 1 = under 1,000; 2 = 1,000–4,999; 3 = 5,000–9,999; 4 = 10,000–19,999; 5 = above 20,000 |
| Published in-state tuition and fees (logged) | Continuous | ||
| Average amount of federal grants received by recipients (logged) | Continuous | ||
| Average amount of state/local grants received by recipients (logged) | Continuous | ||
| Percentage of certificates awarded out of the sum of certificates and associate degrees | Continuous | ||
Note. FTFT = first-time full-time; BEA = Bureau of Economic Analysis; BLS = Bureau of Labor Statistics; ECS = Education Commission of the States; IPEDS = The Integrated Postsecondary Education Data System; NCES = National Center for Education Statistics.
Appendix B
Pre-Matching and Post-Matching Standardized Difference and Variance Ratio.
| Pre-matching | Post-matching | |||
|---|---|---|---|---|
| Variables | Standardized difference | Variance ratio | Standardized difference | Variance ratio |
| Published in-state tuition and fees (logged) | 1.79*** | 0.37 | 0.28 | 0.60 |
| Average amount of federal grants received by recipients (logged) | −0.10 | 0.27 | 1.03 | 0.02 |
| Average amount of state/local grants received by recipients (logged) | 0.54 | 0.07 | 0.06 | 0.62 |
| Institution size | — | — | ||
| 1,000–4,999 | −0.86** | 0.27 | ||
| 5,000–9,999 | 0.83*** | −0.45 | ||
| above 10,000 | 0.26 | 0.33 | ||
| Percentage of certificates awarded out of the sum of certificates and associate degrees | −1.03** | 0.08 | −0.13 | 0.79 |
| Number of Observations | 281 | 46 | ||
**p < .01. ***p < .001.
Appendix C
Descriptive Longitudinal Trend of Outcomes (Treated and Comparison Group 1 and Comparison Group 2).
| Variables | Total | White | non-White |
|---|---|---|---|
| The number of first-time full-time degree-seeking students enrolled (logged) | |||
| The share of first-time full-time degree-seeking students enrolled of state total | |||
| The share of first-time full-time completers of programs (150% of normal time) of the adjusted first-time full-time cohort | |||
| The share of first-time full-time non-completion transfer-out students of the adjusted first-time full-time cohort | |||
Appendix D
Descriptive Longitudinal Trend of Outcomes (Matched Treated and Untreated Groups).
| Total | White | non-White | |
|---|---|---|---|
| The number of first-time full-time degree-seeking students enrolled (logged) | |||
| The share of first-time full-time degree-seeking students enrolled of state total | |||
| The share of first-time full-time completers of programs (150% of normal time) of the adjusted first-time full-time cohort | |||
| The share of first-time full-time non-completion transfer-out students of the adjusted first-time full-time cohort | |||
Funding
The authors disclosed receipt of the following financial support for the research, authorship, and/or publication of this article: This study was funded by an Officer’s Research Grant from the William T. Grant Foundation (Grant # OR–202968).
Declaration of Conflicting Interests
The authors declared no potential conflicts of interest with respect to the research, authorship, and/or publication of this article.