






Abstract
With the increase of capacity, most of the circulating fluidized beds (CFB) risers are constricted to have rectangular cross section. Therefore, it is important to find out the cross-sectional aspect ratio effect on the gas-solids flow characteristics. In this study, a lab-scale CFB with two rectangular risers, which have the aspect ratio of 1:1 and 3:1, respectively, were studied by the electrical capacitance tomography (ECT), with the aided of pressure measurements and computational particle fluid dynamics (CPFD) simulation. Key issues related with ECT sensor design and image reconstruction, such as sensitivity map and excitation frequency, are also discussed. The results show that ECT image quality is affected by the sensitivity map and excitation frequency, and high excitation frequency and voltage are not equivalent of high image quality. In the riser bottom region, cross-sectional aspect ratio has big effect on ECT measured particle distribution and pressure drop, fewer particles are brought away from the bottom when the aspect ratio is larger. Multiple bubbles exist in the bottom region at Ve= 2.7 m/s, and bubble size decreases in the rectangular riser with larger cross-sectional aspect ratio. Static bed height influences the bubble behaviour that bubbles with smaller size scattered around and behave collapse or coalescence in the moving process when the static bed height is high.
Keywords
Introduction
Due to their considerable mass and heat transfer characteristics, circulating fluidized beds (CFBs) have been widely applied in a variety of industries, such as coal combustion, gasification and catalytic cracking (Kunii and Levenspiel, 1969). The hydrodynamics of the gas-solids flow in the CFB changes not only with fluidizing air and bed material properties, but also with geometry/ shape, structure and dimension of the riser (Kim et al., 2004; Tu et al., 2018).
Normally, the riser shape of a CFB can be circular, square and rectangular (Wang et al., 2018), which has been studied a lot by the researchers, especially the circular CFB. For example, Rao et al. (2010) studied the effect of the column diameter and the bed height on the minimum fluidization velocity, and found that the minimum fluidization velocity insignificantly increases as the diameter of the fluidization column is reduced, or if the height of the bed is increased. Shaul et al. (2012) investigated the influence of the bed height to diameter ratio (H/D=1-10) on the bubbling regime behavior of four different type of materials (Group A, B, C and D (Geldart, 1973)), and concluded that the flow regime transition strongly depends on the diameter of riser and operating condition. Qiu et al. (2014) identified and characterized the flow regime transition in a fluidized bed with three different riser diameters.
But generally the industrial CFB boiler furnaces have a rectangular cross section, and for a given cross-sectional area the furnace can have different shapes or breadth-to-width aspect ratios (Basu, 2015). Hence, it is important to study the flow characteristics in the CFB with rectangular riser. Qian et al. (1996) mentioned the particle concentration in a rectangular cross section is less in the center, but increases sharply near the wall, and is the maximum at the corner. Tian et al. (2009) investigated the effect of riser geometry structure on local flow pattern in a rectangular CFB. It is found that the local particle flow pattern is more complex and stochastic compared with the flow properties in a cylinder CFB riser, and the complexity and heterogeneity are much acute in the exit region and the riser corners. Zhang et al. (2013) studied the exit effect on gas-solid flow and heat transfer inside CFB risers, and obtained the exit effect is less significant with a rectangular cross section than with a circular and square cross section.
Although lots of aspects have been studied for the rectangular riser, the aspect ratio effect has not. Huang et al. (1995) did the experiment and discovered that there was a redistribution of particle flow in the rectangular CFB corner and the aspect ratio of rectangular cross-section had important influence on the thickness of the solid down flow. The longer the side wall is, the thinner the solid flow is and the opposite is also established. There are also many other influences the aspect ratio generated, but at present, no set rule is available for the selection of rectangular aspect ratio. And in the large industrial scale CFB, the width of the furnace should not be so great as to result in a poor generation of the secondary air into the furnace and non-uniform dispersal of volatile matter (Basu, 2015). Its setup is influenced by three major considerations: (1) heating surface necessary in the furnace; (2) secondary air penetration into the furnace; (3) solid feeding/lateral dispersion (Basu, 2015). And on the opposite, the aspect ratio also influences the flow dynamics inside. Therefore, it is necessary to find out more about the rectangular cross-sectional aspect ratio effect on the flow characteristics inside the CFB.
To study the flow characteristics in the CFB system, measurement is a direct way. Pressure transducer (Johnsson et al., 2000) and optical fiber probe (Ellis et al., 2004) capture the local point flow dynamics. Electrical capacitance tomography (ECT) investigates the cross-sectional fluidization characteristics. It can provide additional information on the gas-solids flow hydrodynamics, that is, flow regime transition (Qiu et al., 2015), which can be used for process monitoring and fault diagnosis of gas-solids fluidized beds. Wang et al. (2018) already demonstrated that ECT has been successfully applied in gas-solid fluidised beds with different scales and structures. However, to study the meso-scale and mirco-scale details, measurement is not a good option; computational fluid dynamics (CFD) simulation is a better choice, and drag model is a determinant factor for its accuracy. The most popular drag models are the homogeneous one, for example, Wen-Yu (1966), Ergun (1952), and so forth, and the heterogeneous one, that is, Energy Minimization Multi-Scale (EMMS) (Li and Kwauk, 1994), and so forth, and it has shown that EMMS drag model can provide better prediction of the flow dynamics (Chen et al., 2013; Tu and Wang, 2018).
For fully understanding the flow details inside the CFB, and also for the purpose of optimization and scale-up, it is necessary to study the effects of rectangular riser cross-sectional aspect ratio and static bed height on the flow dynamics. In this study, a lab-scale CFB system with two different cross-sectional rectangular risers, whose aspect ratio are 1:1 and 3:1, respectively, are studied by ECT measurement, with the aid of pressure fluctuation and computational particle fluid dynamics (CPFD) simulation, at two different static bed heights.
Experiment
Experimental setup
Figure 1 shows the CFB system used in this study, which includes a riser, a cyclone, a dipleg and a non-mechanical particle seal connecting the riser with a duct pipe. Through a roots blower, airflow at ambient temperature is introduced to the riser to fluidize the particles. The superficial gas velocity is measured by a turbine flow meter and adjusted to correct the change in temperature and pressure in the plenum chamber. An air distributor and a fine mesh are placed above the plenum chamber to hold solids and to provide a uniform air distribution. Above the air distributor, risers of different shapes but with the same height can be exchanged. In this study, two rectangular risers are installed, which has the inner cross section of 11.5 cm X 11.5 cm, that is, aspect ratio 1:1, and 20.1 cm X 6.7 cm, that is, 3:1, respectively; their top views are shown on the right side of Figure 1. Particles are carried upwards in the riser and exit from the top through a cyclone where particles are separated from the air. Then the separated particles are fed back to the bottom of the riser through the particle seal. Along the riser, three pairs of pressure transducers (Keller PD-23/8666.2) are installed to obtain the differential pressure drop fluctuations for the bottom, middle and top regions. The fluctuations are sampled by the acquisition rate of 1000 samples/s.
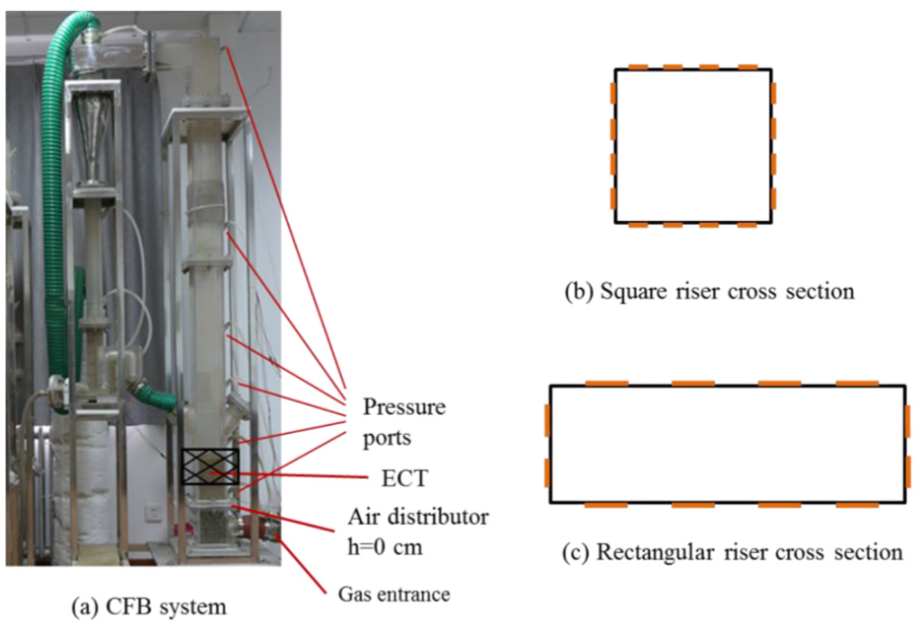
Circulating fluidized bed.
Experimental conditions and materials
In the experiments, silica sand (mixture of Group B particles, according to Geldart classification (Geldart, 1973)) is used as the bed material, which has a density of 2600 kg/m3, close packing volume fraction of 0.47, and a particle size distribution, as shown in Figure 2. Experiments were carried out with two static bed heights, hs=20 cm (called: Case 20) and hs=35 cm (called: Case 35). Superficial air velocities are all set to be 2.7 m/s. At this velocity, the whole CFB system is operated in the fully circulating state, which can give a typical study of the cross-sectional aspect ratio effect on the flow dynamics. The detailed experimental conditions are summarized in Table 1.
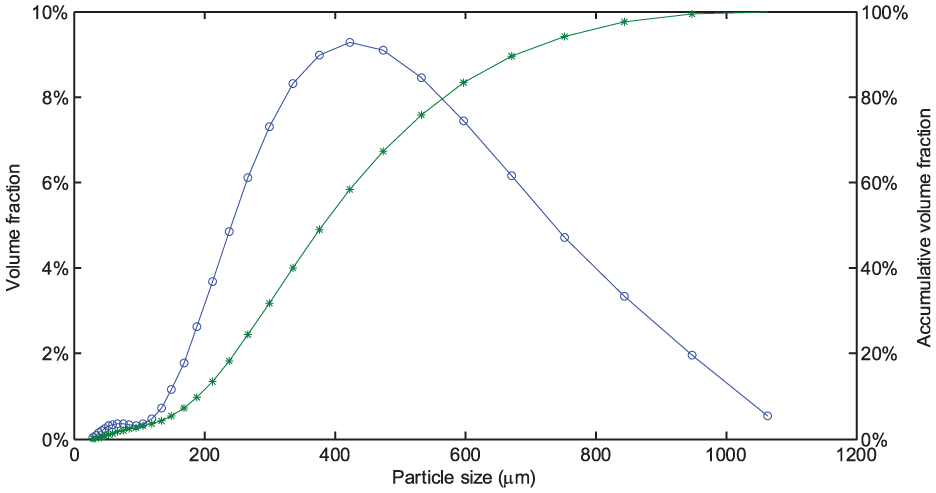
Particle size distribution.
Experimental conditions.
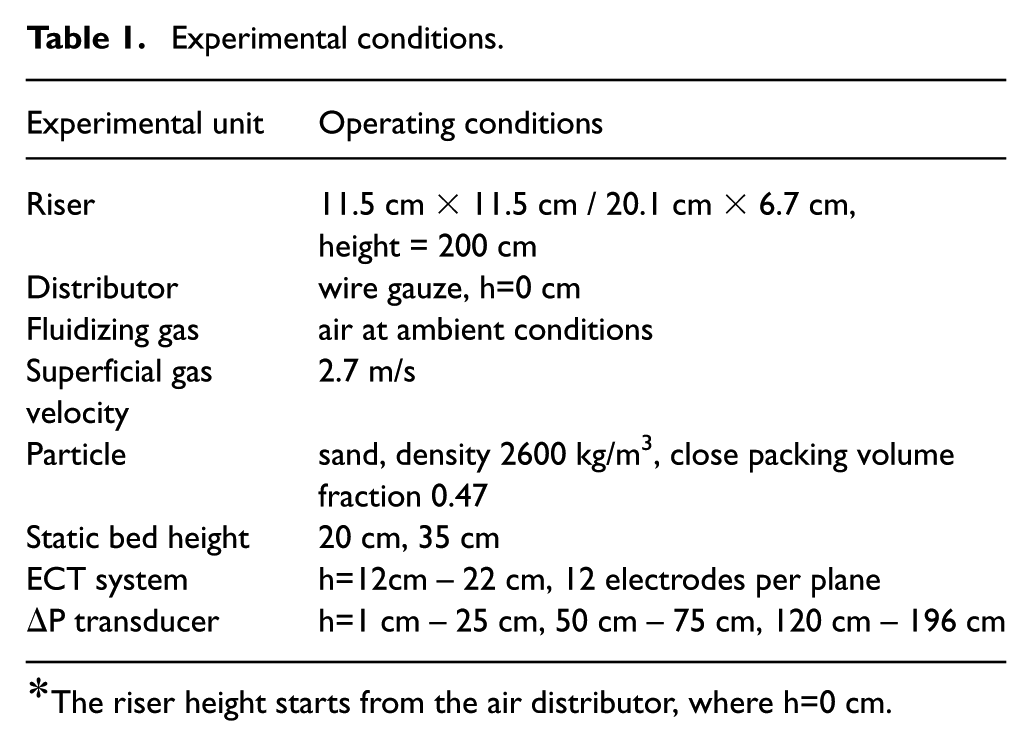
The riser height starts from the air distributor, where h=0 cm.
ECT sensor design and image reconstruction
ECT is employed for the gas-solids distribution measurement. Each ECT sensor consists of 12 electrodes that are evenly arranged around the outside of the risers (shown in Figure 1), and each electrode has the dimension of 10 cm X 3.2 cm. An AC-based capacitance tomography (AC-ECT) (Yang and York, 1999) system with 16 channels from ECT Instruments Ltd, Manchester, UK, is employed for experiment. The data acquisition rate is 120 frames/s for each sensor and 1000 sets of data are acquired for each case.
Wang et al. (2018) gives a detailed description of the ECT image reconstruction, and concludes that the Landweber iteration algorithm is suitable to reconstruct solids distribution and identify the flow regime in gas-solids fluidized beds.
The Landweber iteration is written as (Yang et al., 1999)
where,
For accuracy, each sensor needs to be calibrated before the measurement. Air and sand were used as lower and higher permittivity materials to obtain the capacitance vector of CL and CH, respectively. The normalized capacitance was then calculated based on the capacitance data of CL and CH using equation (3)
where CM is the measured capacitance, CL is the capacitance when an ECT sensor is filled with air and CH is the capacitance when the sensor is filled with silica sands.
Key issues affecting the ECT image quality
For the ECT sensor, the sensitivity map is one of the important factors for achieving good quality images. In addition, the excitation frequency also affects the ECT measurement. Therefore, the key issues affecting the ECT image quality will be discussed firstly.
Potential distribution and sensitivity maps of ECT sensor
For image reconstruction in ECT, it is essential to obtain the sensitivity distributions in equations (1) and (2) for each single-electrode pair of ECT sensors, as shown in Figure 3, which are often called sensitivity maps. A commonly used method to obtain a sensitivity map is by first finding two potential distributions when a potential is applied to two electrodes respectively. In general, a potential distribution can be obtained by a numerical solution of the Laplace equations in 2D using a finite volume method.
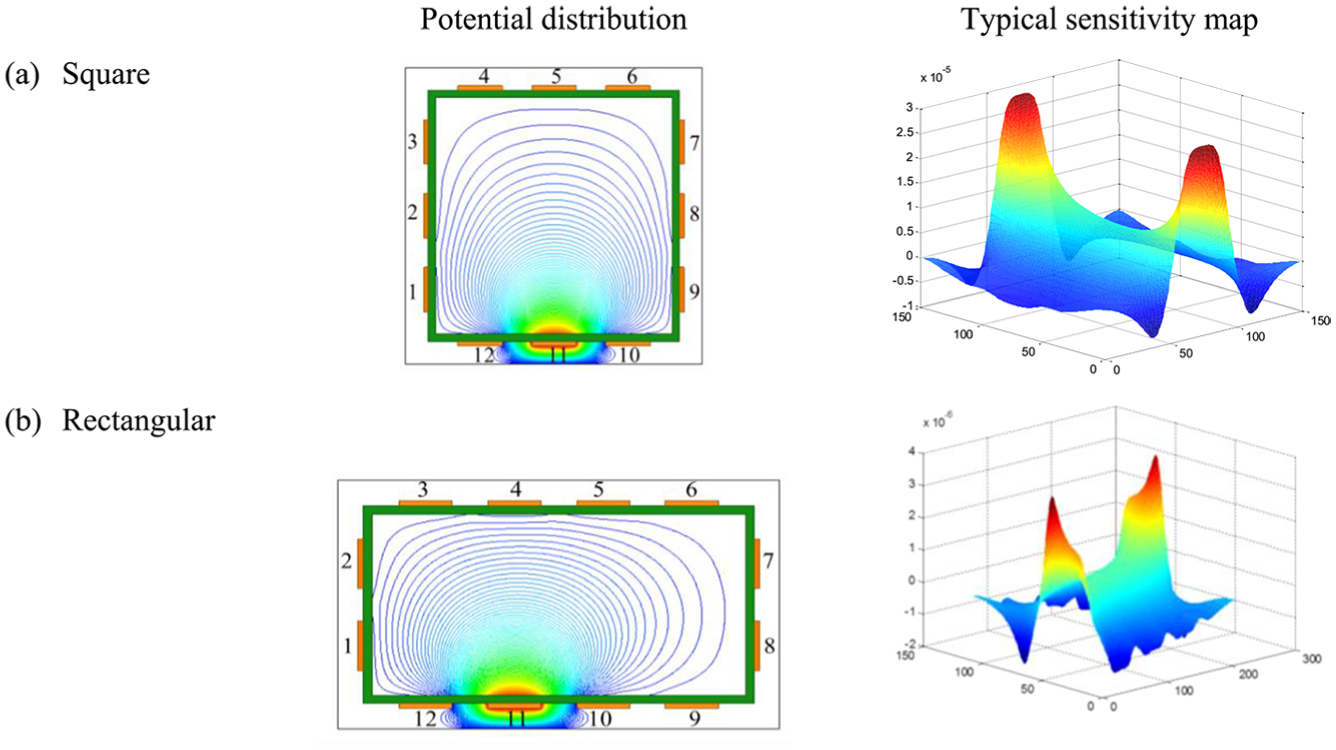
Potential distributions and sensitivity maps of different ECT sensors.
where φ is the potential distribution and ε is the permittivity of material inside the measurement area.
The sensitivity map of electrode pair i - j at a spatial location (x, y) can be calculated by vector multiplication of two electric fields, which are normal to the potential distributions
where Ei is the electric field distribution when an excitation voltage Vi is applied to electrode i while all other electrodes remain at the earth potential, Ej is the electric field distribution when an excitation voltage Vj is applied to electrode j while all other electrodes remain at the earth potential, and p(x, y) is the surface area of the cell at (x, y).
Figure 3 gives the typical potential distribution and sensitivity maps for the ECT sensors, as shown in Figure 1.
Due to a limit number of measurements, the inverse problem of process tomography is ill-posed and ill-conditioned (Yang and Peng, 2003). The stability of the solution depends on the image reconstruction algorithm and the quality of the sensitivity maps as defined in Equation (5). There are two criteria to determine the property of sensitivity matrices, that is, ill-conditions number and sensitivity variation parameter (SVP) (Li and Yang, 2008). The condition number of the sensitivity matrix is an indicator for the solvability of the inverse problem. It depends on the number of measurements and the grid size. The SVP is used to determine the uniformity of sensitivity matrices and defined as
where N is the total number of sensitivity maps and
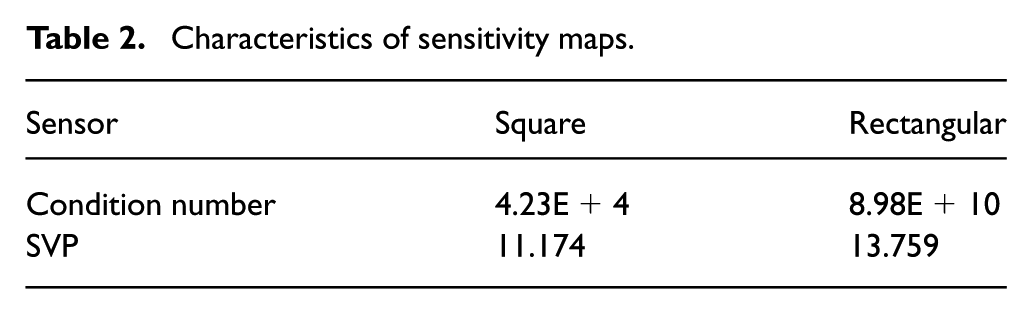
The condition number and SVP for different sensor models are given in Table 2. It is clear that the square sensor is superior to the rectangular sensors in terms of the condition number and SVP value of sensitivity maps. The big condition number means that small errors in measured data would result in divergence for the rectangular ECT sensors. Therefore, the relaxation factor used in image reconstruction must be small to make sure convergence of the iteration. In terms of uniform distribution, the square sensor provides better uniform sensitivity distribution.
Characteristics of sensitivity maps.
Effects of excitation frequency and voltage for ECT measurement
Previous research indicates that the measured signals of ECT are a function of the excitation frequency and voltage (Makkawi and Wright, 2002; Yang and York, 1999). For the AC-based ECT system used in this research, the theoretical relationship between the excitation voltage Vin and the measured voltage Vout can be expressed as (Yang and York, 1999)
where Cx is the unknown capacitance, Cf is the feed-back capacitance and Rf is the feedback resistance in the AC-based ECT system. Equation (7) indicates that the amplitudes of measured voltages are increased with the increase in the excitation voltage and frequency.
To improve the measurement accuracy, it is necessary to investigate the effects of frequency and excitation voltage on capacitance measurement. A distribution with two perspex rods with a permittivity of 2.5 was utilized for the test, and Figures 4 and 5 show the phantoms and reconstructed images with different excitation voltage and different frequency for the ECT sensors, respectively. It can be seen clearly that the image quality increases with the increase in the excitation frequency. The frequencies of 300 kHz and 400 kHz give the best images for the two sensors. The image quality decreases with the increase in the excitation voltage and 15 Vp-p gives the best images for the sensors.
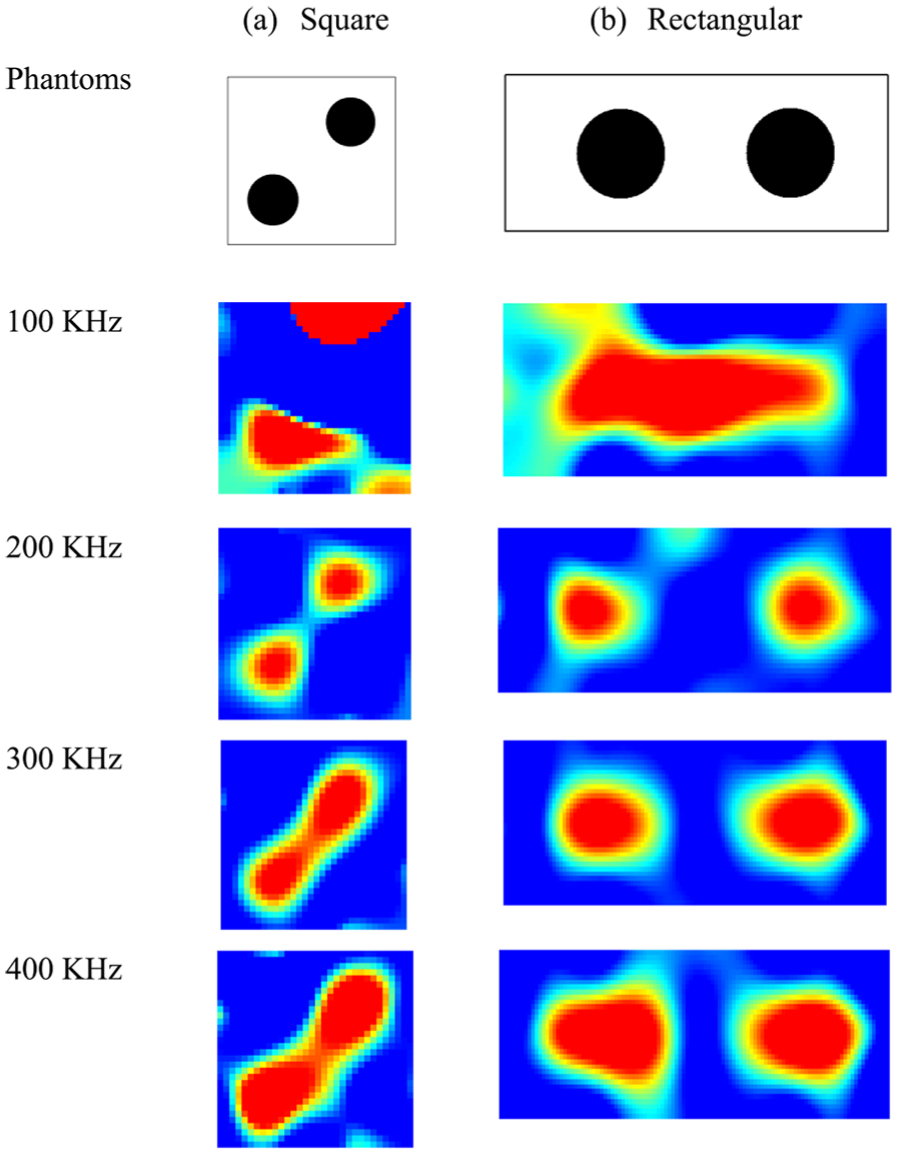
Effect of excitation frequency (12 Vp-p).
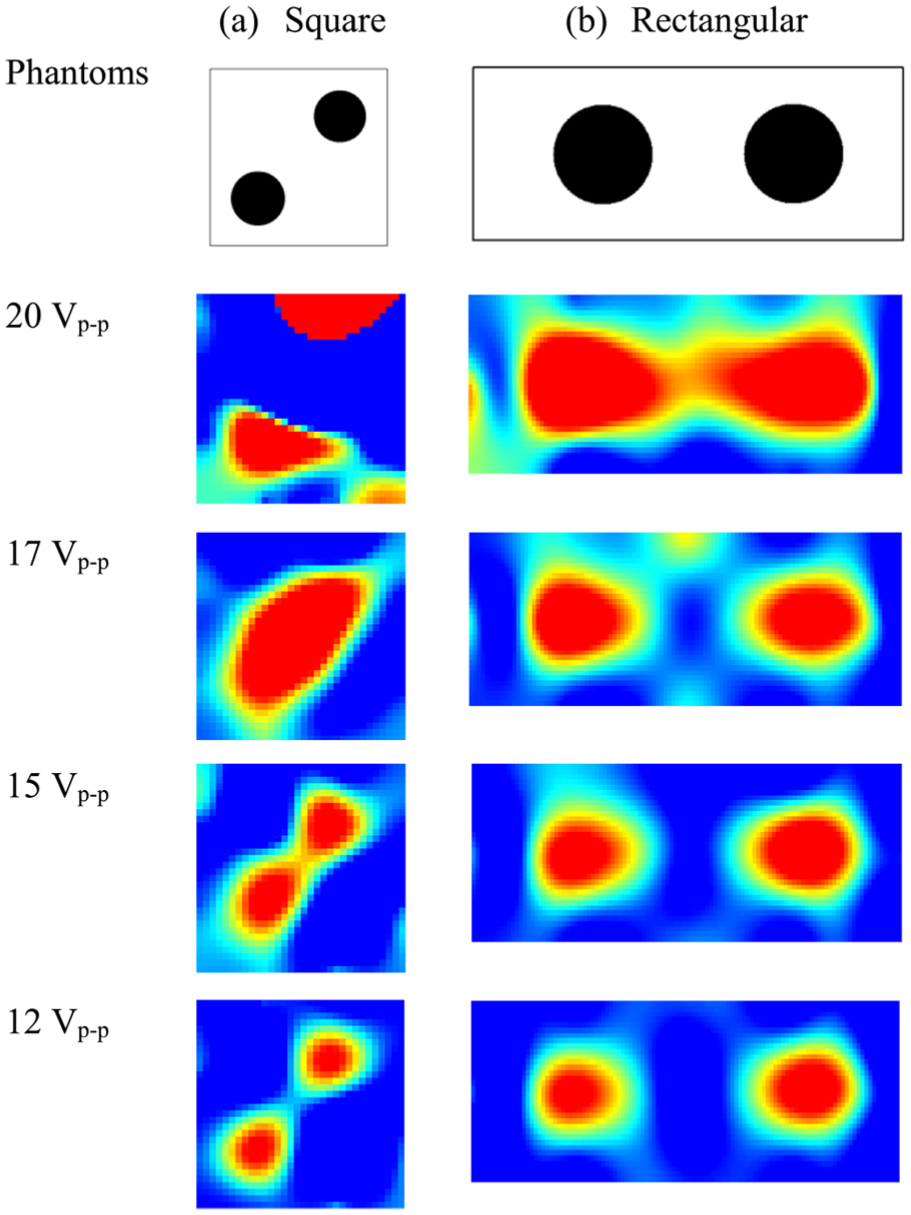
Effect of excitation voltage (f = 200 kHz).
From the reconstructed image, it is hard to directly tell at which frequency or voltage the image quality is the best. Therefore, an additional parameter needs to be introduced to evaluate the results. In this research, the signal-to-noise ratio (SNR) is used to evaluate the signal quality and it is defined as (Hu and Yang, 2006)
where, Ci is measured capacitance,
Figure 6 shows the SNR results for the two ECT sensors. It is clear that SNR increases first with the increase in frequency in the range of 100 kHz and 150 kHz and then decreases with the increase in frequency after the point of 150 kHz for the square and rectangular ECT sensors. They nearly have the same trend with the voltage for these two types of sensor. This phenomenon agrees well with the theoretical equation (8) in the frequency range of 100 kHz and 150 kHz as well as voltage in the range of 12 Vp-p and 20 Vp-p. In the frequency range of 250 kHz and 400 kHz, SNR is nearly kept constant for the two sensors. It can be concluded that the high voltage and frequency excitation are not equivalent of the high SNR.
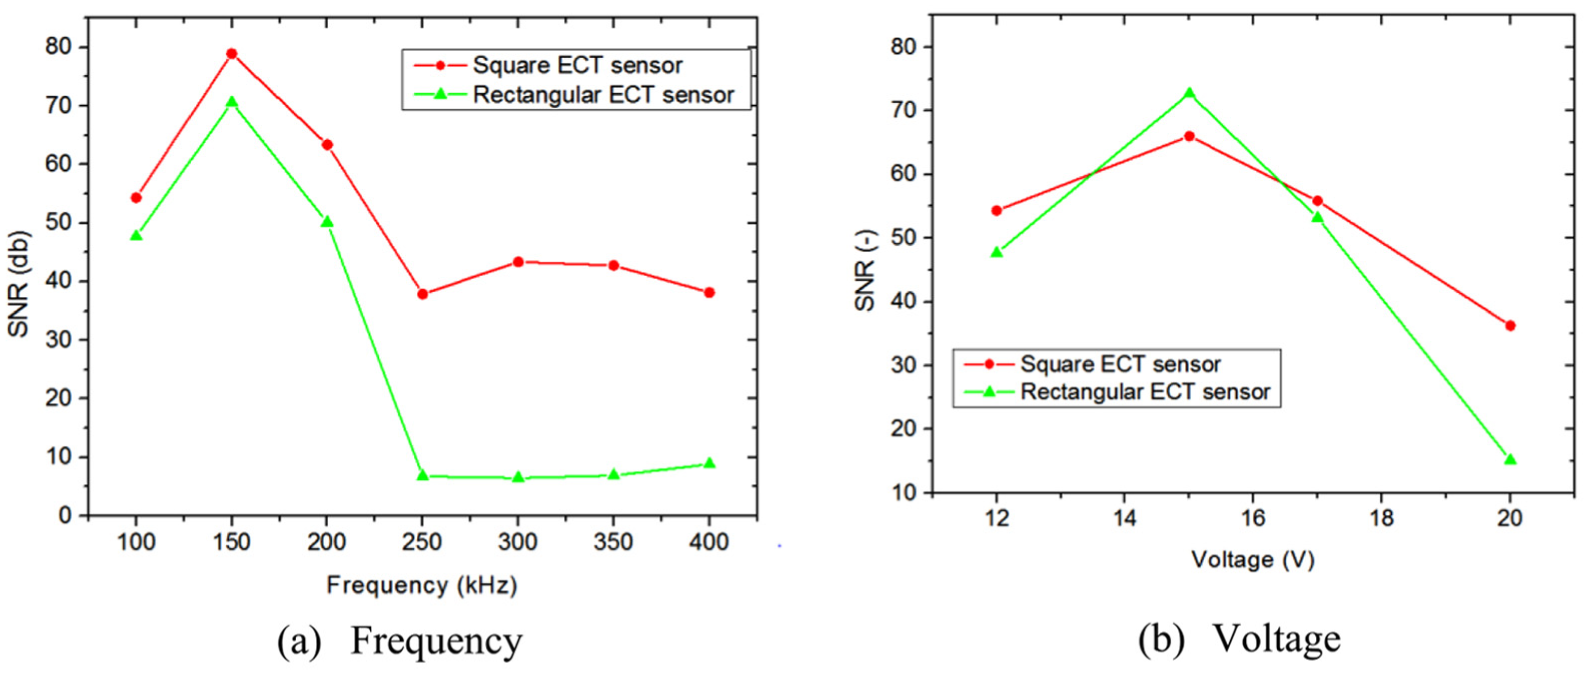
SNR with different frequency and voltage.
As discussed in previous research by Ye et al. 2014 (2014), the SNR value not only depends on the ECT sensor design, but also on the measurement excitation strategy, that is, multi-electrodes excitation and detection model (Ye, et al., 2014; Yang, 2010). To obtain high quality signal, optimized excitation parameters and excitation strategy needs to be addressed further.
CFD approach and EMMS drag models and simulation conditions
The simulation of the CFB system was performed in a 3D full-loop domain, as shown in Figure 1, by the CPFD platform Barracuda®. The continuous fluid phase is solved based on the Navier-Stokes equation and the discrete solid phase is solved based on the Multiphase Particle-in-cell (MP-PIC) method. The details of governing equations are given in Tu and Wang (2018).
Interaction between the continuous and solid phases is determined by the drag model. EMMS drag model is becoming a popular one due to its consideration of the effect of heterogeneous characteristics of the solid phase. EMMS/matrix model taking into account both local slip velocity and void fraction is coupled with CPFD in this study for the simulation. To consider the heterogeneous characteristics, a heterogeneity index is introduced in the EMMS/matrix model and it is defined as (Wang and Li, 2007)
where
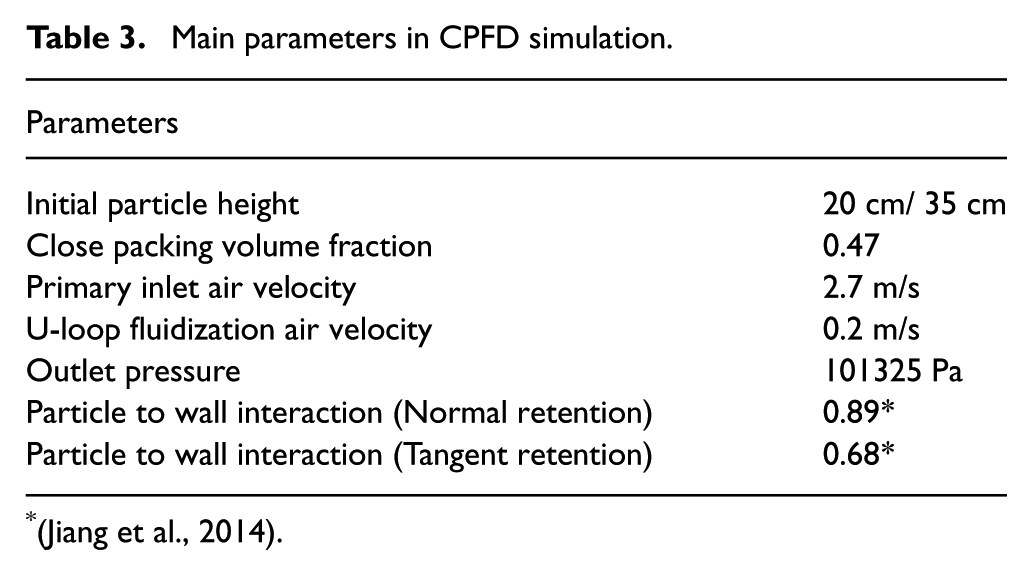
In the simulation, the setup of the initial and boundary conditions are the same with the experiments. Some main parameters are shown in Table 3.
Main parameters in CPFD simulation.
Results and discussion
Rectangular riser is one typical structure used in gas-solids fluidised beds, especially in power plant for coal combustion. Its cross-sectional aspect ratio effect on the flow dynamics has rarely been reported and it will be discussed as follows.
Instantaneous particle concentration and gas bubbles
Figure 7 shows the selected instantaneous particle concentration images in the square and rectangular risers from ECT measurement and CPFD simulation. The phenomena in the ECT image and simulated image agree well with each other. One bubble appears in the square cross section and more than one bubble appears in the rectangular cross section. In the ECT images, the bubble in the square cross section is round or elongated, but the bubble in the rectangular cross section is stretched along the long side due to large cross-sectional aspect ratio that the bubble interacts with the long side walls (Wang et al., 2006). In the simulated images, the bubble size is large in the square geometry but small in the rectangular, especially in the rectangular riser with higher static bed height.
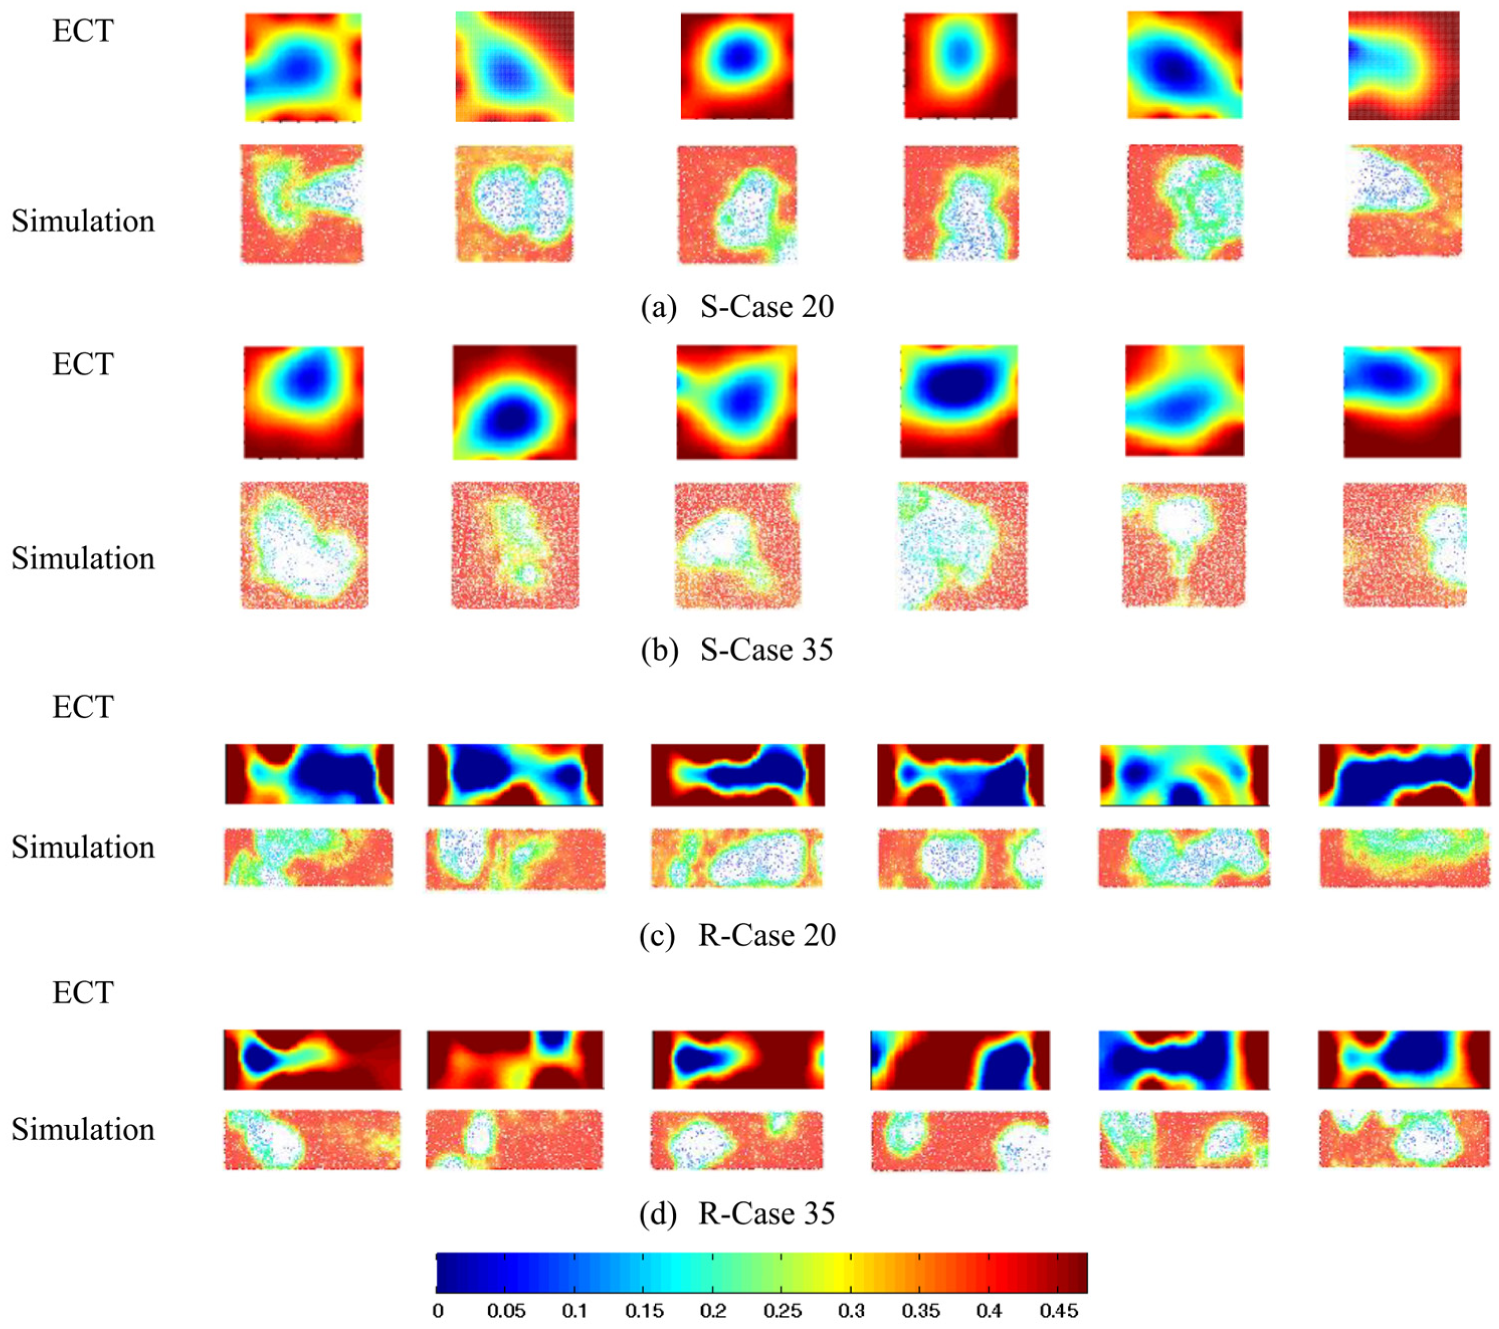
Selected instantaneous particle concentration images from ECT measurement and simulation.
A gas bubble is defined as a region where the solids’ volume fraction is lower than a certain value (Darton et al., 1977). Here, the isovolume of the particle concentration lower than 0.094 (20% of the close-packing volume fraction) is regarded as a gas bubble (van Wachem et al., 1998). Figure 8 shows the simulated instantaneous 3D gas bubbles moving through the cross section at h=17 cm, where the middle height of the ECT sensor is located. From the images, it is clear that the bubble size is large before passing though the cross section in Case 20, and the bubbles mix with the dilute region immediately after passing through the cross section, due to the lower static bed height. The bubble size is small before passing through the cross section in Case 35 and they are scattered around, then the bubble number decreases after passing through the cross section, which means bubbles behave collapse or coalescence in the process. Furthermore, in the images it can be seen that several bubbles pass through the rectangular cross section at each instant, while one bubble passes through the square cross section at most of the time.
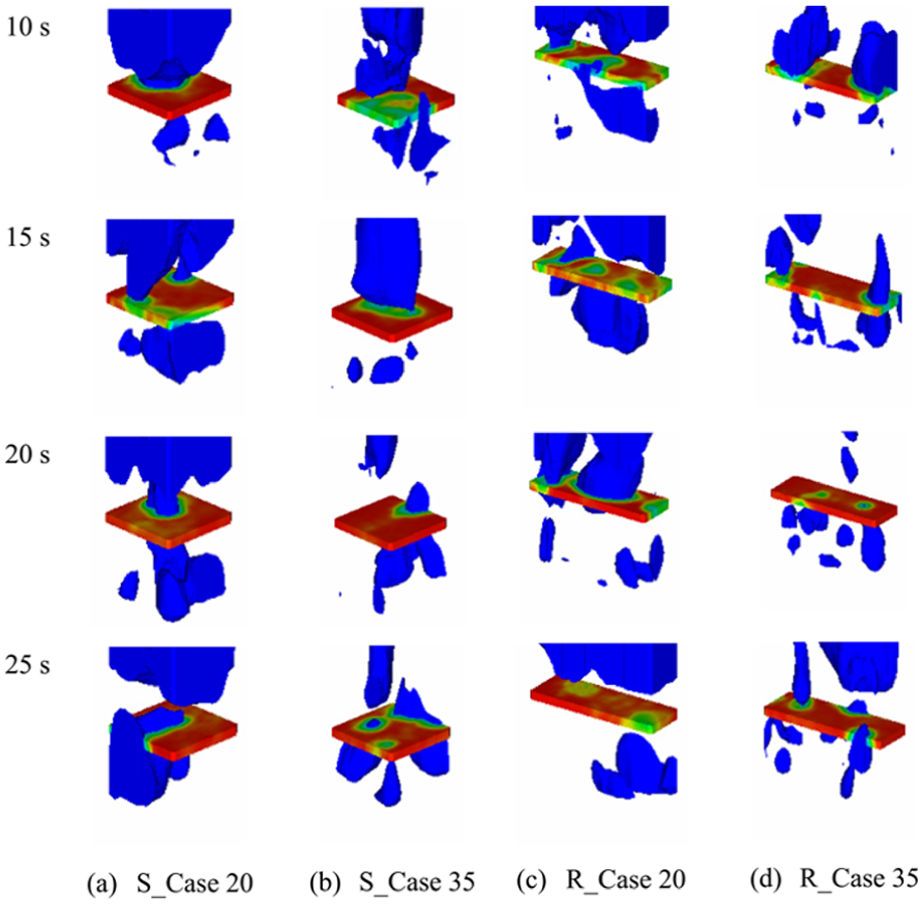
Simulated instantaneous bubbles moving across the middle cross section of the ECT located at h=17 cm.
Average particle concentration
The area-averaged particle concentration in a cross section obtained from ECT measurement, can be calculated by (Qiu et al., 2014)
where
Figure 9 shows the time series area-averaged particle concentration variations obtained from equation (10), which are obtained by averaging 1000 ECT images sampled in around 8 s. The amplitudes are different in each case, and the value in the square riser is larger than in the rectangular one. For the four cases, the average value is 0.3, 0.34, 0.14 and 0.15, respectively. With the increase of the static bed height, the average particle concentration increases, but the effect is not so prominent. Comparatively, the aspect ratio effect is much more outstanding that the average particle concentration in the rectangular riser is less than half of that in the square riser.
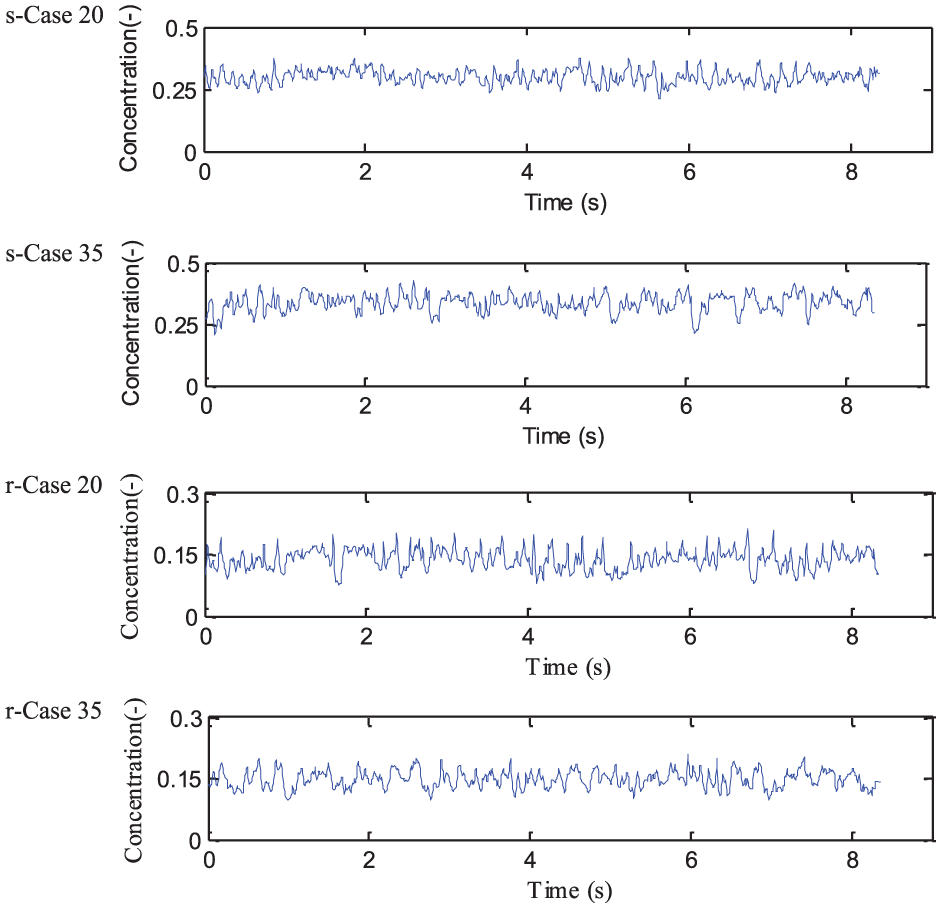
Time series of area-averaged particle concentration variation.
Fig. 10 presents the autocorrelation and power spectra analysis of the particle concentration variations in Fig. 9. In the cases with lower static bed height, there is decay of the autocorrelation, its coefficient amplitude is small, and the power spectra have several broad bands spectrum, which indicates a distinguishable bubbling behaviour. In contrast, in the cases with higher static bed height, the autocorrelation is periodic, and the power spectra have a relatively narrow band spectrum with a high magnitude. Therefore, the cross-sectional aspect ratio has little effect on the autocorrelation and power spectra but the static bed height has some effect.
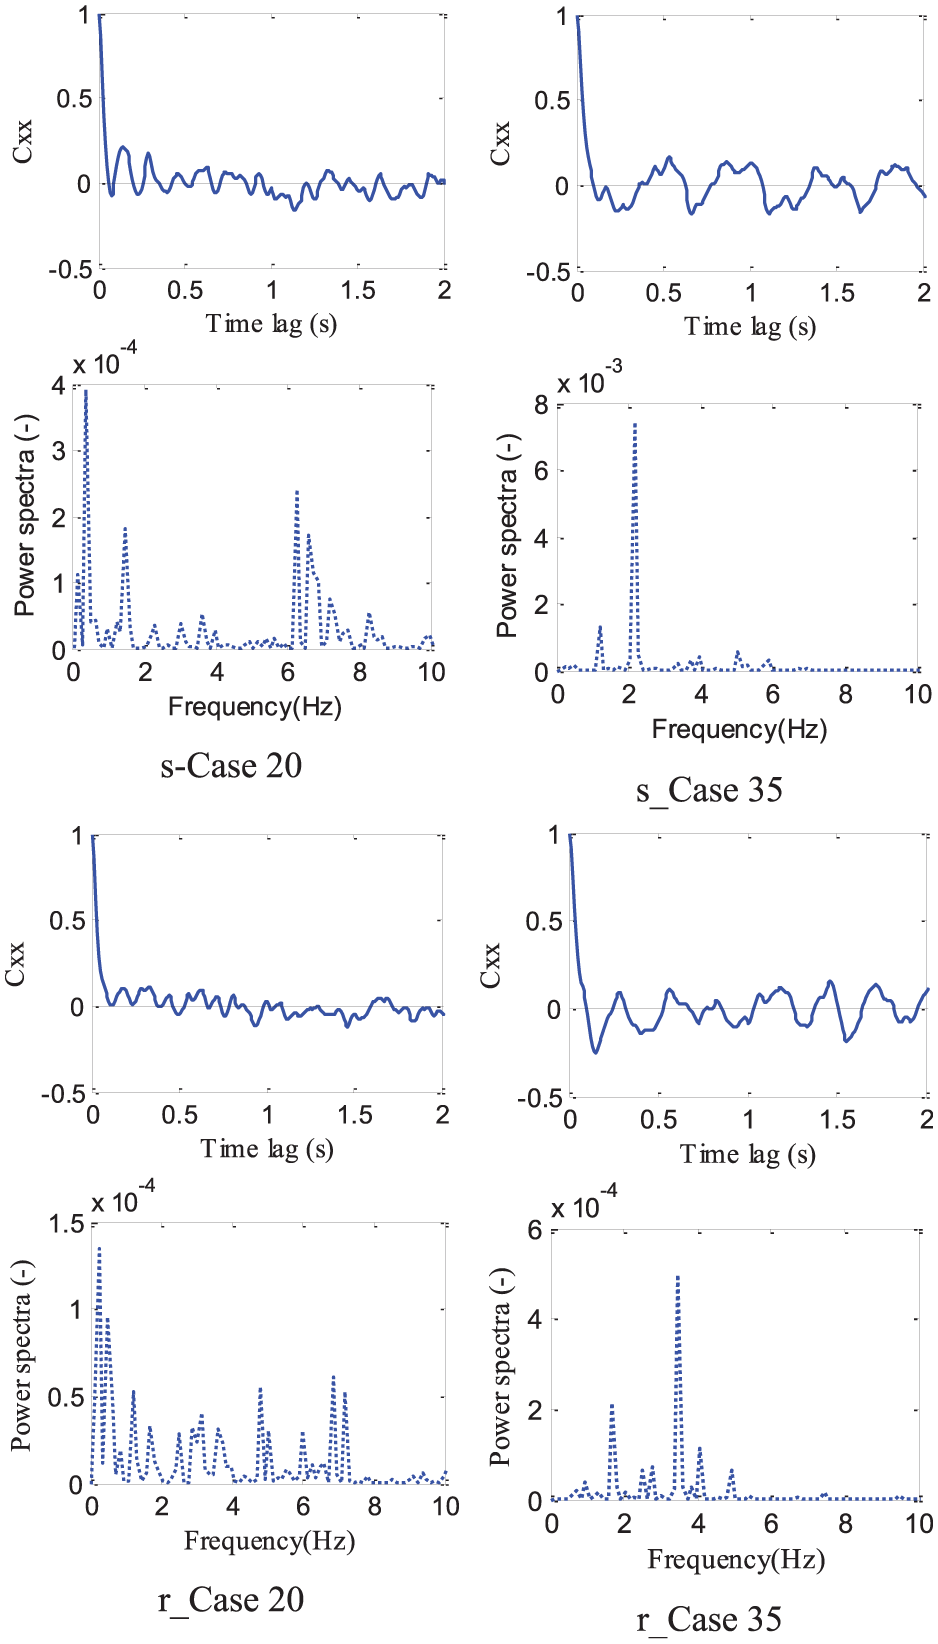
Autocorrelation coefficient and power spectra.
Figure 11 shows the simulated averaged particle concentration in the full loop CFBs and the profiles of the axial particle concentration along the risers. In the full loop images, it is clearly that particles accumulate mainly at the bottom of the riser, which is the dense region. And this region corresponds to the part below the turning point at the lower height in the axial particle concentration profiles shown in the image. In the profiles, the four distribution profiles exhibit the same trend as “S” shape. The lower turning points occur at h=0.23 m for Case 20 and at h=0.4 m for Case 35, regardless of the geometry, which means the distribution profiles are coincident for the square and rectangular CFBs at the same static bed height. In addition, the value of Case 35 is larger than that of Case 20 along the height but the values are close when approaching the top region.
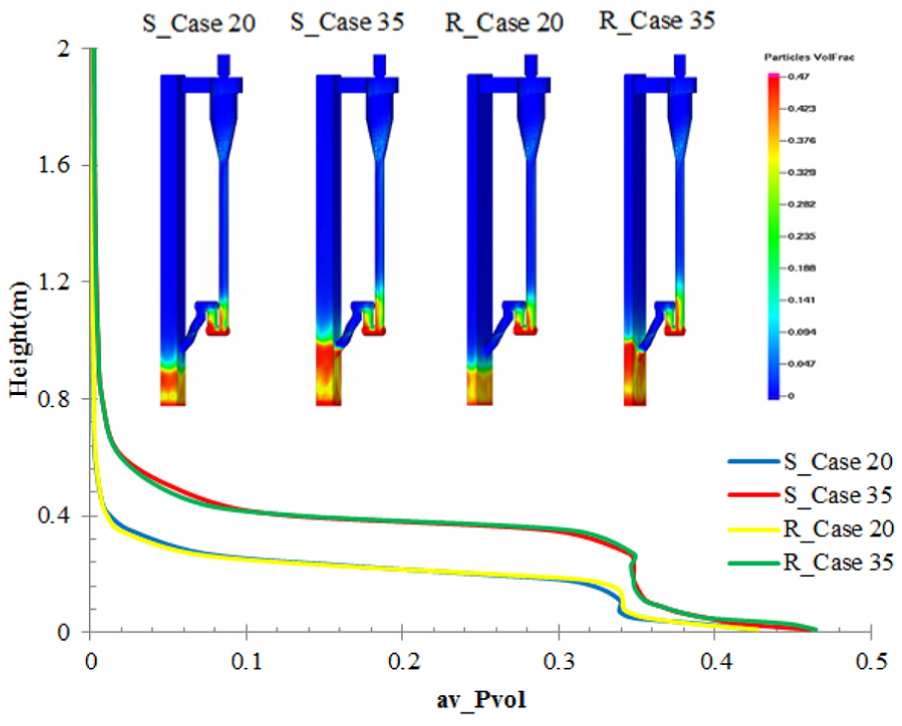
Simulated averaged particle concentration.
Figure 12 shows the simulated time series of the area-averaged particle concentration of the cross section at h=17 cm with time step Δt=0.3 s. h=17 cm is located at the middle height of the ECT sensor. The average value of the four cases is 0.31, 0.36, 0.32 and 0.35, respectively. This means at this location, the riser cross-sectional aspect ratio has little effect on the average particle concentration at each static bed height. This is different from the results shown in Figure 9. Compare the two groups data in Figures 9 and 12, and it is obvious that the particle concentration are close in the square geometry, but different in the rectangular geometry in that the measured value is less than half of the simulated value. This may be caused by the EMMS drag model derivation, which needs further study.
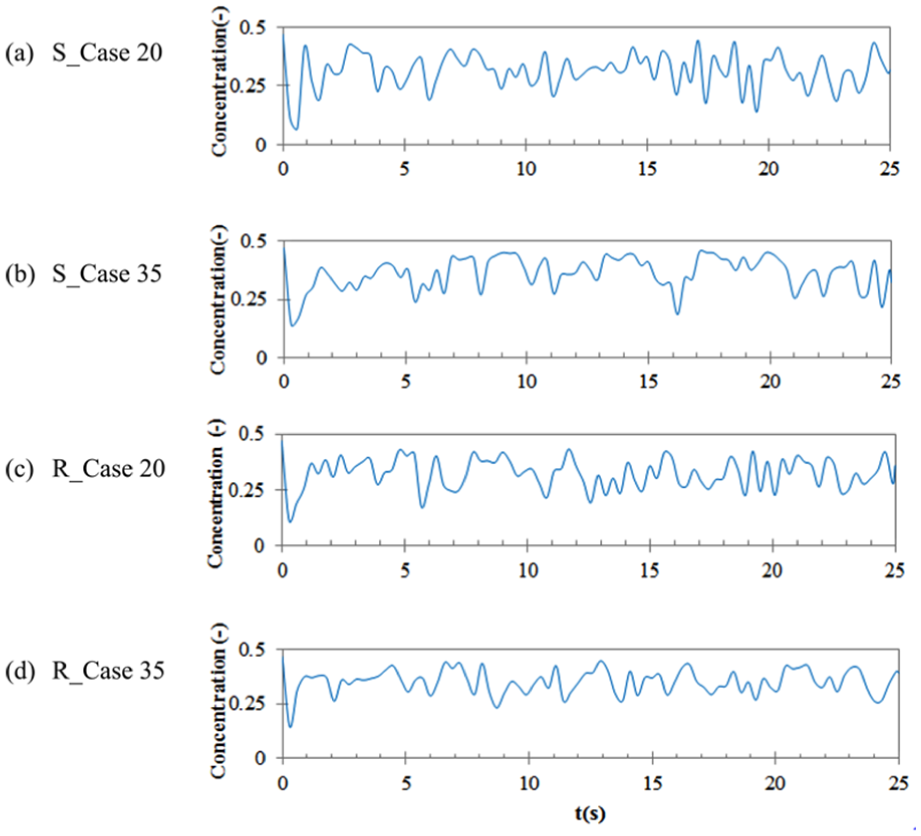
Time series of simulated area-averaged particle concentration at h=17 cm.
Pressure analysis
Pressure fluctuations are mainly related to bubble motion within the gas solid bed, so they are often chosen to characterize the fluid dynamics because of its robustness and simplicity in the measurement, even under harsh, industrial conditions (Bi, 2007; Qian et al., 1996; van Ommen et al., 2011). The time and frequency domain analysis of pressure are the most common approaches to describe the dynamic behaviour in a gas-solids flow system, for example, the spectra analysis has been applied in determining bubble characteristics, fluidization regime transitions and fluidization quality (Zhang et al., 2018).
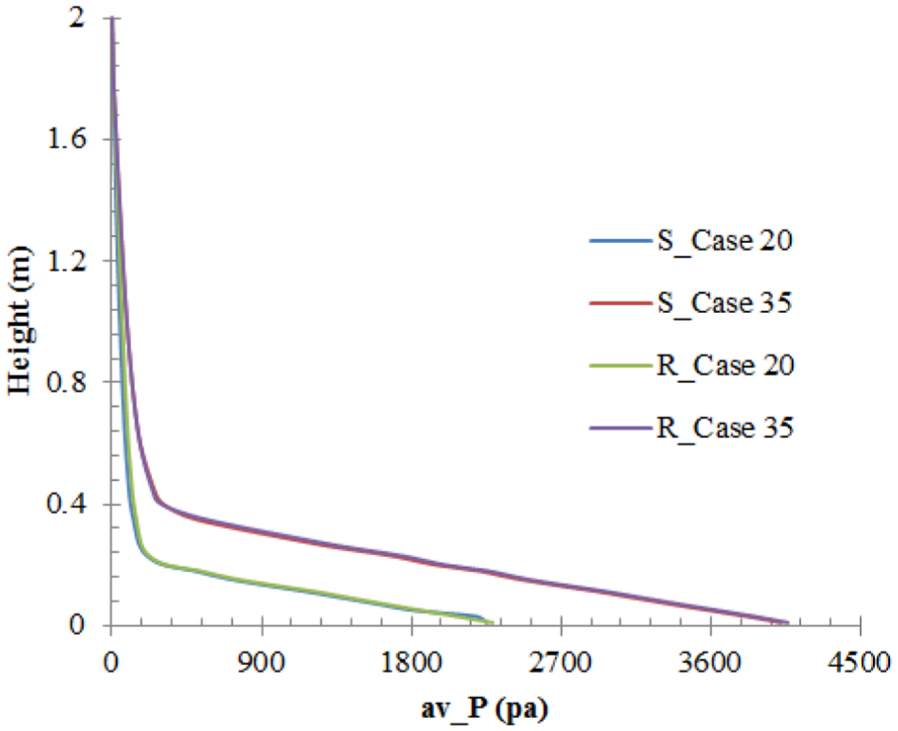
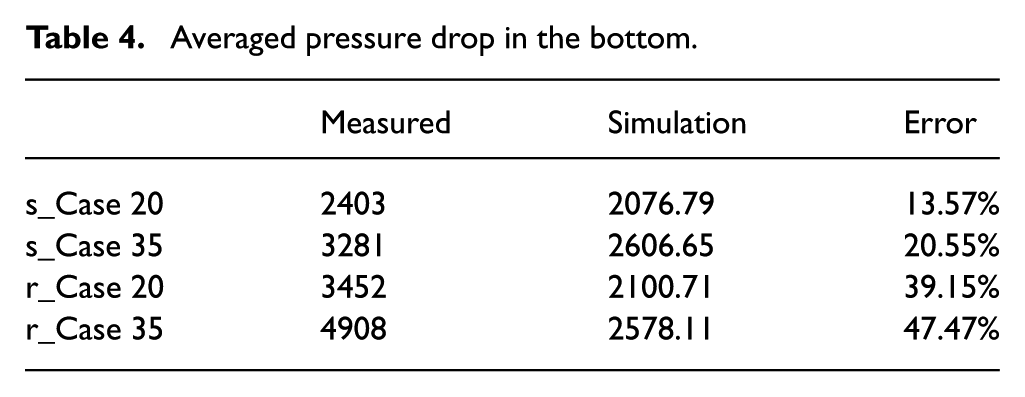
Figure 13 shows the comparison of the measured pressure fluctuations of the bottom region in the square and rectangular CFBs, and their corresponding value with low pass filer and power spectra calculated by Fast Fourier Transformation (FFT). Figure 14 shows the simulated time-averaged pressure drop along the risers. And Table 4 lists the averaged pressure drop between h=1 cm and h=25 cm obtained from simulation and measurement.
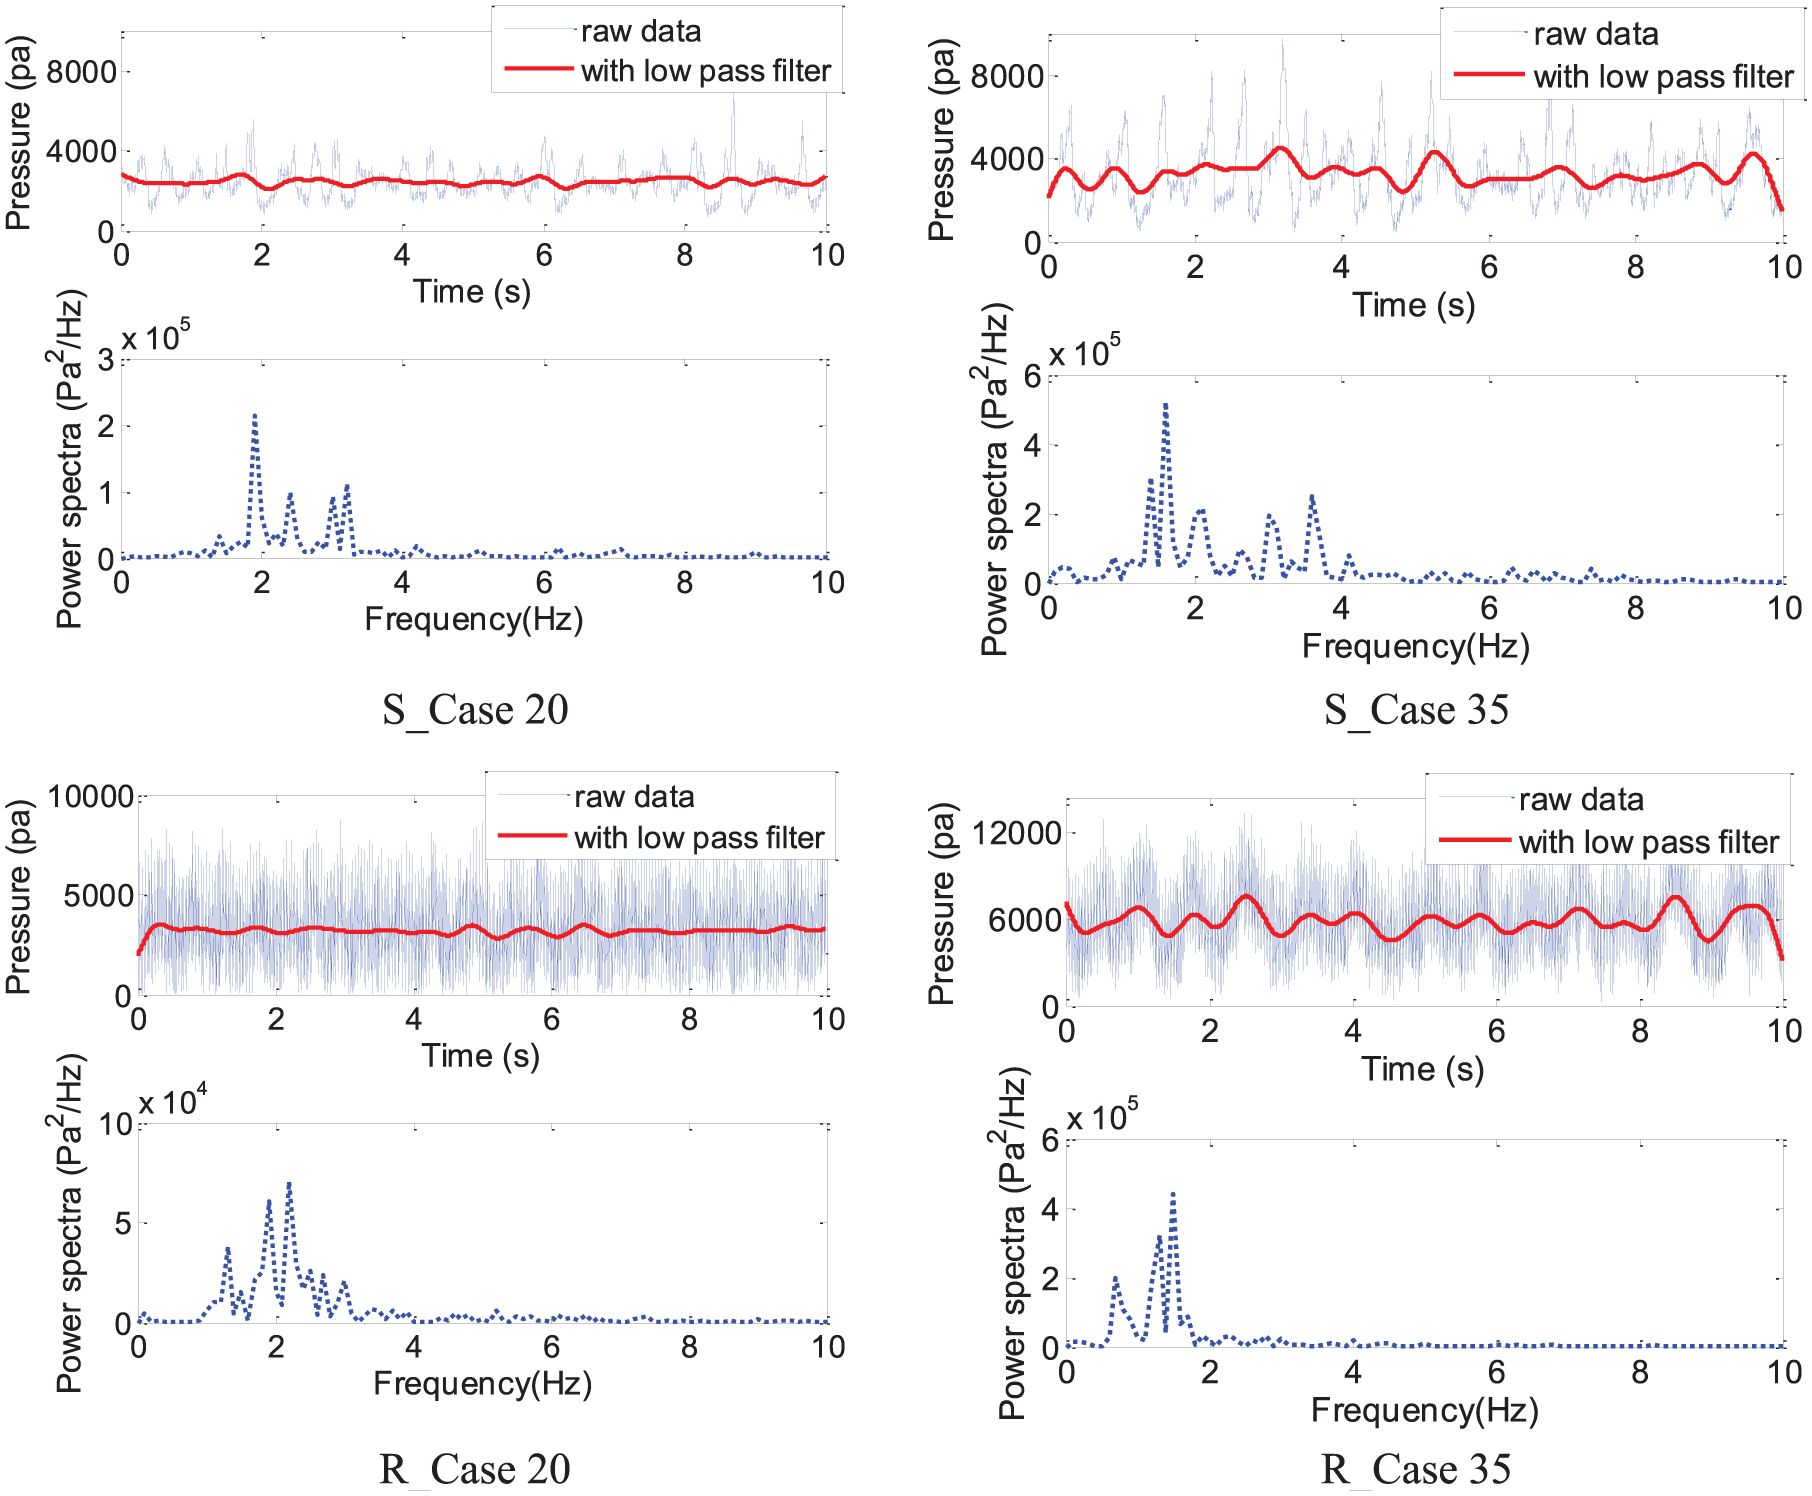
Measured pressure fluctuations in the bottom of the CFBs.
Simulated axial averaged pressure profiles.
Averaged pressure drop in the bottom.
According to Johnsson et al. (2000), the dominant frequency is defined as the bubble passes through the bed, and a wide band spectrum is considered to signify an increase in the number of bubbles (Makkawi and Wright, 2002). Thus, there are lots of bubbles existing in the bottom region of the square and rectangular risers, as shown in Figure 13. Comparing Figure 13 with Figure 10, it can be found that the dominant frequencies are slightly different between the pressure and averaged solids volume fraction fluctuation. One of the main reasons is that the ECT measurement represents the information on the whole cross section while the pressure probe only measures the near-wall region (Qiu et al., 2014). It is saying that power spectra indicate how the energy is distributed over the frequencies (Makkawi and Wright, 2002). Hence, from the power spectra images, it is seen that the energy is distributed mainly around 2 Hz at the superficial gas velocity of 2.7 m/s in both square and rectangular risers. Furthermore, in the paper of Zhang et al. (2018), it said bubbles generally generate stronger fluctuations with higher frequency variations (about 2 Hz), which suggest efficient gas solids interaction. Therefore, the gas-solids mixing in the square and rectangular CFBs behave well.
In the time-averaged pressure drop profiles in Figure 14, the turning point of each profile is at the same location with the corresponding particle concentration profile in Figure 11. The axial pressure decreases sharply below the turning point, but decreases very slowly above it.
In Table 4, the simulated pressure drop between h=1 cm and h=25 cm is close when the static bed height is the same, regardless of the cross-sectional aspect ratio. But the measured pressure drops in the rectangular riser are much larger than in the square riser, and the higher the static bed height is, the larger the difference is.
Conclusions
In this study, the aspect ratio effect of the rectangular riser cross section on the gas-solids flow characteristics in CFBs is investigated by ECT sensors, with the aided of pressure transducers and CPFD simulation. The risers have two cross-sectional aspect ratios: 1:1 and 3:1. The main conclusions are as follows:
(1) ECT image quality is affected by the sensitivity map and excitation frequency, and high excitation frequency and voltage are not equivalent of high image quality.
(2) Cross-sectional aspect ratio has a big effect on particle distribution and pressure drop in the riser bottom region. Fewer particles are brought away from the bottom when the aspect ratio is larger.
(3) Multiple bubbles exist in the riser bottom region at Ve= 2.7 m/s, but with larger cross-sectional aspect ratio, the bubble size decreases.
(4) Static bed height influences the bubble behaviour that bubbles with smaller size scattered around and behave collapse or coalescence in the moving process when the static bed height is high.
Footnotes
Acknowledgements
The authors are grateful to the support from the National Natural Science Foundation of China (No. 61771455), CAS Interdisciplinary Innovation Team and the Royal Society Newton Advanced Fellowship (NA170124).
Declaration of conflicting interests
The author(s) declared no potential conflict of interests with respect to the research, authorship and/or publication of this article.
Funding
The author(s) disclosed receipt of the following financial support for the research, authorship, and/or publication of this article: Support came from the National Natural Science Foundation of China (No. 61771455), CAS Interdisciplinary Innovation Team and the Royal Society Newton Advanced Fellowship (NA170124).
