
Abstract
Whether to screen for prostate cancer (PC) and how best to treat it remains controversial among policy makers1–3 and clinicians.4–6 Two recent large randomized controlled trials failed to provide definitive evidence for or against prostate-specific antigen (PSA) screening in men 50 to 74 years of age.7,8 One study reported a 20% reduction in PC deaths with screening, 8 and the other reported no significant differences in the rate of death from PC between the screening and control groups. 7 Different thresholds for PSA (3.0 ng/mL 8 v. 4.0 ng/mL 7 ), contamination by screening in the control groups, different treatments for PC, and different study designs may account for the different results.
Most decisions in PC treatment, and PC screening itself, are preference-sensitive decisions. How patients feel about the potential consequences of treatment (urinary, sexual, and bowel dysfunction) is often the key issue when a decision is being made and satisfaction after treatment has been provided.1,9–11 Decision analyses have consistently suggested that the potential benefits of PC screening and treatment on cancer mortality may be offset by the quality-of-life effects of treatment complications.12–16 Quality of life is important for many conditions; it is almost always important in prostate cancer decisions.
Utility is a global, composite, preference-based measure of health outcome. Utilities are used in decision analyses and cost-effectiveness analysis, as outcome measures in clinical studies, and as measures of population health. Utilities can be elicited directly from patients or surrogates using standard techniques, such as the rating scale or standard gamble. 17 More commonly, utilities are obtained indirectly, by administering multiattribute questionnaire-type instruments that have associated community or patient-derived preference weights.18–20 The generic indirect utility instruments that incorporate population preference weights, such as the Health Utilities Index,21,22 Quality of Well-Being Scale, 23 and EQ-5D, 24 have not been validated in PC patients. The content validity of these instruments21,23,25,26 for PC seems limited, as the key determinants of PC patients’ quality of life, particularly sexual, urinary, and bowel dysfunction,11,27,28 are not well represented. Because the dimensions covered do not include those important to specific diseases, generic utility instruments have been shown to lack sensitivity to clinically relevant changes.28,29 As a result, treatment effects on quality of life may not be detected. Therefore, disease-specific utility measures have an important role, 30 and we believe this role is particularly important in PC.
Furthermore, although population preferences are recommended for “reference case” cost-effectiveness analyses carried out from a societal perspective, the preferences of patients may be more appropriate in comparisons of alternative interventions for their own condition. 30 This situation was the motivation for the development of the Patient-Oriented Prostate Utility Scale (PORPUS). 31
The PORPUS 31 is a 10-item health state classification system. Each item describes a PC-specific quality-of-life domain. These domains, identified through an iterative process involving interviews with patients and clinical experts, are pain, energy, social support, communication with doctor, emotional well-being, urinary frequency, urinary leakage, sexual function, sexual interest, and bowel function (Table 1). Within each domain, there are 4 to 6 levels representing a range of symptom severity. For example, for urinary leakage, the worst level is “Require a clamp, catheter, or collecting bag because of leaking urine or poor bladder control,” and the best level is “Never, under any circumstances, leak urine or lose bladder control.”
Patient-Oriented Prostate Utility Scale (PORPUS) Health Classification System

The PORPUS may be used as a profile, disease-specific, non-preference-based instrument to compute a quality-of-life measure that we call the PORPUS-P (using the scoring algorithm in Appendix A).28,32 The PORPUS can also aid in direct utility assessment when it is administered by a trained interviewer using a script (available on request), 4 marker states, and visual props for the rating scale (RS) and standard gamble (SG) elicitation. 31 Patients first describe their current health by selecting one level from each attribute of the PORPUS-P. This health state description is placed on a color-coded card and patients rank it and 4 marker states (mild impairment, severe impairment, full health, and death) in order of preference. Marker states may help patients conceptualize the entire range of quality of life and position their own health within it.33–35 Patients’ utilities for their own health state, as well as the mild and severe impairment marker states, are obtained using RS (PORPUS-URS) and SG (PORPUS-USG), following the script. This prompted method of utility assessment has face, content, and construct validity and good test-retest reliability,31,32,36,37 but it is time-consuming and requires a trained interviewer and visual props.
Study Purpose
The main purpose of this study was to fit a multiattribute utility function (MAUF) for the PORPUS using data elicited from patients. The PORPUS could then be used as an indirect utility instrument. Secondary goals were to investigate different strategies for some of the steps in fitting the MAUF and to validate the function by comparing directly elicited SG utilities to utilities calculated from the function.
Methods
Multiattribute Utility Functions
We proposed to derive the utility-based measure for the PORPUS by fitting a MAUF to data on patient preferences for health states described by the PORPUS. The MAUF is a function that maps each possible health state to a utility on a scale anchored at zero for dead and 1 for full health. Two distinct approaches have been taken to estimating a MAUF. The first is the statistical inference approach,38,39 in which regression-based methods are employed to fit the function. This approach was used to estimate the MAUF for the SF-6D 40 and the EQ-5D.41,42 The prominent features of this approach are that 1) it requires valuation of a relatively large number of health states, 2) it uses traditional statistical methods to fit and test the adequacy of various competing models, and 3) decisions about the final functional form of the model are data based.
The second approach uses a prespecified function based in multiattribute utility theory and a step-by-step approach to fitting this function. This approach, termed the explicitly decomposed method, 38 was used in the development of the Health Utilities Index Mark II (HUI-2) 43 and, more recently, for disease-specific multiattribute utility measures for asthma 44 and rhinitis, 45 as well as a French version of the HUI-3. 46
The MAUF may take 1 of 3 main forms: multilinear, multiplicative, or additive. Following the approach used for the HUI, we chose the multiplicative form; it allows for interactions between the preferences for different attributes without the large number of parameters required by the full multilinear form (over 1000 with 10 attributes). The decomposed method for fitting the MAUF is best understood by examining the function itself and noting how its component parts relate to data that can be directly observed. The presentation and arithmetic are simplified by use of the disutility (1 minus the utility) rather than the utility. The disutility of a health state, encoded as the 10 item responses P1 to P10 on the PORPUS, is computed as

Three sets of parameters define this function:
The ūi(Pi) are the single-attribute disutilities of response Pi on PORPUS item i. These single-attribute disutility functions will be described below.
Each ci is a scaling constant for its corresponding item i.
c is an overall scaling constant.
The left-hand side of this equation, Ū(

The single-attribute disutility function ūi (Pi) represents the relative preferences for the different levels within item i, scaled such that the disutility of the best level is zero and that of the worst level is 1. Data from patients are used to estimate the 10 single-attribute disutility functions ūi(Pi).
Using the explicitly decomposed method, the scaling constants ci are estimated through their relationship to the disutilities for the “corner states.” A corner state for attribute I is a multiattribute health state where this attribute is at its worst level (so ūI = 1) and all other attributes are at their best (so ūi = 0, i ≠ I). Plugging these disutilities into equation (1), the disutility for corner state I simplifies to Ūi(
In summary, to estimate the MAUF, we needed to estimate 2 sets of parameters in equation 1: a) the single-attribute disutilities ūi(Pi) for each level of each attribute on the PORPUS and b) the disutilities for the corner states, which are equal to the scaling constants ci.
Patient Sample
PC patients were recruited from ambulatory clinics of urologists, radiation oncologists, and medical oncologists at the Princess Margaret Hospital, Toronto, Canada. Inclusion criteria were a confirmed diagnosis of PC, fluency in English, and no cognitive impairment or psychiatric diagnosis documented in the medical chart. A broad spectrum of PC patients was obtained by recruiting 3 cohorts of approximately equal size. Cohort 1 patients had received a diagnosis of localized PC within the past 12 months and had received treatment, were deciding about treatment, or were awaiting treatment. Cohort 2 patients had biopsy or imaging evidence of metastatic disease and excluded patients whose only evidence of possible metastases was elevated PSA. Cohort 3 patients were those who had been diagnosed more than 12 months ago, had received past treatment for localized or locally advanced PC or were following a watchful waiting protocol, and had no objective evidence of metastatic disease. The study was approved by the Research Ethics Boards of the University of Toronto and the University Health Network.
Clinic appointment lists were reviewed 1 to 2 weeks in advance, and patients who had been diagnosed with PC were mailed letters, signed by their physician, to introduce the study. Patient charts were reviewed prior to the interview in order to assign them to the appropriate cohort. Patients could phone the study coordinator for more information, to arrange an appointment, or to decline participation. One week after the letters were mailed, patients who had not responded were telephoned to inquire about their interest in the study.
Obtaining Data to Fit the MAUF
Although there are 48 levels within the 10 attributes of the PORPUS, the best and worst levels within each attribute have scores of 1 and 0, respectively, so elicitation of 28 single-attribute scores was required. We also needed to elicit multiattribute utilities for the 10 corner states. Direct elicitation of utilities can be a time-consuming and intellectually demanding task, so patients were asked to perform a simpler task, an RS valuation. These values were mapped to utilities, which in turn were used to fit the MAUF. To enable accurate mapping of values to utilities, we collected data relating patients’ values to utilities.
Through structured interviews with individual patients at the hospital, we first obtained patients’ RS values for the 2 to 4 intermediate levels within each of the 10 single attributes of the PORPUS in a paper-and-pencil task. Each attribute was presented on 1 page of a 10-page booklet. Each page portrayed an RS (shown as a “feeling thermometer” 47 ) with the best level of an attribute (e.g., “No pain or disturbing body sensations”), assigned a value of 100 and labeled “most desirable,” and the worst level of that attribute (e.g., “Severe pain or disturbing body sensations that limit many activities”), assigned a value of 0 and labeled “least desirable.” To the right of the scale, the remaining 2 to 4 intermediate levels of the attribute were evenly spaced. Patients rated each intermediate level by drawing a line from the text description to the RS.
Second, we obtained patients’ RS values for each of the 10 corner states of the PORPUS. Patients read and ranked, in order of preference, 14 numbered and color-coded cards describing the 10 corner states and 4 multiattribute states (mild, moderate, and severe PC symptoms and dead). They were then shown these health states in order of their preference, from most to least preferred, and asked to place a numbered color-coded arrow for each health state on a large feeling thermometer board, anchored at 100 (full health = best level on all 10 attributes) and 0 (worst health = worst level on all 10 attributes). Values obtained were divided by 100 to scale them from 0 to 1.
Third, to allow estimation of a function mapping RS values to SG utilities, we elicited SG utilities for 4 health states on which we had already obtained RS values: corner states for sexual function (impotence) and pain (severe pain) and states representing mild and severe PC symptoms. These states are referred to as the “mapping states.”
Two aspects to our collection of data on RS values and SG utilities might lead to difficulties in the interpretation of the final MAUF. First, our SG utilities were on a dead to full-health scale, whereas our RS values were on a worst health to full-health scale. A transformation was used to place the RS values on a scale where dead is 0 and 1 is full health, so that the RS and SG were scaled with the same anchors. As a result, any health states with RS values worse than that for dead had negative RS values. Second, we did not allow subjects to rate dead to be worse than the worst health state on the RS scale. At worst, subjects could rate dead the same as worst health by assigning it a value of 0. We examined the impact of various assumptions about the true valuation of the dead health state and recomputed our MAUF under each of these assumptions. Our conclusion was that it made little difference what RS value less than 0 was assigned to dead, so reported RS values of 0 for dead were left as zeroes. The full details of our investigation into these issues are shown in Appendix B.
In addition, demographic and clinical data were obtained by patient self-report and medical charts. Patients’ cooperation, thoughtfulness, and understanding, as well as overall interview quality, were rated on 3-point to 5-point scales. If any item was scored in the lower half of the scale, the patient was excluded.
Estimating the Risk Aversion Function
Typically, patients are risk averse, in that their utility for a health state in the presence of risk (SG) is higher than in the absence of risk (RS), but at the extremes of the ranges (0 and 1), value and utility are equal. A function mapping RS values to SG utilities is termed a risk aversion function. Because SG utilities are needed to estimate the MAUF, accurate representation of the relationship between RS and SG in this population is crucial. 48 We examined the performance of 3 risk aversion functions, 2 involving the power function and a third in which the odds transformations of RS and SG have a linear relationship. 49

Risk Aversion Model
With individual-level RS-SG data on the 4 mapping states, we were able to investigate 3 distinct approaches to modeling the risk aversion function:
Sample mean: For each of the 4 health states, take the average RS and the average SG across subjects and fit a risk aversion function to the resulting 4 data points.
Random effects: Fit a separate risk aversion function to each subject’s data and use the “average” function to get a single function. We accomplish this by fitting a nonlinear random effects model to the entire set of 234 × 4 RS-SG pairs, with a subject-specific random effect for the model parameter (exponent α or slope β). In this approach, the fixed effect for the model parameter defines the population risk aversion function.
Random effects individual functions: The individual random effects from the model in (2) can be used to create subject-specific risk aversion functions that are more stable than subject-specific functions built on each subject’s 4 RS-SG pairs.
The combination of the 3 functional forms and the 2 methods of estimation gives a total of 6 options for estimating the risk aversion function. Each resultant risk aversion function gives a different collection of single-attribute utility functions and scaling constants and, therefore, a different MAUF.
Estimating Coefficients of the Multiattribute Utility Function
Because estimated risk aversion functions for our patients are all concave (downward), decisions about the order in which data are aggregated and converted between RS and SG have an impact on the estimated parameters of the MAUF. Writing SG = f(RS) for the risk aversion function, concavity of f(.) means that for a collection of observed RS and SG for a health state, the average predicted SG is less than the predicted SG at the average RS:
Hypothetical subject MAUF approach. Here, the RS values for each corner state are averaged across the cohort to create a hypothetical subject with these average RS values. The RS values for this hypothetical subject are then converted to SG utilities, which give the disutilities or scaling constants ci. Similarly, the single-attribute utility functions are created by first averaging the single-attribute RS values and then converting these average values to SG utilities.
Subject-specific MAUF approach. Here, each patient’s corner state RS values are converted to utilities, and the corresponding disutilities give patient-specific ci. Similarly, each patient’s single-attribute RS values are converted to create subject-specific single-attribute utility functions. In the case that the risk aversion function is fitted using the random effects method, we can convert RS to SG using the population average risk aversion function (the estimated fixed effect parameter) or risk aversion functions that are specific to each individual (the estimated random effects). The population MAUF is constructed using the means of both the patient-specific ci and the patient-specific single attribute utility functions. With either approach (1) or (2), the overall scaling constant c is found as the solution of equation (2).
In the hypothetical subject approach, we do not have the option to use individual risk aversion functions to convert RS to SG. This means we have 15 different strategies for estimating the MAUF (Table 2): 3 risk aversion functions × 3 risk aversion models when we fit to individuals and 3 risk aversion functions × 2 risk aversion models when we fit to a hypothetical subject. We evaluated the performance of these 15 strategies with data collected in the validation exercise described below.
RMSE and MAE of Prediction and Ranking Based on RMSE for All 15 Modeling Strategies

RMSE, root mean squared error; MAE, maximum absolute error; MAUF, multiattribute utility function.
Validation and Selection of Overall Analytic Strategy
We distinguish between internal validation, which compares PORPUS-U and SG utilities in the development cohort (here referred to as cohort A), and external validation, which compares these utilities in 2 other cohorts not used to develop the MAUF (cohorts B and C). From cohort B, which included 248 PC patients in a study comparing the responsiveness of the PORPUS and other quality-of-life instruments, 28 we obtained directly elicited SG utilities for standardized health states representing mild and severe symptoms at 3 time points. From cohort C, which included 141 PC patients in a study assessing the reliability and validity of the PORPUS, 32 we obtained directly elicited SG utilities for the mild and severe marker states at 2 time points. The utilities for the mild and severe marker states were elicited along with SG utilities for patients’ own health using the PORPUS as a prompt, as described earlier.
We made an a priori decision that our final choice among the 15 MAUF-fitting procedures would be the one with the best predictive performance in cohort A. We first computed our prediction targets, the sample averages of directly elicited SG utilities for the 4 mapping states. Next, the PORPUS-U score and root mean squared error (RMSE) for prediction for each of these 4 states were calculated from each of the 15 MAUFs. The RMSE is the square root of the average squared difference between PORPUS-U and mean SG:
Results
Patients
A total of 353 PC patients were mailed letters about the MAUF development study (cohort A) between December 2000 and March 2002 (127 in cohort 1, 75 in cohort 2, and 151 in cohort 3). Figure 1 shows the process of patient recruitment. We were unable to contact 33 patients by telephone. Ten patients were not interested, 14 had no time, and 5 would not be returning to the clinic. Other reasons for not participating were health or family problems (n = 7), not wanting to talk about PC (n = 4), and poor English or visual or hearing problems (n = 10). Twenty patients declined but did not provide a reason. The remaining 250 patients were scheduled for an interview. Twelve patients were unable to complete the interview tasks; 3 had problems with reading, and 9 could not assign numerical ratings to health states. Three patients completed poor-quality interviews and were excluded. One patient did not complete the interview due to insufficient time before his clinic appointment. Therefore, 234 patients completed the study: 91 in cohort 1, 53 in cohort 2, and 90 in cohort 3. Table 3 shows their demographic and clinical characteristics. Patients ranged in age from 48 to 87 years (mean = 67). Time from diagnosis to study entry was well represented, with periods of 0 to 6 months, 6 to 18 months, and 18 to 54 months each containing 25% of subjects, whereas 10% were diagnosed more than 8 years before. Nearly 41% of the newly diagnosed patients had received radical prostatectomy, whereas only 10% had received radiation therapy. This was due to concurrent recruitment of patients into clinical trials investigating radiation therapy at the clinics. In Ontario, approximately 32% of newly diagnosed PC patients aged 60 to 69 years receive radical prostatectomy within 6 months of their diagnosis, and another 31% receive radiation therapy. 50 Approximately 42% of all patients had received hormone pills or injections, and another 5% had had an orchiectomy. These hormone treatments were most frequent among the metastatic patients (Table 3). Our sample was perhaps better educated (73% had attended college or university) and had a higher percentage of foreign-born individuals (almost 40%) than would be found elsewhere in Canada, reflecting the referral pattern of this tertiary care center and the multicultural population of Toronto.
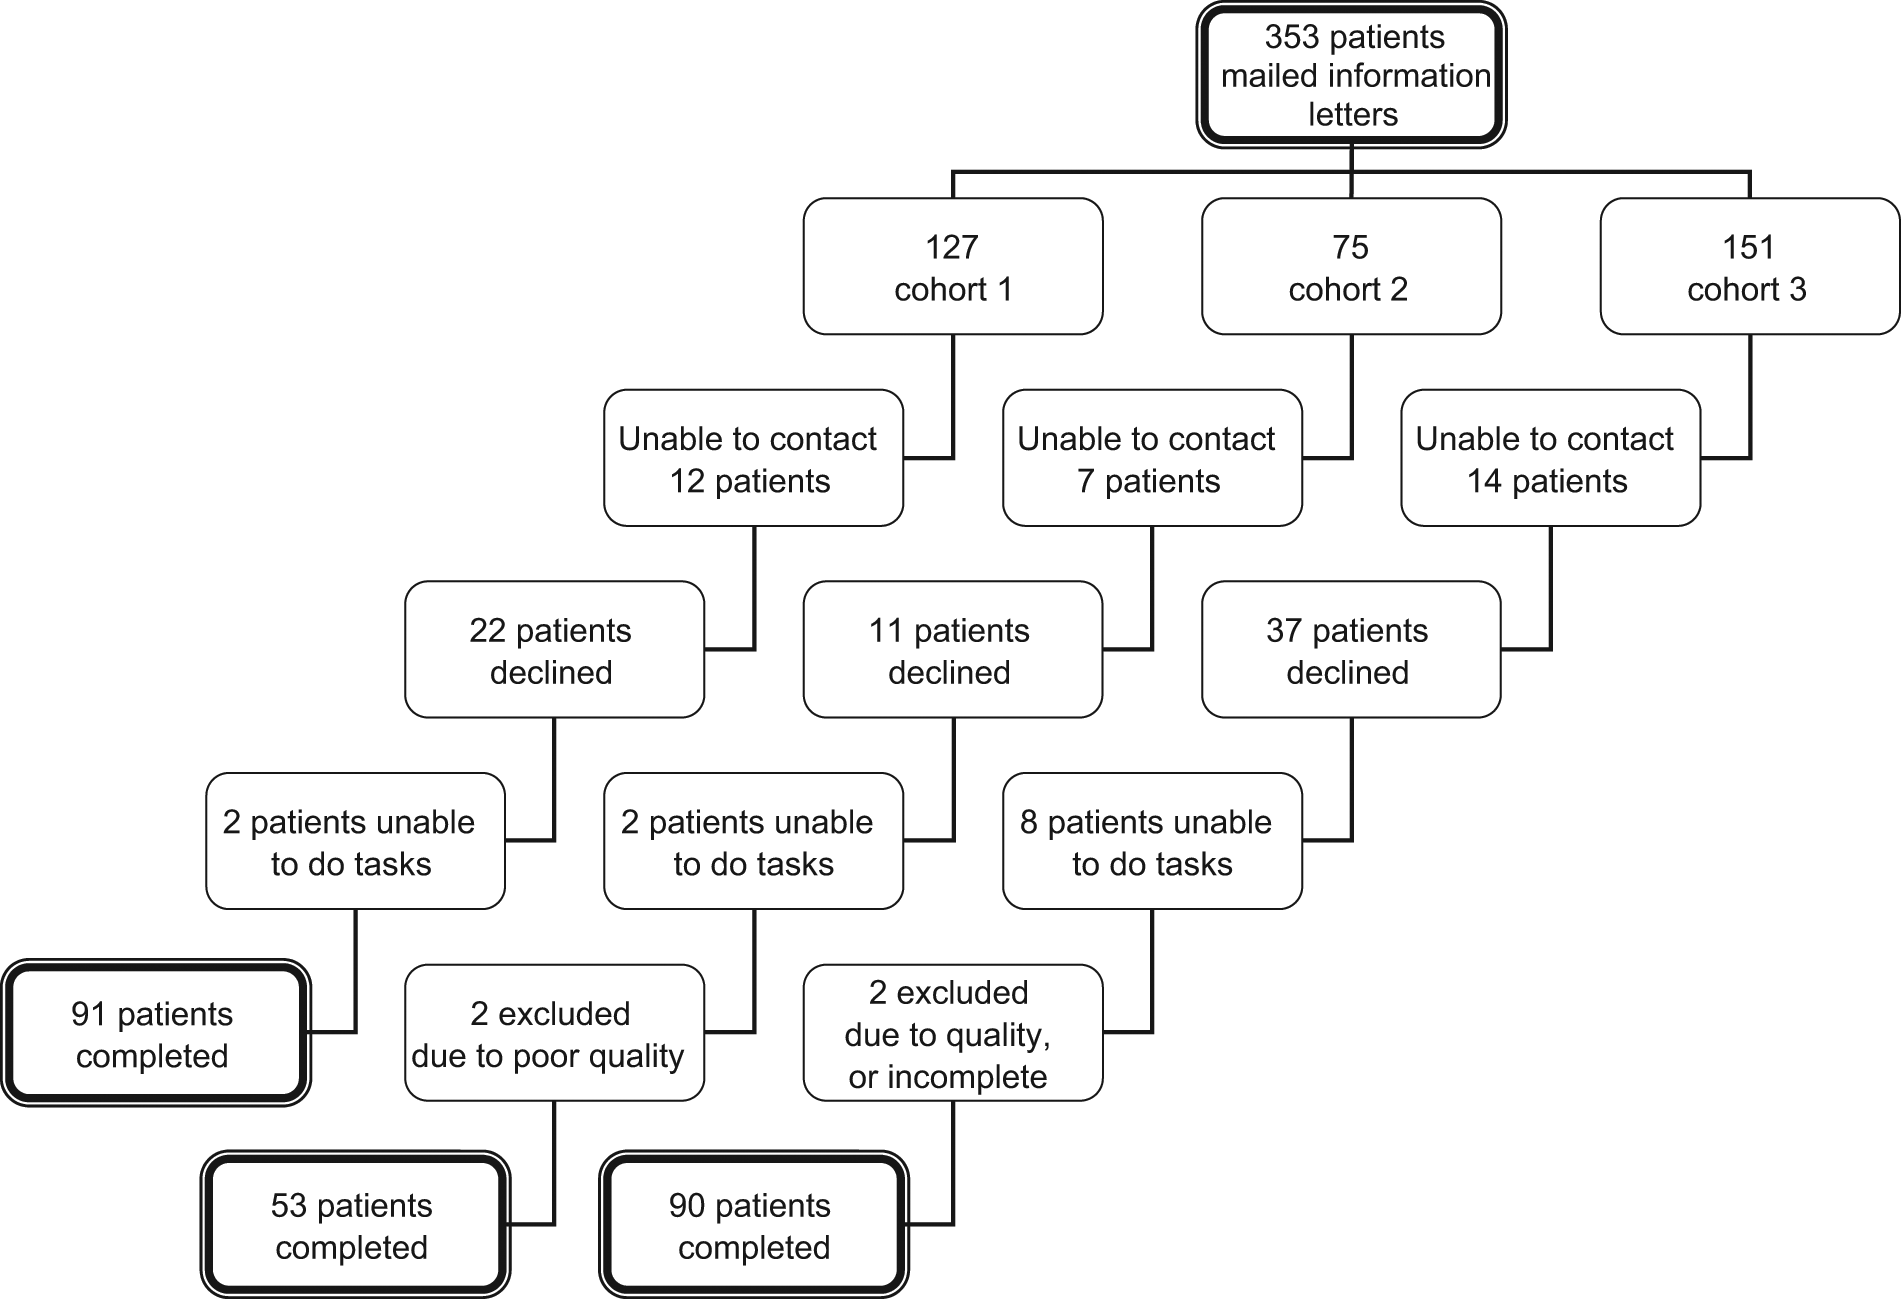
Patient recruitment and completion of study.
Patient Characteristics
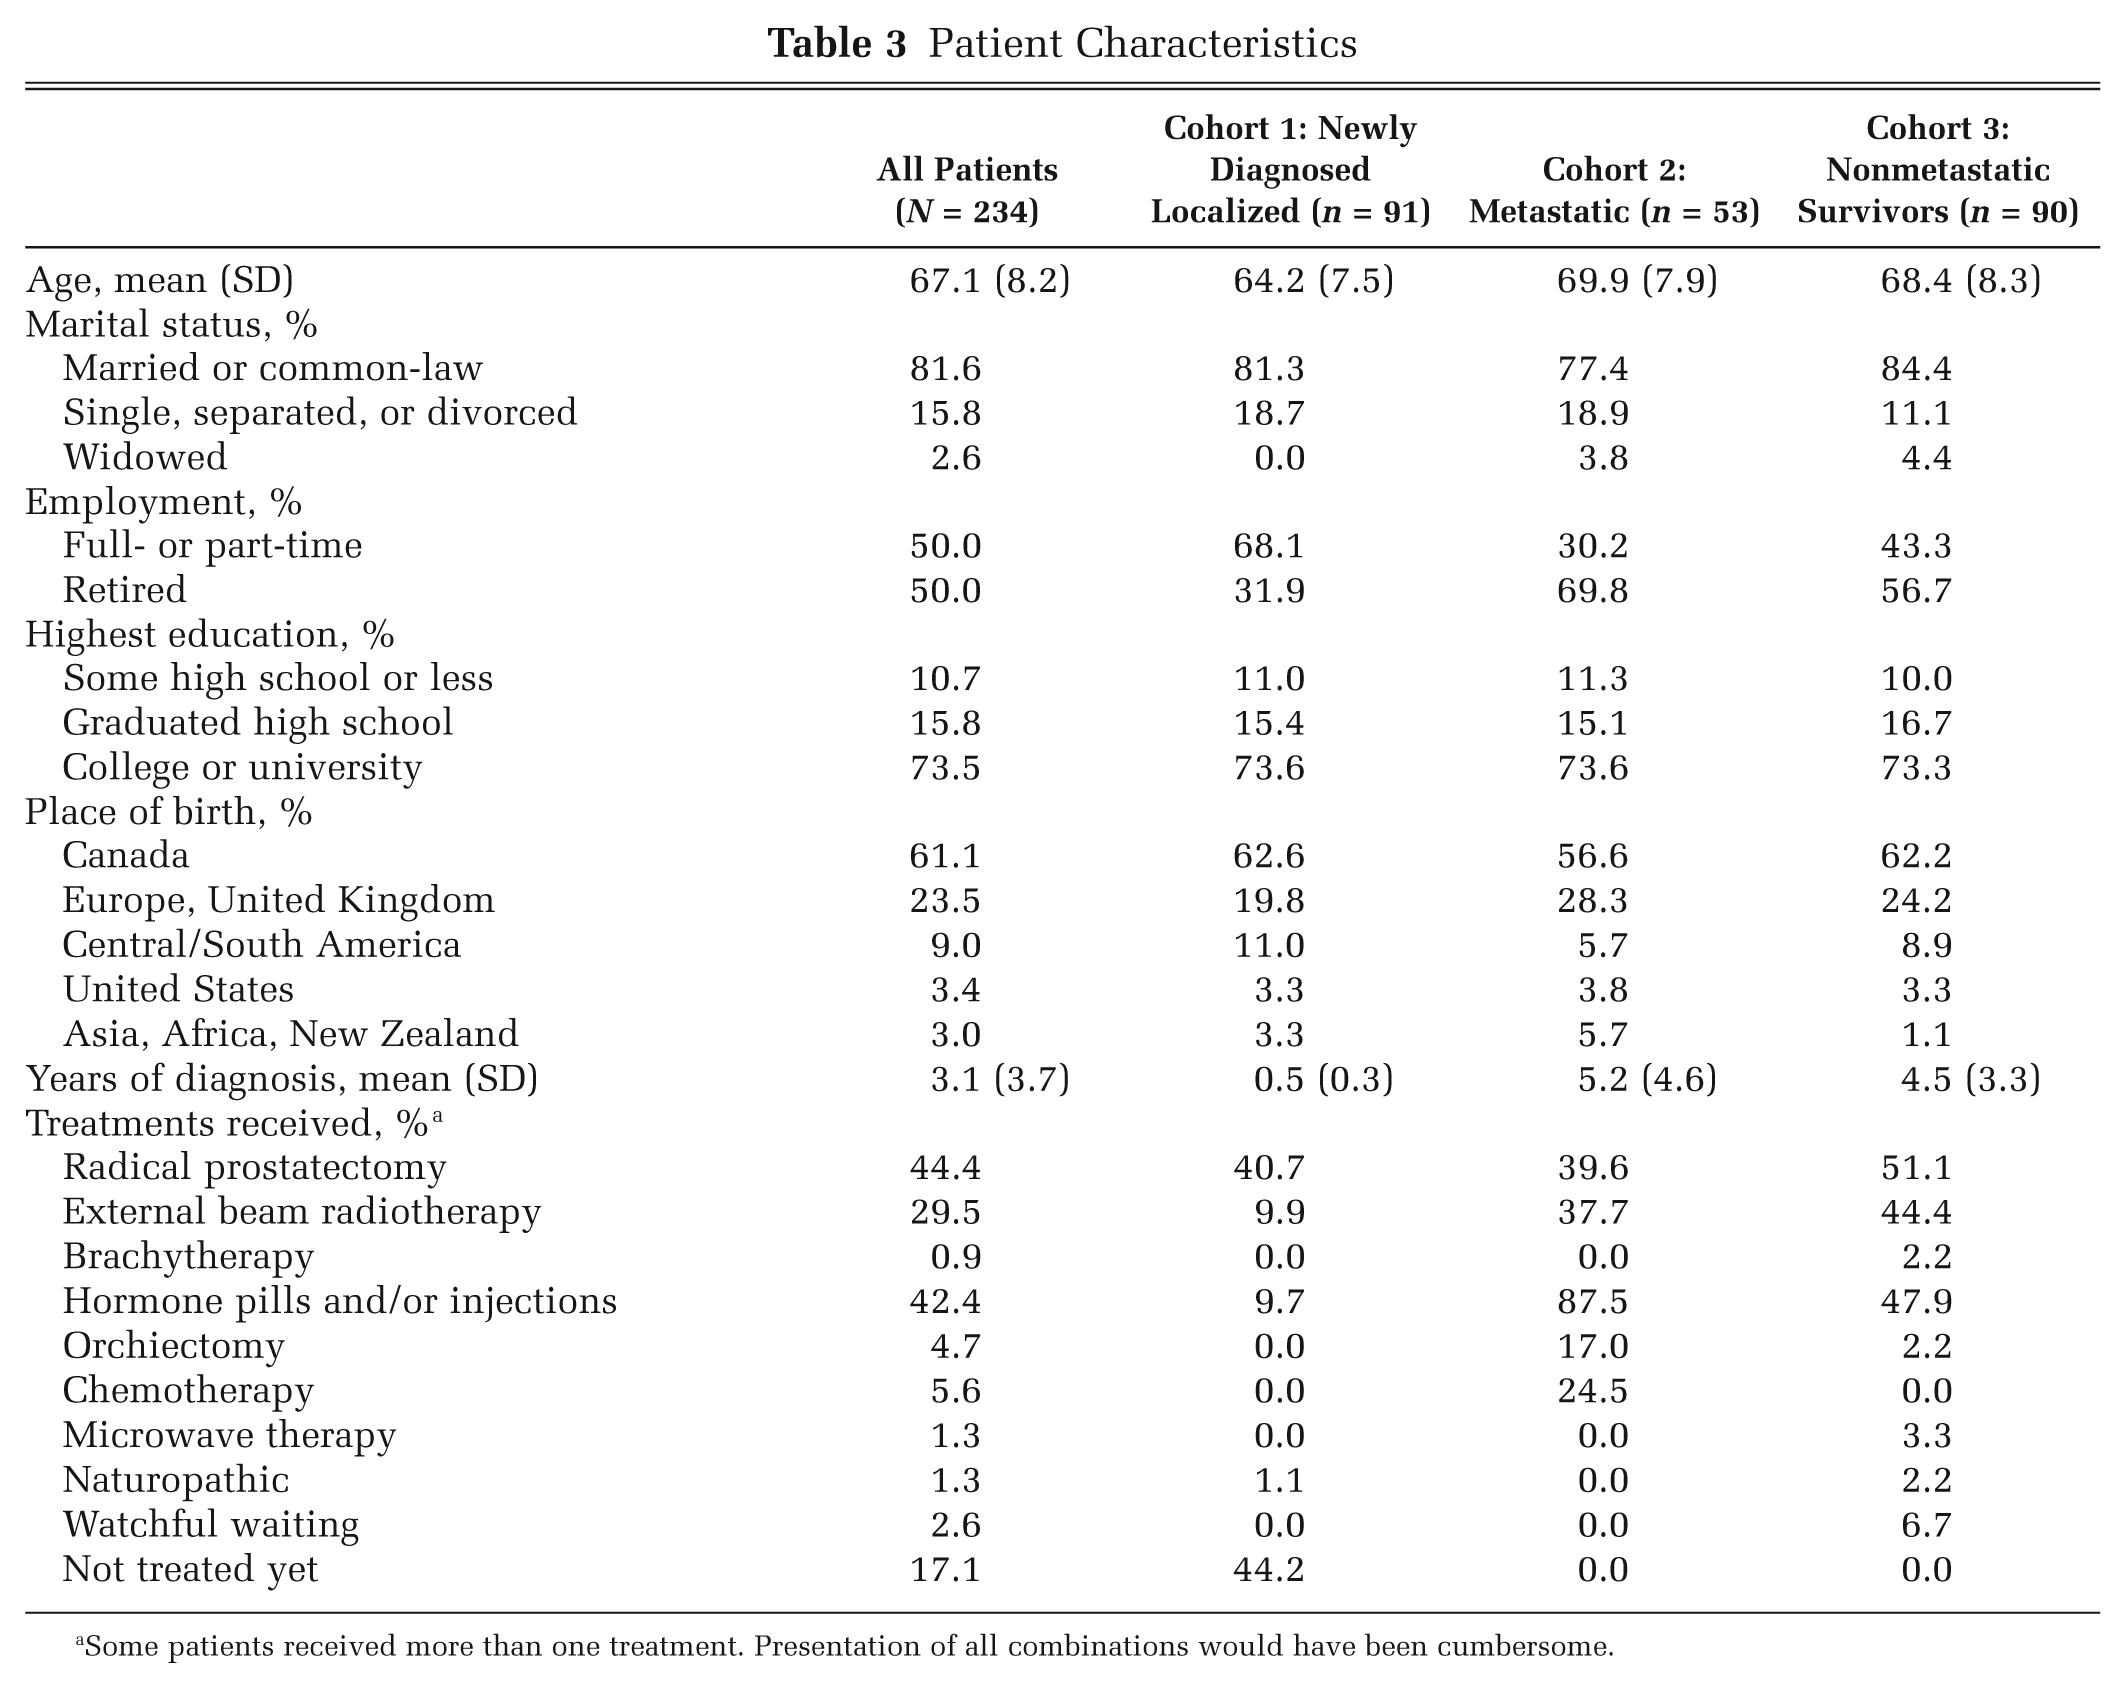
Some patients received more than one treatment. Presentation of all combinations would have been cumbersome.
Details concerning cohorts B and C, used for the validation of the MAUF, can be found elsewhere.28,32
Single-Attribute Values, Corner States, and Marker States
The bottom panel of Figure 2 shows the mean RS values for each level of the single attributes. RS values were fairly evenly spaced between the levels, and patients used the entire scale in assigning values with no identifiable ceiling or floor effects. The second worst level of the “urinary leaking” attribute had the lowest mean elicited value (0.1; SD 0.1). The second best level of the “energy” attribute had the highest mean elicited value (0.86; SD 0.08).
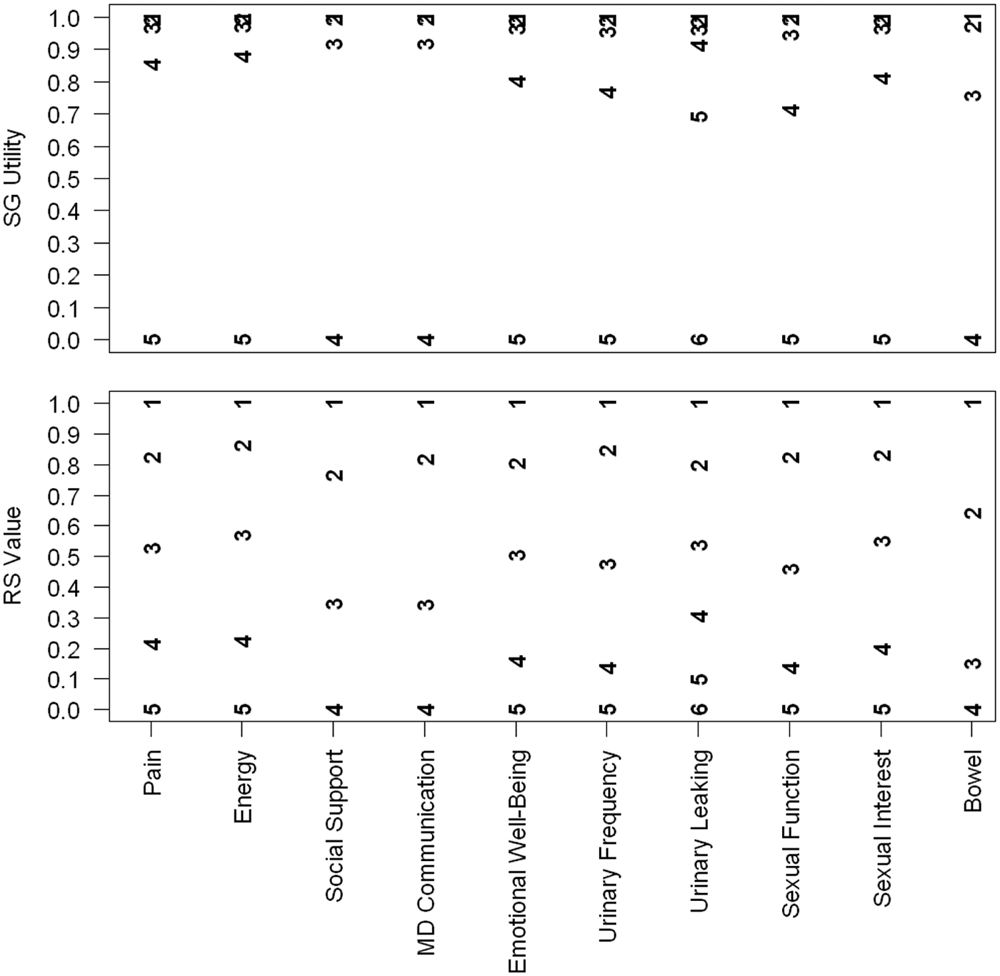
Single-attribute value and utility functions. The bottom panel shows the single-attribute value functions; the levels within each attribute are plotted at the means of the reported rating scale (RS) value, with 1 being the best level and 4, 5, or 6 being the worst level. For example, the mean RS value for the fourth level within the 5 levels of pain is near 0.2. The top panel shows the corresponding single-attribute utility functions obtained from applying the optimal risk aversion function to estimate standard gamble (SG) from RS.
Figure 3 shows box plots of the rescaled RS values for the 10 corner states, the 4 mapping states, and dead (defined as 0). The highest median RS value (90) was for the corner state for MD communication and the lowest (12) for pain. For all corner states, RS values extend over most of the range from 0 to 100.
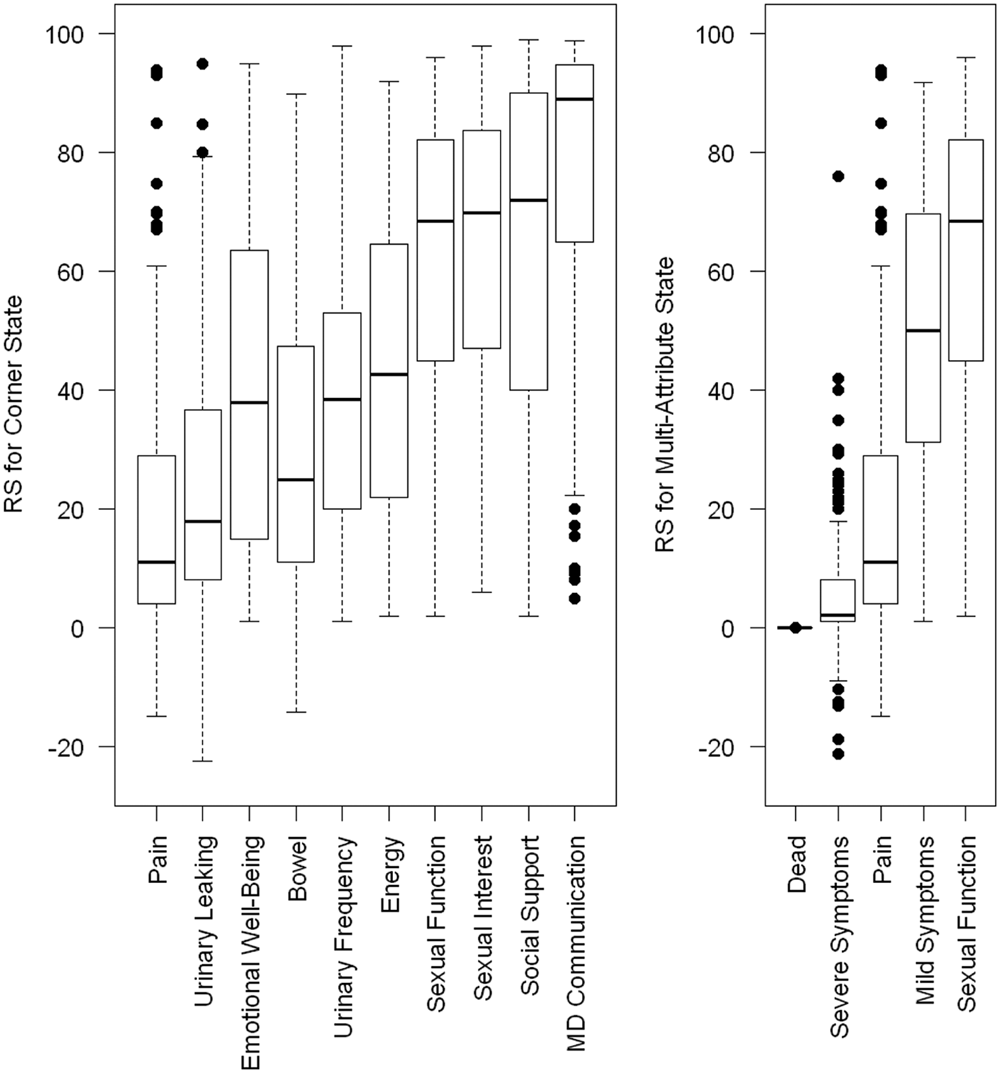
Box plots of rating scale values for 10 corner states and 5 multiattribute states. The box plot indicates the median rank with a bold line and the 25th and 75th percentiles with the top and bottom of the box. The whiskers extend to the most extreme data points, which are not more than 1.5 times the interquartile range from the top and bottom of the box. Rating scale (RS) values outside the whiskers are plotted separately.
Risk Aversion Function
Figure 4 has 3 panels. The left panel plots the observed RS-SG data from the 234 patients, with lines connecting points from the same individual for the 4 mapping states. The middle panel plots the sample mean SG utilities against the sample mean RS values for each multiattribute health state, with bars indicating 95% confidence intervals. A risk aversion function fitted to these sample means will poorly represent the risk aversion functions followed by most patients. We investigate the effect on the MAUF of using this sample mean approach to fitting the risk aversion in the “Choice of Optimal Strategy for Fitting the MAUF” section. There, we find that the best MAUF results from using the power disutility function with the random effects model as shown in the right panel of Figure 4. The dark line shows the power disutility function evaluated at the population average (fixed effect) value of α, and the light lines show this function evaluated at the individual 234 random effects.
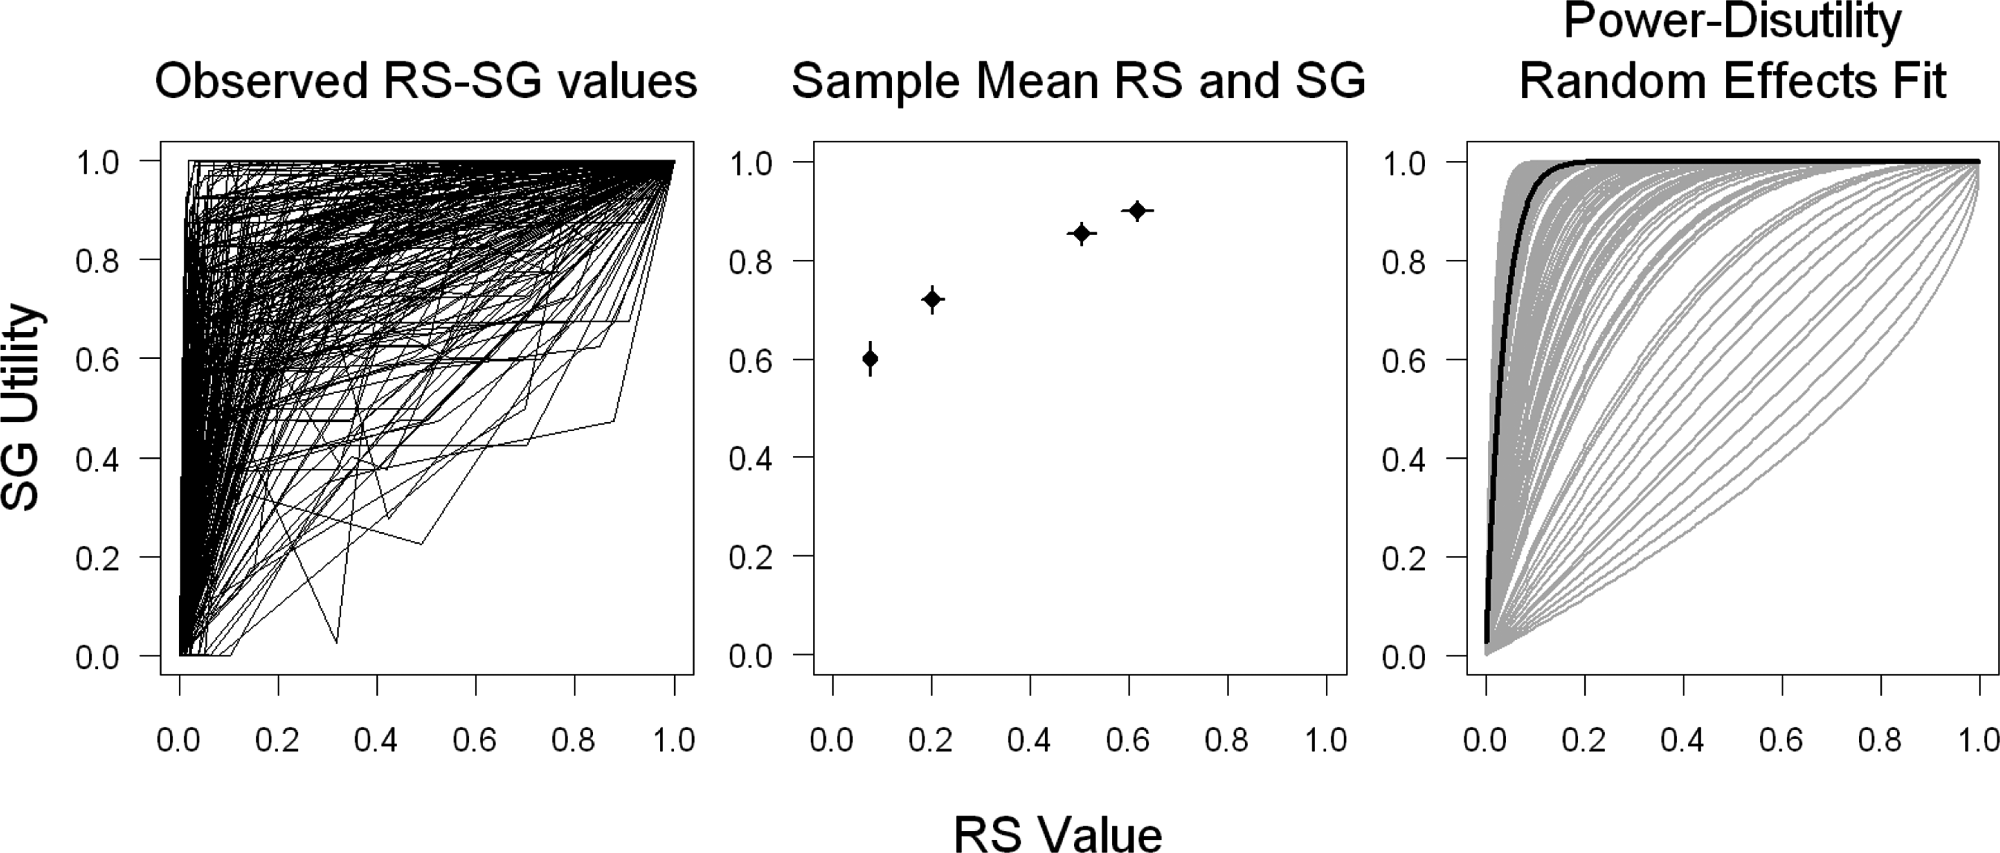
Observed and fitted risk aversion curves: the left panel plots the observed rating scale–standard gamble (RS-SG) data with lines connecting points from the same individual. The middle panel plots the sample mean RS values against the sample mean RS utilities for each of the 4 marker states, with 95% confidence intervals. The right panel shows the results of fitting the random effects power disutility risk aversion function to the 234 subjects. The dark line shows the average (fixed effect) function, and the light lines show the 234 random effects.
Single-Attribute Utility and Value Functions
Returning to Figure 2, the top panel shows the single-attribute SG utility functions for each attribute on the PORPUS. These functions measure the relative distance between levels within an attribute. For most attributes, the decrement in utility associated with moving down one level is larger for the worse levels. For example, the decrement between no urinary leakage (plotted with a 1) and the second level of urinary leakage (plotted with a 2) is 0.019. The decrements between subsequent levels are 0.039, 0.071, and 0.27. This represents a tendency for subjects to take less risk to avoid mildly undesirable health states than they would to avoid highly undesirable health states.
Choice of Optimal Strategy for Fitting the MAUF
Table 2 shows the RMSE and the rankings on RMSE for each of the 15 procedures. RMSE ranged from 0.06 to 0.23, with 10 strategies yielding RMSE of 0.1 or less. Comparing RMSE across the 3 risk aversion functions, no single function outperformed the others in all settings. Whereas the power disutility function had the highest RMSE values for a hypothetical subject, it gave the lowest RMSE for individual fitting of the MAUF. Combinations using the odds risk aversion function gave 3 of the 5 lowest RMSE values (0.07, 0.08, and 0.08). This risk aversion function performed well whether the subject-specific or hypothetical-subject approach was taken. One other trend was apparent—in the strategies that fitted subject-specific MAUFs, random effects risk aversion functions outperformed population average or sample mean approaches. By contrast, when the MAUF was fitted to a hypothetical subject, the sample mean risk aversion function had lower RMSE in 2 of 3 cases. Overall, the RMSE values identified 2 strategies we considered to be better than the rest. The random effects power disutility risk aversion fitted to individual subjects gave a slightly lower RMSE (0.063) than the odds risk aversion function fitted to sample means on a hypothetical subject (RMSE = 0.073). Because there is a precedent for use of the power disutility function, 45 we chose this approach for our final MAUF.
The Final MAUF
Table 4 and Appendix C show details of our final MAUF. A PORPUS-U for any health state identified by the PORPUS can be computed by multiplying the 10 item scores from Table 4 and subtracting the product from 3.642. An example is given below Table 4. Single-item disutility functions and parameters ci and c for the multiattribute disutility function can be found in Appendix C. The MAUF does not lend itself to easy interpretation, but by comparing health states that vary by a small amount, we can see what the parameters of the MAUF tell us about patients’ preferences for the levels within the attributes and for the relative importance of the attributes. For example, in the first 2 rows of the table in Appendix C, the single-attribute disutility functions are similar for pain and energy, but the scaling factors are c1 = 0.23 for pain and c2 = 0.06 for energy. The effect of a given amount of change in the single-attribute disutility function is larger for pain than for energy. With all other attributes at their best level, the PORPUS-U utilities for the 5 possible health states that come from varying the pain attribute are 1, 0.998, 0.992, 0.966, and 0.765. The PORPUS-U utilities for the 5 health states defined by varying only the energy attribute are 1, 0.999, 0.998, 0.993, and 0.944.
Scoring the Patient-Oriented Prostate Utility Scale (PORPUS)
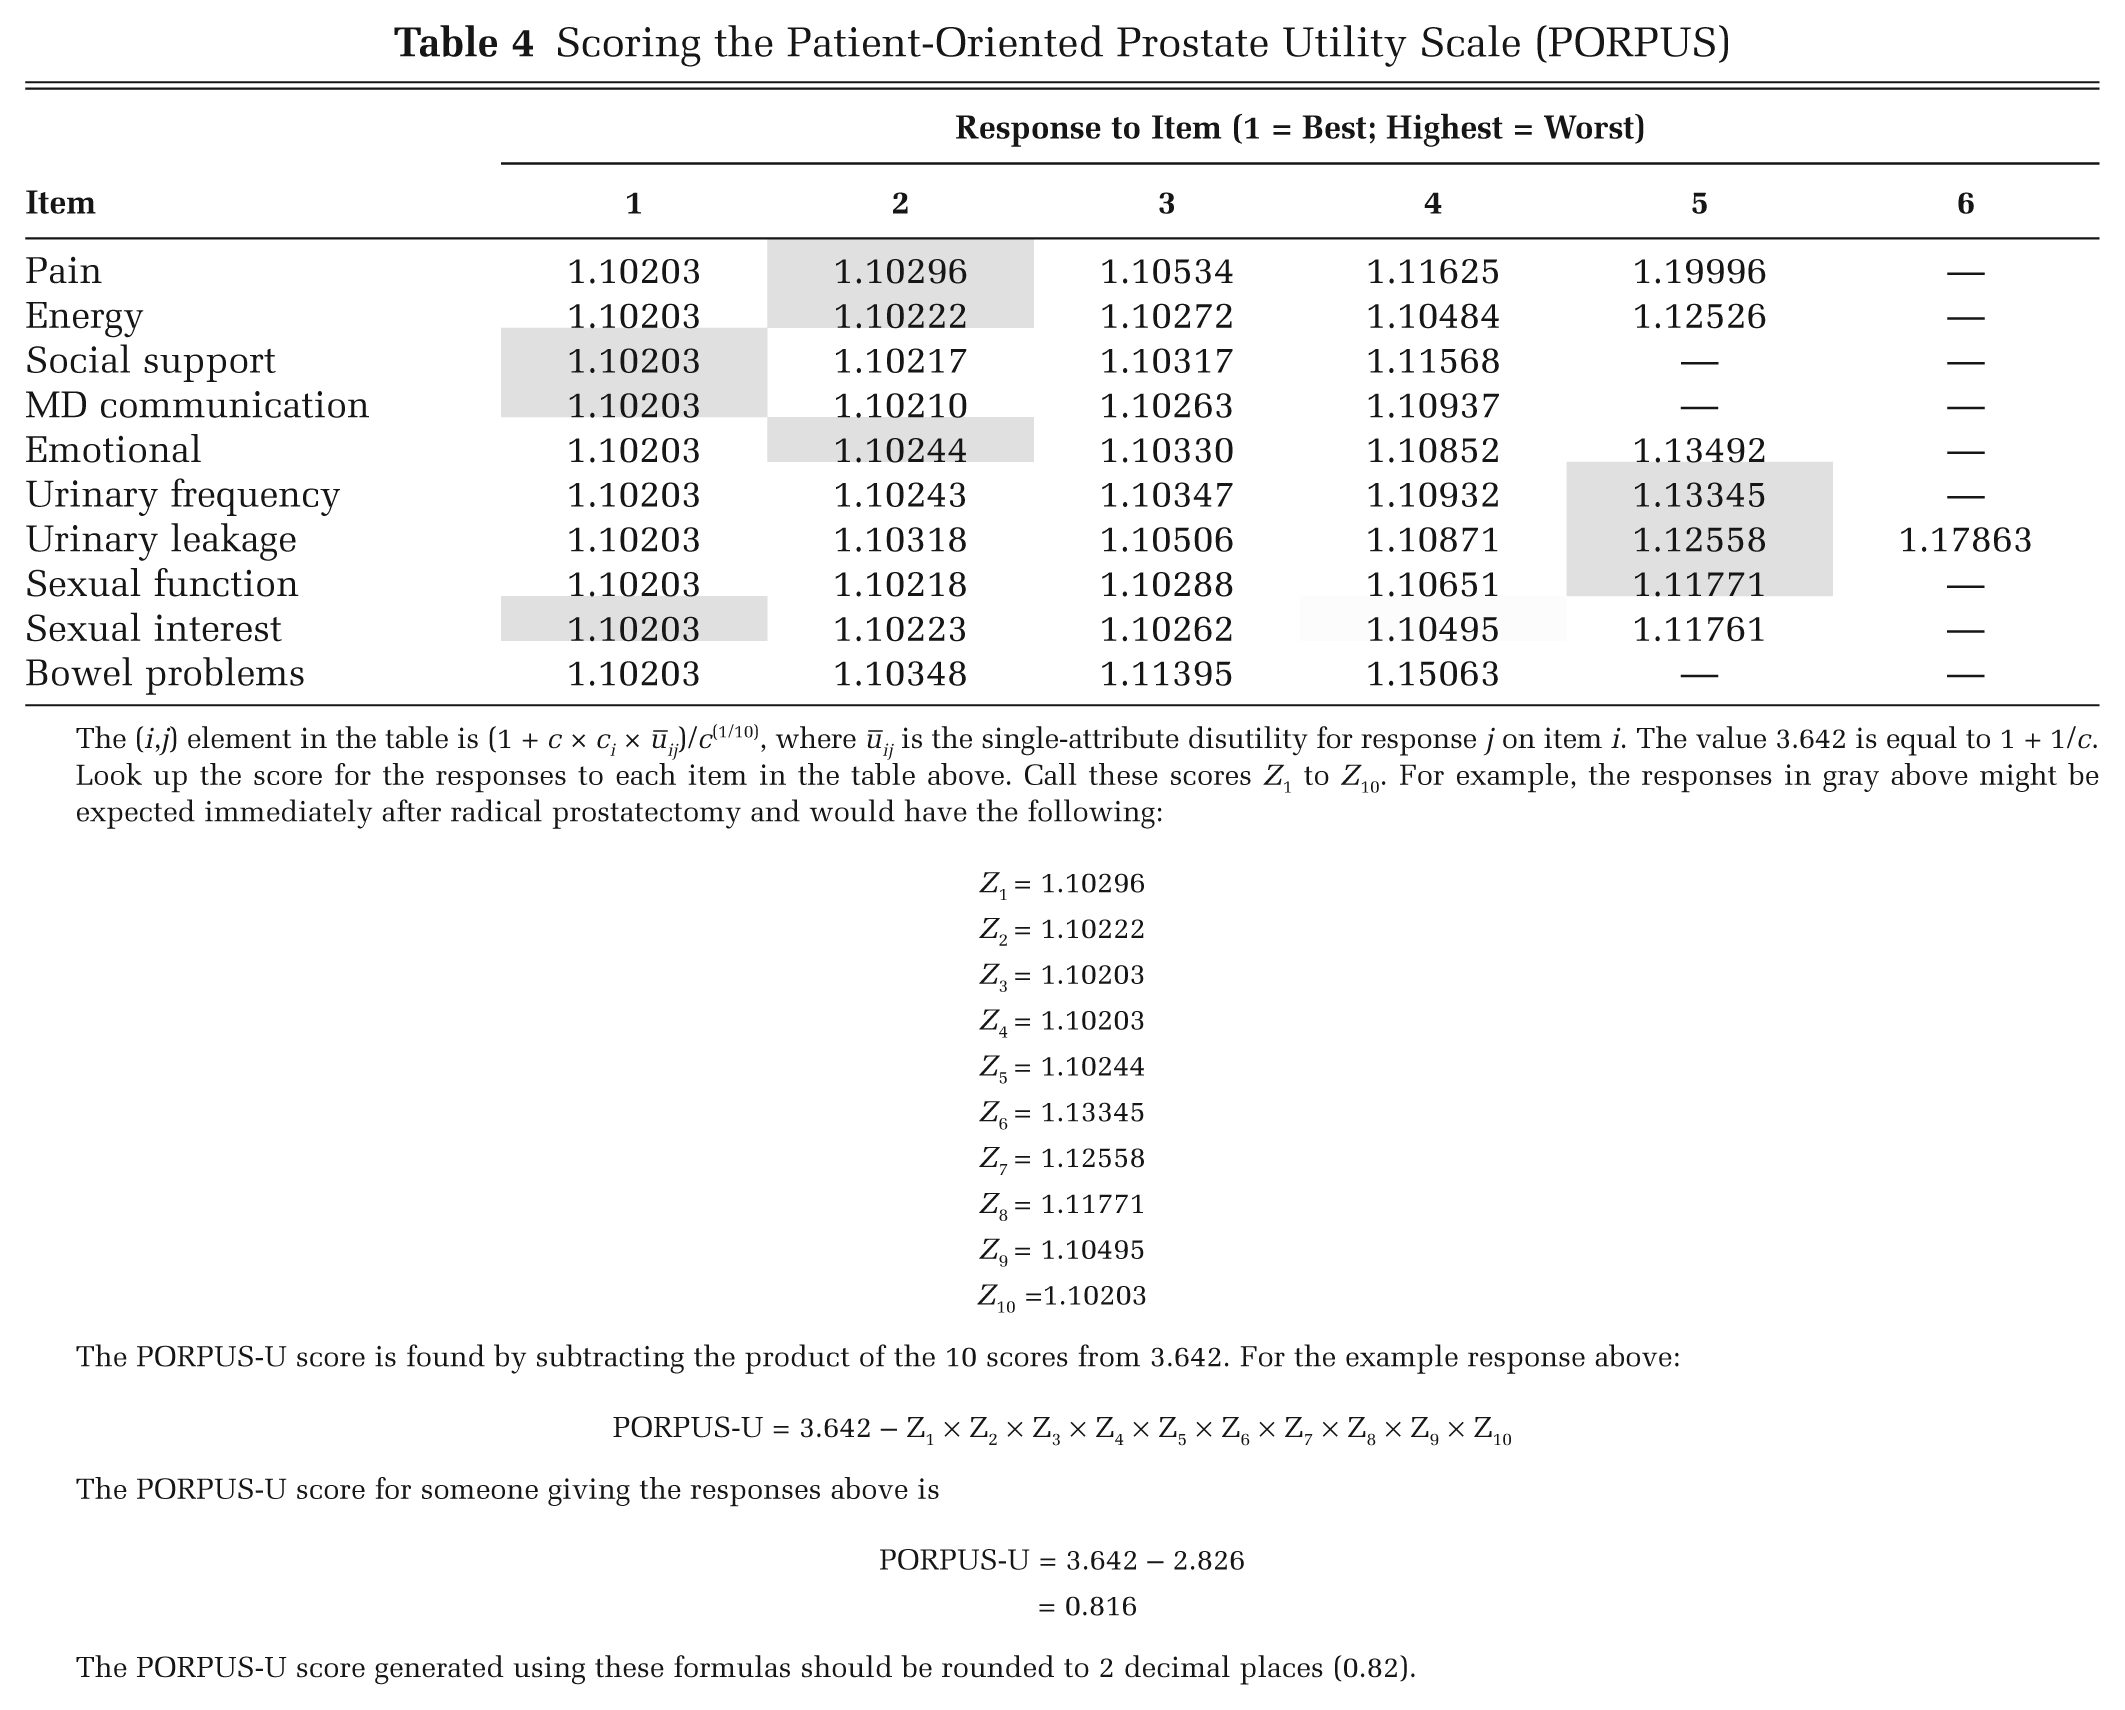
The (i, j) element in the table is (1 + c × ci × ūij)/c(1/10), where ūij is the single-attribute disutility for response j on item i. The value 3.642 is equal to 1 + 1/c.
Look up the score for the responses to each item in the table above. Call these scores Z1 to Z10. For example, the responses in gray above might be expected immediately after radical prostatectomy and would have the following:
The PORPUS-U score is found by subtracting the product of the 10 scores from 3.642. For the example response above:
The PORPUS-U score for someone giving the responses above is
The PORPUS-U score generated using these formulas should be rounded to 2 decimal places (0.82).
Validation
Figure 5 shows PORPUS-U scores and the means of directly elicited SG utilities in the development cohort (A) and the 2 external validation cohorts (B and C). The solid diagonal line represents equal observed and predicted utilities, and the dashed lines are added as a guide at a difference of ±0.1 between observed and predicted utilities. In the left panel, the PORPUS-U scores are plotted against the mean observed SG for the 4 mapping states. The PORPUS-U tends to overestimate the mean SG utility for the 3 states with highest SG and to underestimate the mean SG utility for the severe symptoms health state. The right panel shows PORPUS-U and mean observed SG for 2 multiattribute states in cohorts B and C. In cohort B (open circles), SG was elicited on 3 occasions, and in cohort C (triangles), SG was elicited on 2 occasions. In these validation cohorts, the mean SG scores were somewhat lower than the PORPUS-U scores for the mild symptoms health state, but mean SGs for the severe symptoms state were centered on the PORPUS-U utility for that health state.
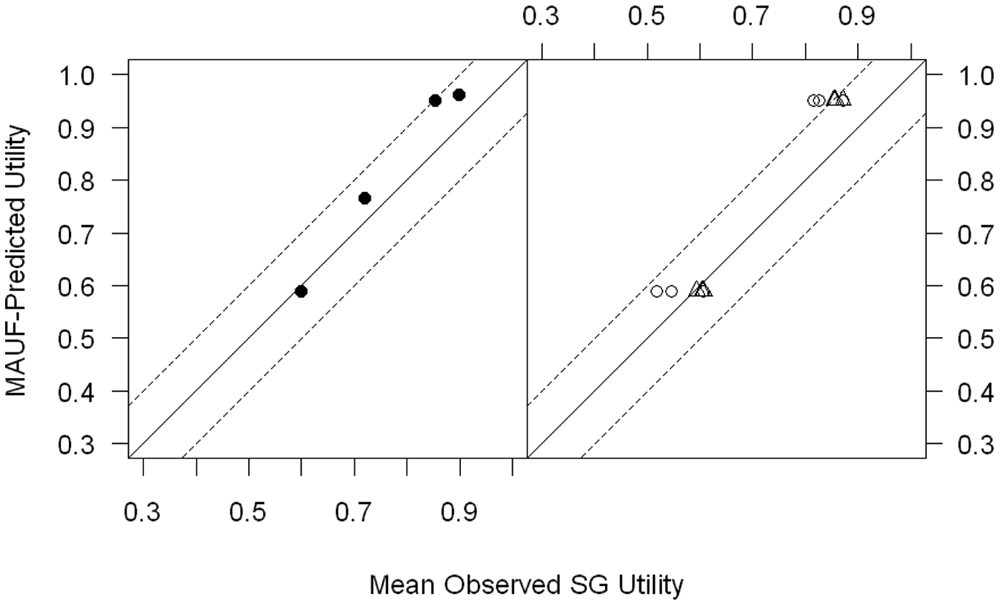
Validation results. In the left panel, the utilities predicted by the Patient-Oriented Prostate Utility Scale (PORPUS)–U are plotted against the mean observed standard gamble (SG) for the 4 multiattribute states in the development cohort (A). In the right panel, PORPUS-U predicted utilities are plotted against the mean observed SG for 2 multiattribute states in 2 external validation cohorts (B and C). In cohort B (open circles), SG was elicited on 3 occasions for each multiattribute state, and in cohort C (triangles), SG was elicited on 2 occasions. The solid diagonal line represents equal observed and predicted utilities, and the dashed lines represent a difference of ±0.1 between observed and predicted utilities. MAUF, multiattribute utility function.
Discussion
The PORPUS is a disease-specific health state classification system and utility instrument that measures function and impact of PC-specific and general quality-of-life domains. Most PC-specific quality-of-life instruments measure urinary, bowel, and sexual problems but do not provide a single utility score suitable for use in cost-effectiveness analyses or decision-analytic models.51,52 The PORPUS covers PC-specific and general quality-of-life domains, with much less response burden than completing 2 long questionnaires. As an indirect utility instrument, it is less burdensome and easier to administer than utility methods such as the standard gamble and rating scale.
In this study, we developed a multiattribute utility function for the PORPUS. We followed the general approach used by Torrance and others 43 in the development of the HUI-2 and Revicki and others44,45 in the development of 2 disease-specific utility instruments. Using a cohort of PC patients with a range of disease severities, we developed a weighting function that makes it possible to obtain patient-weighted utilities from PC patients by simply administering a questionnaire. In so doing, we confronted a series of methodological problems and choices, some of which had been outlined by Busschbach and others. 42 We revisit some of the considerations by Busschbach and others and describe how they relate to our development of the PORPUS-U.
The respondents: Whose values will be used to develop the MAUF? We chose PC patients as respondents because we believed that they would provide meaningful valuations of PC health outcomes. Although the consensus in health economics favors use of societal preferences, 30 we believe that the best and most comprehensive approach to economic evaluations involves multiple perspectives, including those of patients. Adaptation may play a role in inflating patients’ values for health outcomes, but members of the public may not be able to fully understand the experience of living with a disease or be able to imagine how their life might change in its presence. Both of these effects, as well as others, 53 pose measurement and theoretical challenges that, in our view, have not been fully resolved. Patients’ perspectives are particularly salient when the decisions are preference sensitive, as are many that relate to PC screening and treatment.
The MAUF model: What type of model will be used to map a multiattribute health state to a single utility? From the outset, the PORPUS was developed with the intention of using a multiplicative MAUF to map health states onto utilities. Taking the explicitly decomposed approach meant that a very specific type of data had to be collected and that the possibility of fitting other types of models (e.g., standard multiple regression models) was limited. It will be instructive to compare our current function with one we plan to derive from regression modeling on a subsequent cohort of patients who have completed the PORPUS and also given SG utilities for their own health.
Using the explicitly decomposed approach, we found that there were choices about the order in which data were aggregated and the form of the risk aversion function and the regression model used to fit it. The RMSE of prediction varied 4-fold over the 15 procedures generated by these choices.
The health states: The PORPUS defines 6 million unique health states. The explicitly decomposed approach prescribes that the 10 corner states be used for value elicitation. Busschbach and others42 describe this as fitting the function space from the “outside in”—inference about health states that are not at the extremes is based on parameter estimation at perhaps unrealistic extreme health states. In this study, some patients commented on the corner states; for example, how could anyone have no worry, sadness, or frustration if they had severe bowel problems? This may have affected the validity of patients’ assessments of their own preferences for these health states. Again, it would be instructive to compare the current MAUF, based on evaluation of extreme values, to one built using a statistically inferred approach or to modify some of our health states, for example, by using subscales for some domains of health and collect new data to fit a MAUF to the revised instrument.
Aggregation: When and how in the analysis should data be pooled? The data collected allow a MAUF to be fitted in aggregate or to each person: The 10 corner state utilities and single-attribute utility functions perfectly identify the parameters. The concavity of the risk aversion function and the nonlinearity of the MAUF mean that different final MAUF models result from switching the order of aggregation and value-to-utility conversion.
The criterion: What numerical measures will be used to select among alternative analytic strategies? There is no statistical model behind the explicitly decomposed approach that would allow selection of the MAUF parameters by optimizing fit, in the way that linear regression minimizes a sum of squared residuals or logistic regression maximizes a likelihood. Therefore, the explicitly decomposed approach provides no natural measures of overall model fit or a mechanism for producing standard errors for model-predicted utilities. We used prediction error to assess the fit of the MAUF out of 15 variations on the decomposed approach. We selected the one that gave the best prediction error for the mapping states. Notably, our approach does not optimize the fit of RS to SG in the estimation of the risk aversion function but rather the overall fit of the PORPUS-U to the mean SGs for the health states used for validation. Given that our prediction error varied to a significant degree over the 15 procedures, we recommend that anyone using the explicitly decomposed method to fit a MAUF should consider these or similar variations. With only 4 health states for validation, we were somewhat limited in our assessment of the concordance of the PORPUS-U with mean SG utilities. Hindsight suggests that we should have used more multiattribute health states for validation, perhaps randomizing each patient to give SG utilities for 4 out of 20 representative health states. However, when the program of research leading to the PORPUS began (1998), 31 we were not aware of potential problems with value-to-utility mapping.
To reduce response burden, RS values rather than SG utilities were elicited for the single-attribute functions and for the corner states. The RS data were converted to utilities for fitting the MAUF through the risk aversion function built upon RS-SG pairs for the 4 mapping states. Our results show that the risk aversion function has a central role in correct calibration of the MAUF to SG utilities when the HUI model-building approach is used. Among the options we investigated for mapping RS to SG, the RMSE varied 4-fold. Although it has been more than 10 years since Dolan and Sutton 54 explored some of the theory behind this mapping, it appears that the choice of function and the approach to fitting it have been given relatively little attention. Only recently has the importance of accurate mapping between RS and SG in the construction of a MAUF been highlighted.39,40 Future work should explore the feasibility of using SG measurements directly in the decomposed approach, as the response burden did not appear to be unreasonable for our patients.
Conclusions
For valuation of standardized health states, indirect utility instruments have many advantages over direct utility assessment through techniques such as the standard gamble. They impose a lower burden on the respondent, are easier for study personnel to administer, and can be given to a large number of patients, by mail or in a clinic or a study. For these reasons, indirect utility assessment tools such as the HUI21,22 and EQ-5D 24 are widely used. However, these generic instruments may not be sensitive enough to detect the impact of disease-specific symptoms on health-related quality of life. 28 To our knowledge, there are only a few disease-specific indirect utility instruments available,44,45 and none are specific to PC. The PORPUS-U can now be added to the list of disease-specific utility instruments.
The development of the PORPUS as a disease-specific multiattribute utility instrument using preference weights is now complete. Utilities for PC outcomes can be obtained by completion of a 10-item self-administered questionnaire. As the PORPUS-U becomes more widely used, data will be collected to define clinically and minimally important differences. Future development of the PORPUS and related instruments should evaluate the relative merits of MAU-based and regression-based approaches and the possibility of using a smaller number of attributes. The MAU approach offers the possibility of combining several attributes into a submodel before they are combined with other attributes to define a health state. This would offer a solution to the problem of implausible combinations of attribute values mentioned by some patients. Finally, we would like to assess the effects of using community preference weights on the MAUF.
Footnotes
Appendix A The Psychometric Porpus
By using the formula below and the responses on the 10 items, the PORPUS can be used as a psychometric instrument (PORPUS-P) that gives equal weight to each of the items and produces scores ranging between 0 and 100.
In this formula, the original scores on each item are X1 to X10, where, for example, X2 = 3 if a subject endorsed answer 3 on question 2. The maximum possible scores on each item (i.e., the number of response categories for each item) are M1 to M10, and COMPLETE is the number of items out of the 10 that are completed. For a fully complete questionnaire, COMPLETE will be equal to 10, but this formula allows for pro-rating of the observed score to a full score out of 100. We suggest that at least 8 items are completed for a PORPUS-P score to be computed. For a fully completed questionnaire, each item contributes between 0 and 10 points to the final score, and the sum of the 10 item scores is subtracted from 100 so that higher scores represent better quality of life.
Appendix B Examining the Sensitivity of Model Selection to RS Values for Dead That Are Lower Than RS Values for Worst Health
Our health state valuation task was designed with worst health as the low anchor and full health as the high anchor. Subjects were asked to give rating scale values to the 10 corner states, the 2 additional marker states (mild and severe PC symptoms), and the state of being dead on this worst health to full health scale. Our standard gamble task was designed with dead as the low anchor and full health as the high anchor. One important step in our model-fitting algorithm is the conversion of rating scale values to standard gamble utilities through the 4 health states where we have both types of valuations.
The 2 scales need to be calibrated to the same low anchor before this conversion can take place. For a subject who rates dead better than worst health, we use the transformation in equation (1) to convert the observed valuation of a health state (HS) on the worst/full health scale to a valuation on the dead/full health scale, where V(dead) is the subject’s valuation of dead on the worst/full health scale. Notice that if HS is dead, then the rescaled value is 0. Any health states worse than dead on the original scale have negative valuations on the dead/full health scale.
Our RS valuation task did not allow subjects to rate dead worse than worst health. Presumably, some of the subjects who gave a rating of 0 to dead would consider it worse than worst health if given the chance to express that preference. Using the observed values of 0 for all of them could potentially lead to incorrect conversion of values to utilities, with a propagation of any errors throughout the remaining model fitting. To assess the consequences of this potential error, we carried out sensitivity analyses, first making various assumptions about the true rating of dead for those that had an observed rating of 0 for dead and then recomputing our multiattribute utility function as described in the article. The details of the sensitivity analysis are presented in the next section.
After a subject was assigned a negative rating scale value for dead, the same equation (1) was used to transform values to the dead/full health scale.
The plot below shows the impact of different valuations of the dead health state on the rescaling of values from the worst health/full health scale to the dead/full health scale. When we observe dead to be better than worst health, all rescaled values are lower than the raw values, with the decrease being most pronounced for low raw values. In the subjects for whom we assign a negative value for dead in the sensitivity analysis, the rescaled values are all larger than the corresponding raw values, with the increase being largest for low raw values.
Appendix C Parameters of Multiattribute Disutility Function
The MAUF below, along with the constants and single-item disutility functions in the following table, can be used to compute a disutility for any health state defined on the PORPUS-U. The overall scaling constant c was estimated to be equal to 0.379:
The utility is then 1 – Ū(
This study was funded by a project grant from the National Cancer Institute of Canada (NCIC 011393).
Dr. Naglie is supported by the Mary Trimmer Chair in Geriatric Medicine Research. Dr. Krahn is supported by the F. Norman Hughes Chair in Pharmacoeconomics, Faculty of Pharmacy, University of Toronto.