
Abstract
The measurement of quality-adjusted life years for use in cost utility analyses has increasingly employed multiattribute utility instruments (MAUIs) to estimate health state utilities—that is, the strength of people’s preference for different health states. However, the role of utility in cost utility analyses has been challenged, and some have suggested that the benefit of a health program should be measured using—or at least taking account of—the subjective well-being (SWB) of patients as measured in the psychological literature.1–10 Similarly, it has been argued that program evaluation should take account of the change in a person’s “capabilities,” as described by Sen 11 and other economists12–17 and operationalized in the ICECAP instrument by Al-Janabi et al.18,19 These suggestions raise the question of the relationship between utility, SWB, and capabilities. The present article is concerned with the first 2 of these constructs and specifically with 2 questions. The first is the extent to which different MAUIs correlate with 3 separate measures of SWB. The second is the extent to which utility, as measured by the MAUI, can take account of—explain variation in—SWB.
SWB Versus Utility
“SWB” and “utility” are terms that have been used flexibly in the economics and psychology literatures to describe overlapping concepts. Kahneman et al. 4 employ the term “utility” to refer to both concepts. They draw a distinction between “experienced” and “decision” utility. The latter is the usual concept of utility included in economic theory: it refers to the strength of a person’s preference for an option before it happens and is revealed by one’s subsequent decision. MAUIs seek (with contestable success) to measure this concept. In contrast, “experienced utility” is Kahneman and colleagues’ term for the pleasure or pain that occurs as a result of a decision. The duration of the experience, however, is not well defined, varying from the pleasure/pain or satisfaction of the moment to the recall of past events. In the literature, economists have commonly employed the terms “subjective well-being” and “happiness” to denote a similar (imprecise) concept. For example, while Dolan and Kahneman 7 retain the term “experienced utility” for their preferred unit of measurement, Dolan 6 prefers the term “SWB” and, in 2011, the term “happiness.” 8 Dolan recognizes the imprecision of the concepts when he states that “the kind of experience or subjective well-being (SWB) I have in mind here is a very broad one, including not only hedonic pleasure and pains but also the less hedonic aspects of our experiences, such as engagement, purpose and meaning.”6(p93)
A similar fluidity exists in the psychology literature. Different instruments measuring SWB include 1 or more of 3 components: life evaluation—people’s satisfaction with their lives in general or aspects of their lives; positive and negative affect—a person’s feelings/emotions at a point in time; and eudemonia—a positive sense of purpose and meaning. 20 While these dimensions are often conflated in the notion of “happiness,” they capture different dimensions of well-being, and their measurement is the subject of a large literature.2,21–23 In the remainder of the article, the term “utility” is used to refer to the “decision utility” measured by MAUIs, and the term “SWB” refers to “experienced utility” as measured by SWB instruments.
Despite the variable and evolving terminology, “utility” and “SWB” have both been operationed by economists and psychologists, and the resulting instruments have been influential. The present article is concerned with the relationship between the constructs measured by these instruments. If people have a preference for high, rather than low, SWB as might be expected, then SWB and utility will correlate. In the extreme, if people maximized their SWB, then the 2 constructs would correlate perfectly. In contrast with this expectation, empirical evidence indicates a relatively low correlation between the utility measured by MAUI and common measures of SWB. 24 In part this is because utility may encompass a wider range of considerations than SWB. 25 In a survey of the Australian population, for example, respondents rated their own happiness as of lesser importance than the happiness of their children or choice per se. They rated their own happiness as of equal importance as autonomy and duty. 26 The correlation between SWB and utility cannot therefore be used to determine the extent to which individuals who make utility judgments have taken SWB into account. Additionally, the content of an MAUI is necessarily limited by the content of its descriptive system, and context-specific elements of utility may be omitted. For this reason, it is arguable that a term such as “health utility” or “multiattribute utility” should be employed to emphasize this limitation. The literature has not, however, adopted this convention.
Nevertheless the differences and the reason for the differences among the constructs measured by MAUIs and SWB instruments have policy significance. If MAUIs fail to take account of SWB and if SWB is considered to be important, then a case may be made for their replacement or for the supplementation of utility with measures of SWB. In recent years, this case has been argued persuasively in the literature.1–3,5,7–9 The case does not depend entirely on empirical evidence, as it is possible to argue normatively that policy decisions should be based on SWB. However, the argument is significantly strengthened if it can be shown that utility does not, or cannot, take account of SWB. Conversely, the argument for utility-based policy is strengthened if it can be shown that utility can largely take account of SWB and that deviations between utility and SWB are the result of instrument-specific limitations or additional considerations that legitimately influence preferences but do not directly affect SWB.
Criticism of utility has focused on the ability of individuals to imagine hypothetical states and to assess them as if they were truly experiencing them. Kahneman et al.,4(p 376) for example, argue that “systematic errors in the evaluation of past events and decisions that do not maximize future experience utility can be observed in decision makers whose cognitive functions are normal” and Smith et al. note that “an entire subfield within psychology deals with the errors and biases that occur when people attempt to forecast what their quality of life would be like in different circumstances.”25(p86) A particular problem arises because, as Dolan and Kahneman7(p230) state, “people adapt to changes in their circumstances but they often fail to appreciate the degree to which they will adapt to these changes.” In support of the argument, the authors cite a review by De Wit et al., 27 which found that 23 studies reported health states to be rated more highly by patients than by the public, 2 studies where the reverse was true, and 11 where no difference occurred.2,20–23,25(p86),26,27
Despite these arguments, neither the theoretical differences nor the empirical evidence necessarily indicates that utility is unable to take account of SWB. In the empirical studies employed by cost utility analysis, the assessment of utility is based on a health state description, and the extent to which the assessment takes account of SWB necessarily reflects the description presented to raters. The failure of utility to reflect subsequent SWB may therefore be the result of the health state description provided by an MAUI rather than the incommensurability of the 2 constructs. In particular, in every case where it has been studied, mental health has been found to be the most important determinant of individual happiness. 28 Consequently, the strength of the association between an MAUI and SWB is likely to be associated with the extent of the description of psychosocial health in the instrument’s descriptive system.
The present article employs 3 measures of SWB and 6 MAUIs to examine these hypotheses. It presents 2 tests. The first is the correlation between measures of SWB and utility. The prior expectation is that the correlation will rise with the psychosocial content of the instrument’s descriptive system. The second test is the extent to which variation in the measures of SWB can be explained by the MAUI.
Utility may also be assessed by the evaluation of a context-specific holistic health state description in conjunction with a utility-scaling instrument, such as the standard gamble or time trade-off. The more general hypothesis is that in these cases, a failure of utility to account for SWB may also be a result of the description used. The present study does not test this more general hypothesis. It is pragmatic in the sense that it employs available instruments. In the absence of a gold standard for the measurement of either utility or SWB, this is a necessary limitation. 28
The following section describes the methods, instruments, and data used to investigate the 2 study questions—namely, the correlation between 3 measures of SWB and 6 MAUIs and the extent to which variation in the measures of SWB can be explained by the MAUIs. Results are presented and discussed in the subsequent 2 sections.
Methods
Two tests were conducted with data from a large multi-instrument survey of the healthy public and patients in 7 chronic disease areas. The survey included 6 MAUIs and 3 SWB instruments. The first test was to compare the extent to which utilities measured with the 6 MAUIs respond to changes in 3 measures of SWB. Unadjusted beta coefficients were calculated, which indicate the change in utility, measured in standard deviations, with a change in SWB of 1 standard deviation. The second test replicated the methods used by Böckerman et al. 29 The 3 measures of SWB were firstly regressed upon sociodemographic variables and 7 dummy variables, each of which indicated that a respondent had 1 of the 7 chronic diseases. Coefficients therefore indicated the average differences between the SWB of respondents in a disease group and respondents from the healthy public. Second, utility as measured by 1 of the 6 MAUIs was included in the regression. If an MAUI took full account of variation in SWB, then dummy variables in the second regression would be insignificant. The diminution in the magnitude of the coefficient on each dummy variable indicates the responsiveness of the MAUI to SWB in the corresponding patient group.
Questionnaires
The 3 SWB instruments are described in Table 1. The Satisfaction with Life Scale (SWLS) is a widely used instrument whose reliability has been repeatedly established.23,30 Similarly, the Personal Wellbeing Index (PWI) is an established instrument that has been subject to extensive testing.31,32 In contrast, the instrument labeled here as the “ONS” is new and has no official name. It was introduced into the UK “Integrated Household Survey” of the Office for National Statistics (ONS) in 2011, and the first results were published in December 2011 and February 2012. 33 Despite their attempt to measure the same concept, the form and content of the instruments differ. The SWLS is focused exclusively on satisfaction with present and past life. Statements primarily alter the way in which the 2 questions are asked. The PWI is similarly focused on satisfaction. Unlike the SWLS, it nominates the major life domains and does not refer to past life. The ONS has only 1 satisfaction question. It seeks to incorporate all dimensions of SWB by including questions to measure eudemonia and positive and negative affect.
Three Subjective Well-being Instruments
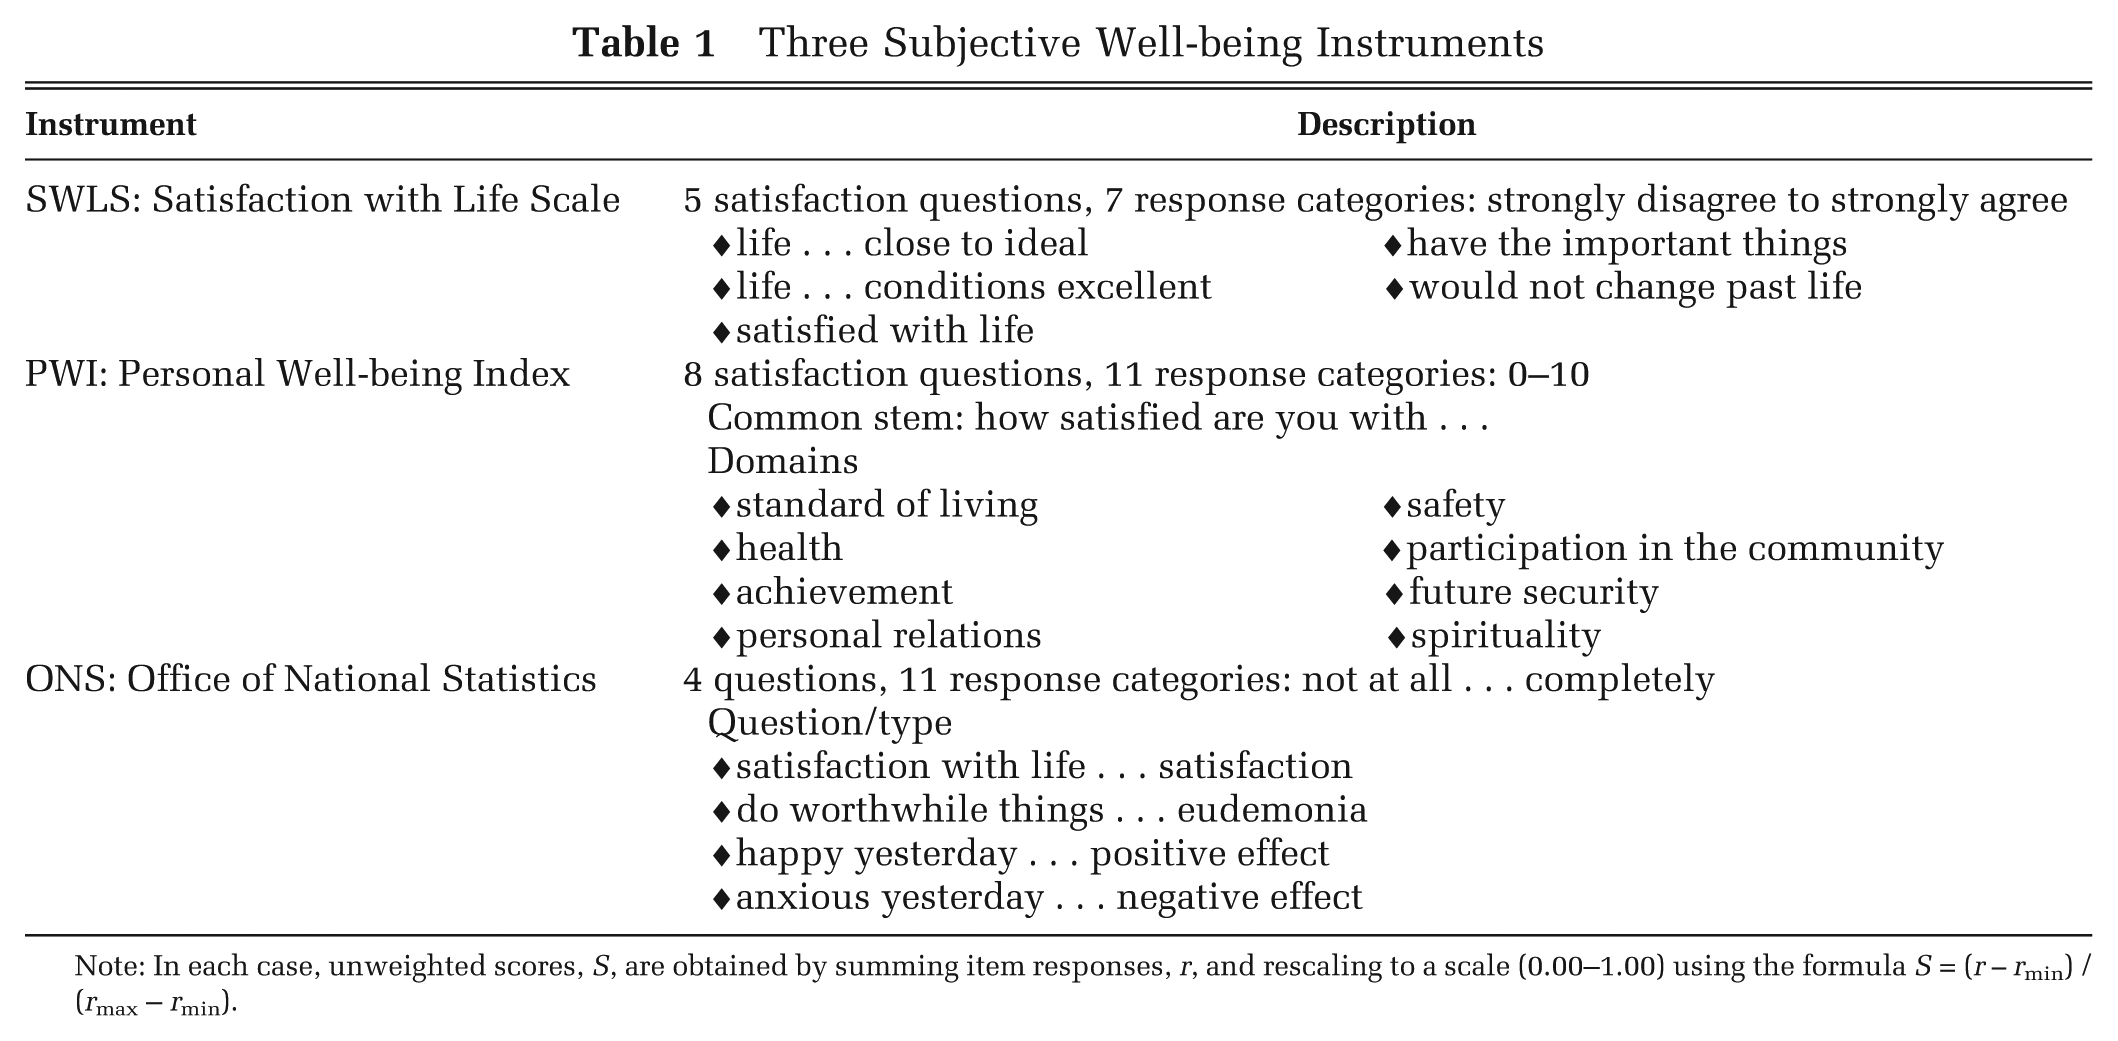
Note: In each case, unweighted scores, S, are obtained by summing item responses, r, and rescaling to a scale (0.00–1.00) using the formula S = (r – r min) / (r max – r min).
The 6 MAUIs are described in Table 2 and reviewed in Richardson et al. 34 They differ significantly in size and content. The smallest instrument—the EQ-5D—has 4 of its 5 items in the physical domain. In contrast, 5 of the 8 dimensions and 25 of the 35 items of the largest instrument, the AQoL-8D, relate to psychosocial health.
Comparison of the Dimensions and Content of Six Multiattribute Utility Instruments
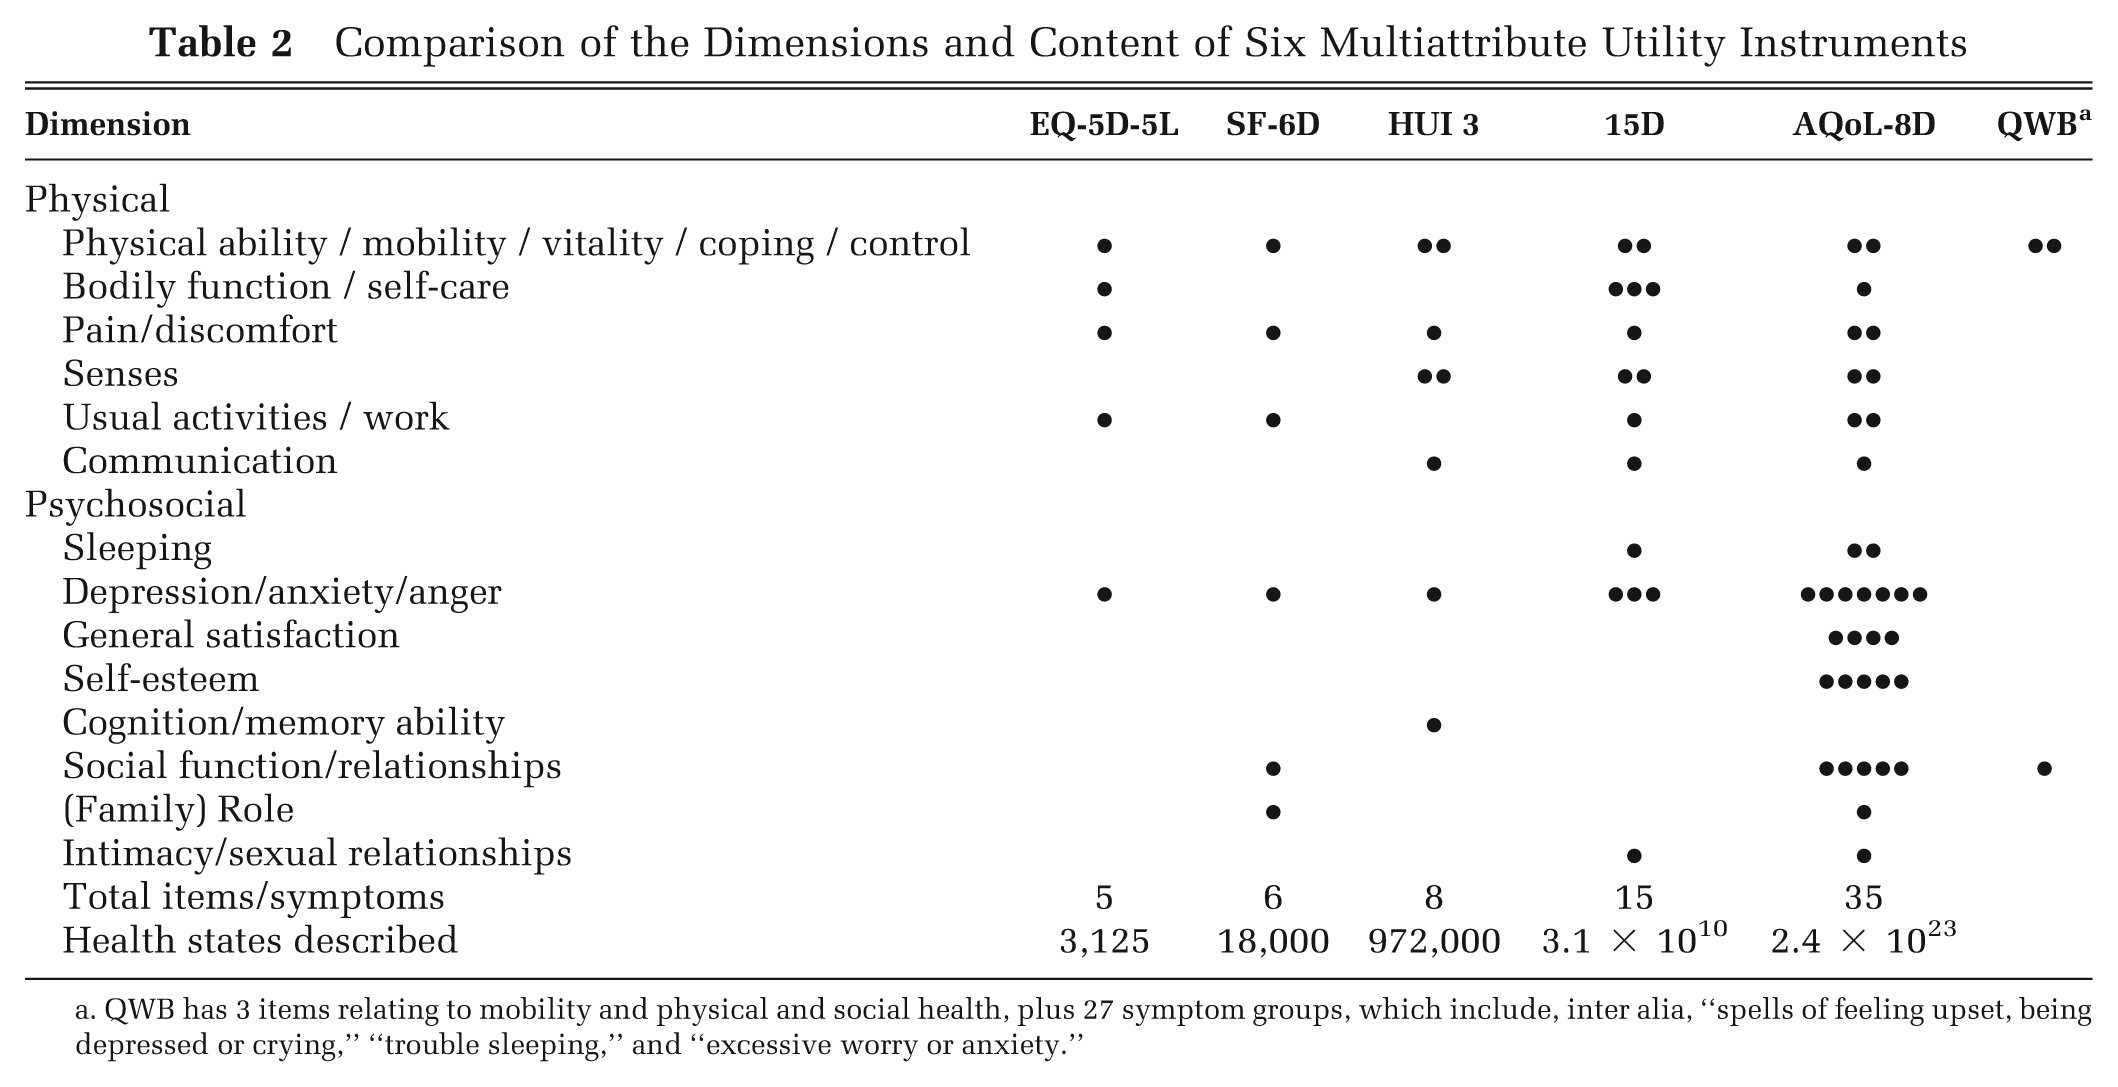
QWB has 3 items relating to mobility and physical and social health, plus 27 symptom groups, which include, inter alia, “spells of feeling upset, being depressed or crying,” “trouble sleeping,” and “excessive worry or anxiety.”
Data
The Multi-instrument Comparison survey was carried out in 6 countries: Australia, Canada, Germany, Norway, the United Kingdom, and the United States. It was administered online by a global panel company, CINT Pty Ltd. The survey was approved by the Monash University Human Research Ethics Committee, Monash University Melbourne Australia (reference No. CF11/3192-2011001748). Respondents were administered the 3 SWB instruments before subsequent questioning to preclude the contamination of answers by contemplation of other questions. Subsequently, respondents were asked to indicate if they had been diagnosed as currently having one of the chronic illnesses in the study and to rate their overall health on a numerical visual analog scale where 0.00 represented death and 100 “best possible health” (physical, mental, and social). Quotas were then used to obtain a demographically representative sample of the healthy public, defined by the absence of a chronic disease and an analog score above 70. Quotas were also applied to obtain a target number of respondents in each of the 7 disease areas in the study—namely, arthritis, asthmas, cancer, depression, diabetes, hearing loss, and heart disease. Respondents with a chronic disease were asked to complete a disease-specific questionnaire to determine the severity of the condition. For 5 of the MAUIs, utilities were calculated through algorithms provided by the instruments’ authors: SF-6D, 35 HUI 3, 36 15D, 37 QWB, 38 and AQoL-8D. 10 The 5-level EQ-5D-5L utilities were obtained from the crosswalks published by the EuroQoL Group. 39 Hereafter, the EQ-5D-5L is abbreviated to EQ-5D.
Results
Data were obtained from 9,665 individuals. Edit procedures, based primarily on responses to repeated questions, resulted in the removal of 17% of the total. Table 3 presents the age, sex, and educational status of the remaining 8,022 respondents. Because quotas were imposed, the proportion of respondents from each country is similar (Australia, 17.8%; United States, 18.2%; United Kingdom, 16.9%; Canada, 16.6%; Norway, 14.7%; and Germany, 15.8%). For the same reason, the age, sex, and educational profiles of respondents within each country are similar. The numbers recruited from the disease areas varied from 772 for cancer to 943 for heart disease. The 1,760 “public” respondents were obtained from country samples that closely matched the age and sex profile of each country. Except in Norway and Germany, where the QWB was not administered (reducing the response for the QWB to 5,576), each of the 8,022 respondents completed the 6 MAUIs along with sociodemographic questions. There were few missing data, as the online program did not permit respondents to proceed until questions were completed. (Only 14 individuals did not complete the final question.) Details of the sample administration and editing in each country are provided in country specific reports. 24
Respondent Characteristics
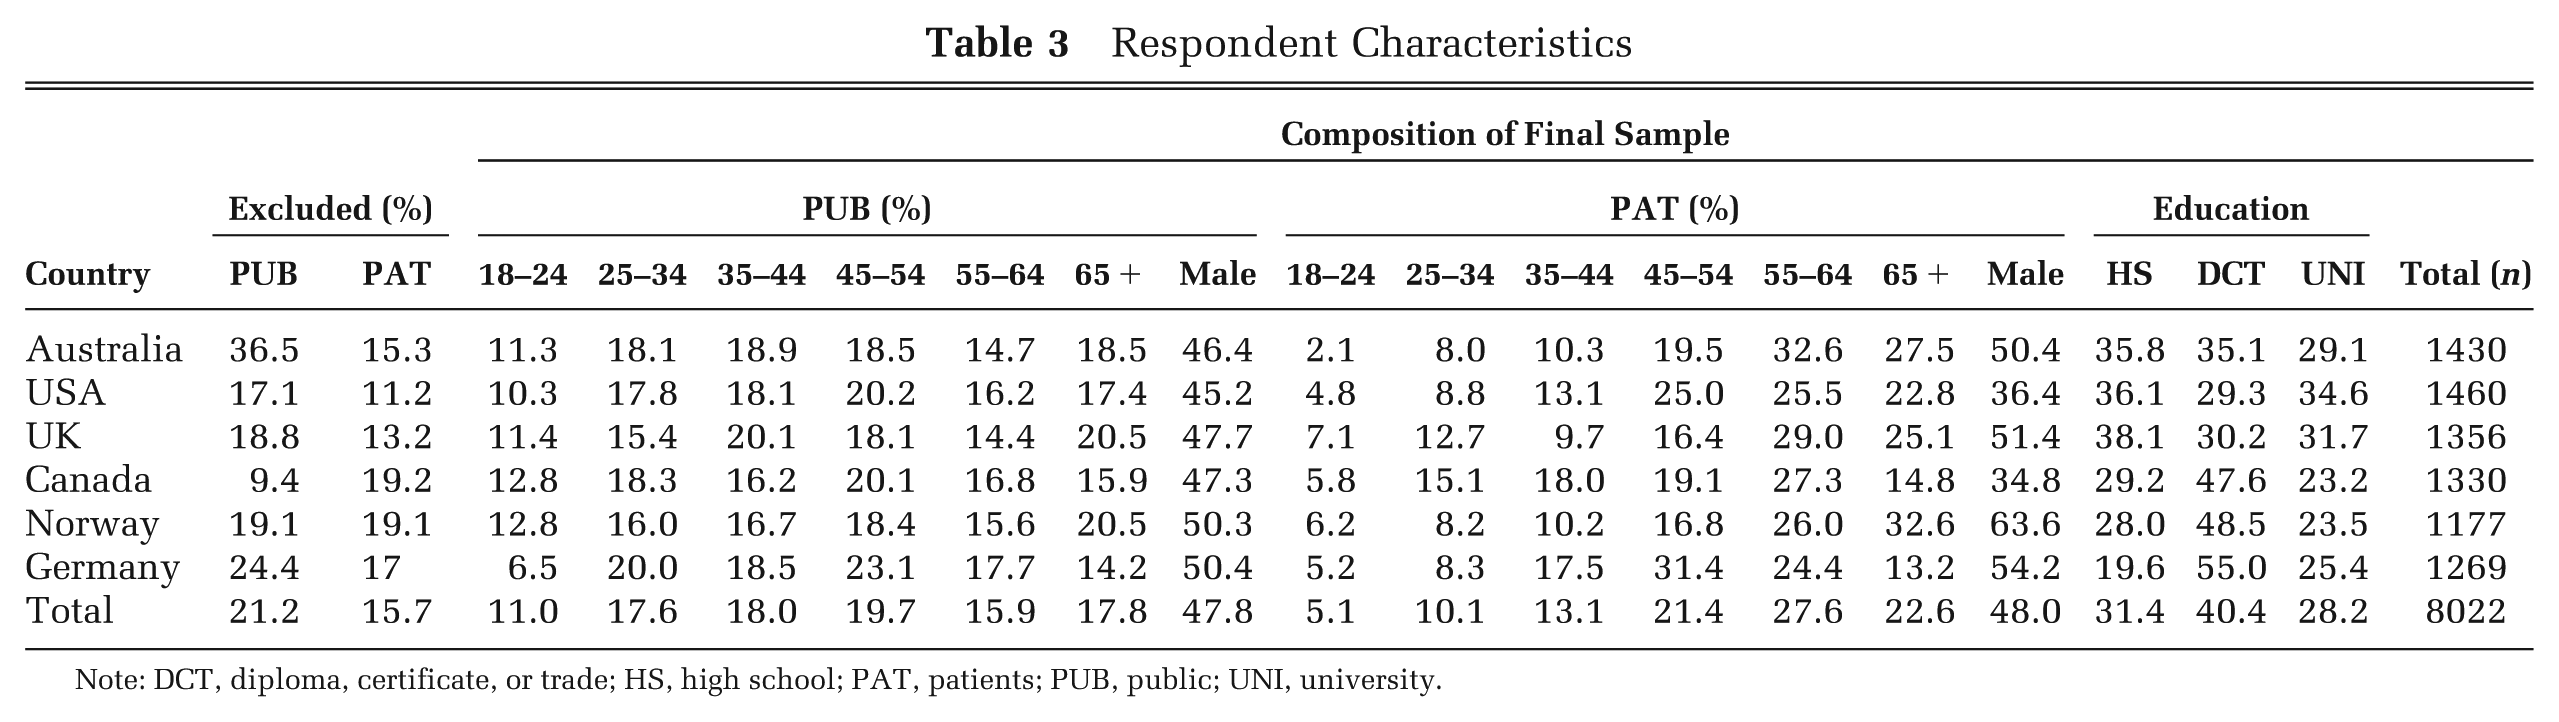
Note: DCT, diploma, certificate, or trade; HS, high school; PAT, patients; PUB, public; UNI, university.
Table 4 reports summary statistics for the 6 MAUIs and 3 SWB instruments. With the exception of the QWB and 15D, mean values for the MAUIs are similar, varying from 0.83 to 0.88 in the public sample and from 0.68 to 0.74 in the full sample. Other characteristics of the sample differ more significantly. In the full sample, the standard deviation of the observations varies by 100% from 0.27 for HUI 3 to 0.13 for 15D and 0.14 for SF-6D. Ceiling effects (U = 1.00) vary from 19.1% (EQ-5D) to 0.3% (AQoL-8D), and the percentage with a utility below 0.4 varies from 0.3% for the 15D and 1.3% for the SF-6D to 13.9% for HUI 3 and 14.7 percent for AQoL-8D.
Summary Statistics for the Nine Instruments
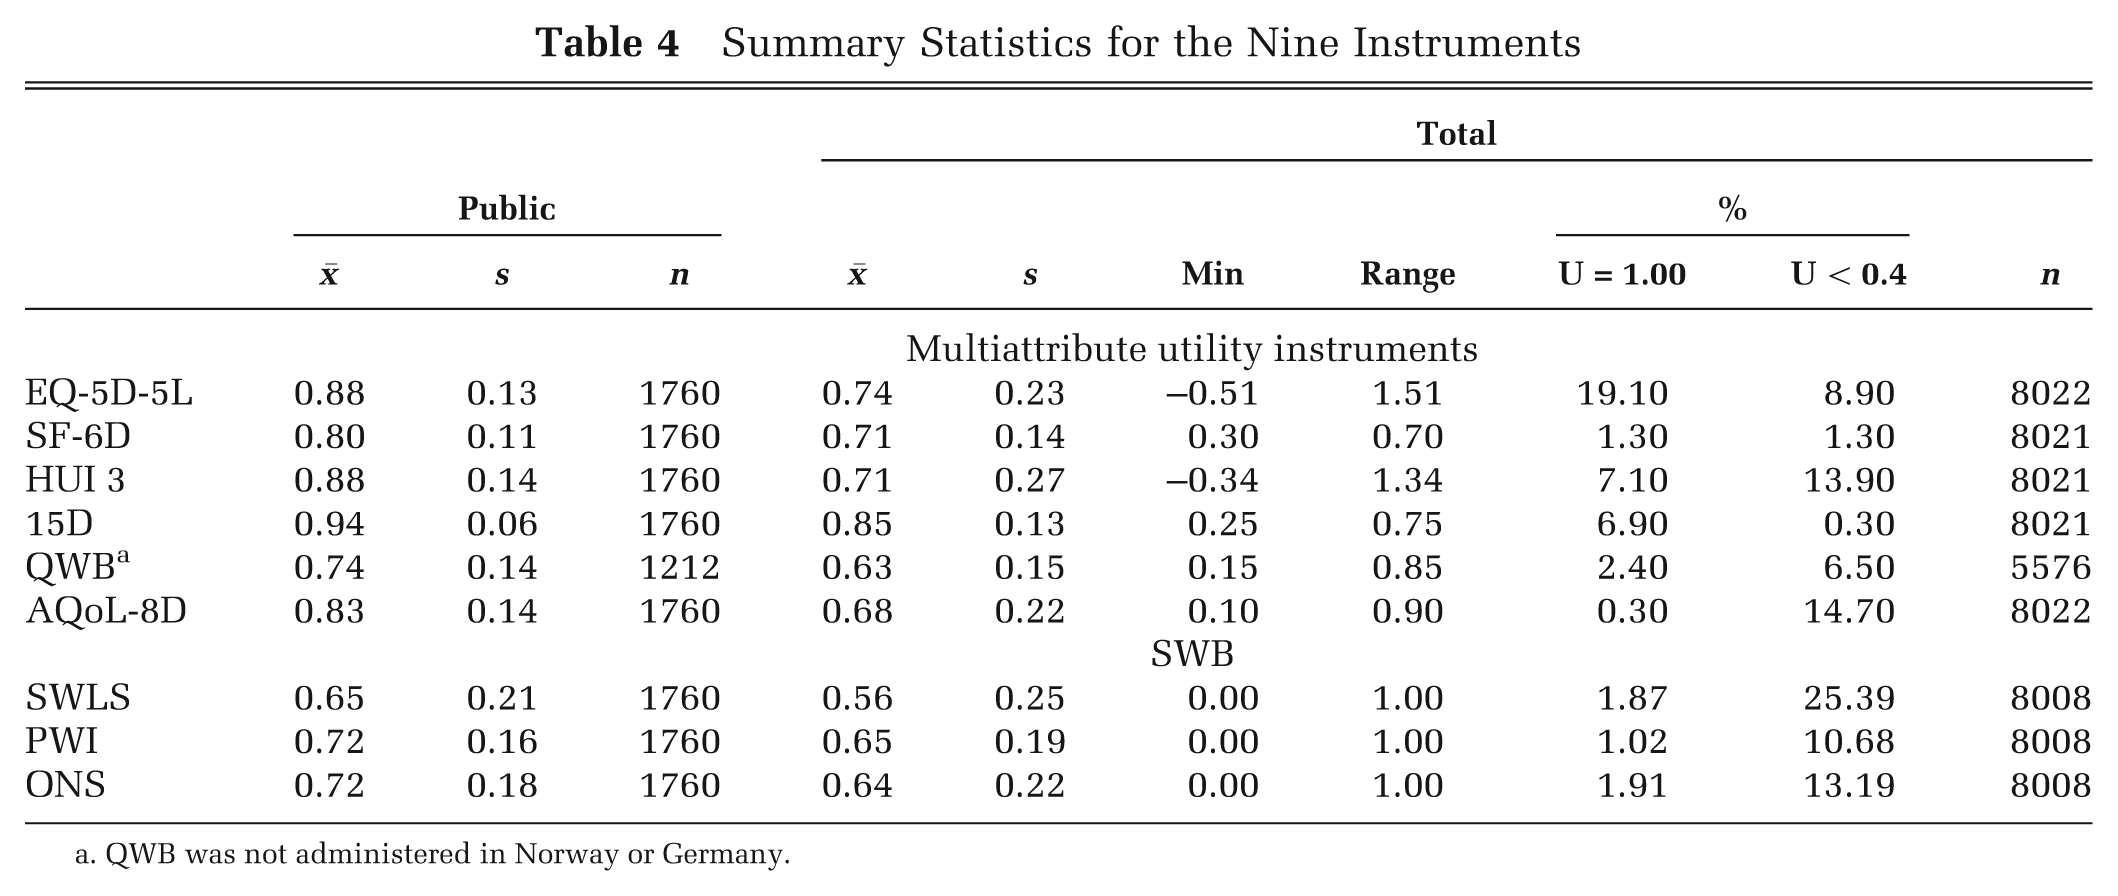
QWB was not administered in Norway or Germany.
Test 1
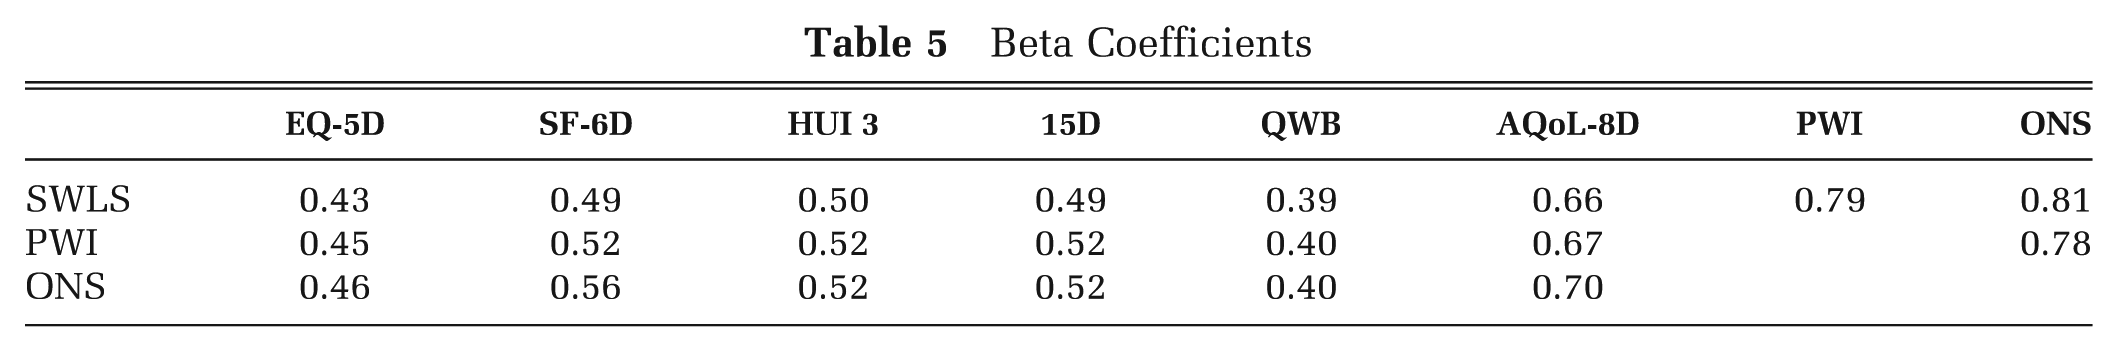
Results from the first test are reported in Table 5. Consistent with the differences in descriptive systems, there are significant differences in the magnitudes of the beta coefficients. For 3 MAUIs—SF-6D, HUI 3, and 15D—the betas are similar and vary from 0.49 to 0.56. Coefficients for the EQ-5D and QWB are, on average, 0.07 and 0.12 points lower and for the AQoL-8D, 0.16 higher, than the average for the 3. Table 5 also reports the beta coefficients for the linear relationship among the 3 measures of SWB. Consistent with the differences in their content, the relationship among them is imperfect with the strength of the association similar to the strength of the association between the MAUIs reported in the literature. 34 Supplementary Table 1 shows that the relationship between the 3 instruments is nonlinear, implying that the instruments have different interval properties.
Beta Coefficients
Test 2
Results from the second test are given in Table 6. Each column reports results from 3 regression equations, which have SWLS, ONS, and PWI as dependent variables, respectively. Full regression results are reported for the PWI. For the SWLS and ONS, only the coefficients on the utility and disease dummy variables are shown. Equations in column 2 omit utility from the list of independent variables. Subsequent columns introduce utility as measured by the MAUI shown at the top of the column.
‘b’ Coefficient from the Regression of SWB Instruments on Disease Dummy Variables and MAUIs: [Regression: SWB = a+Σ bi Xi where Xi = the independent variable]
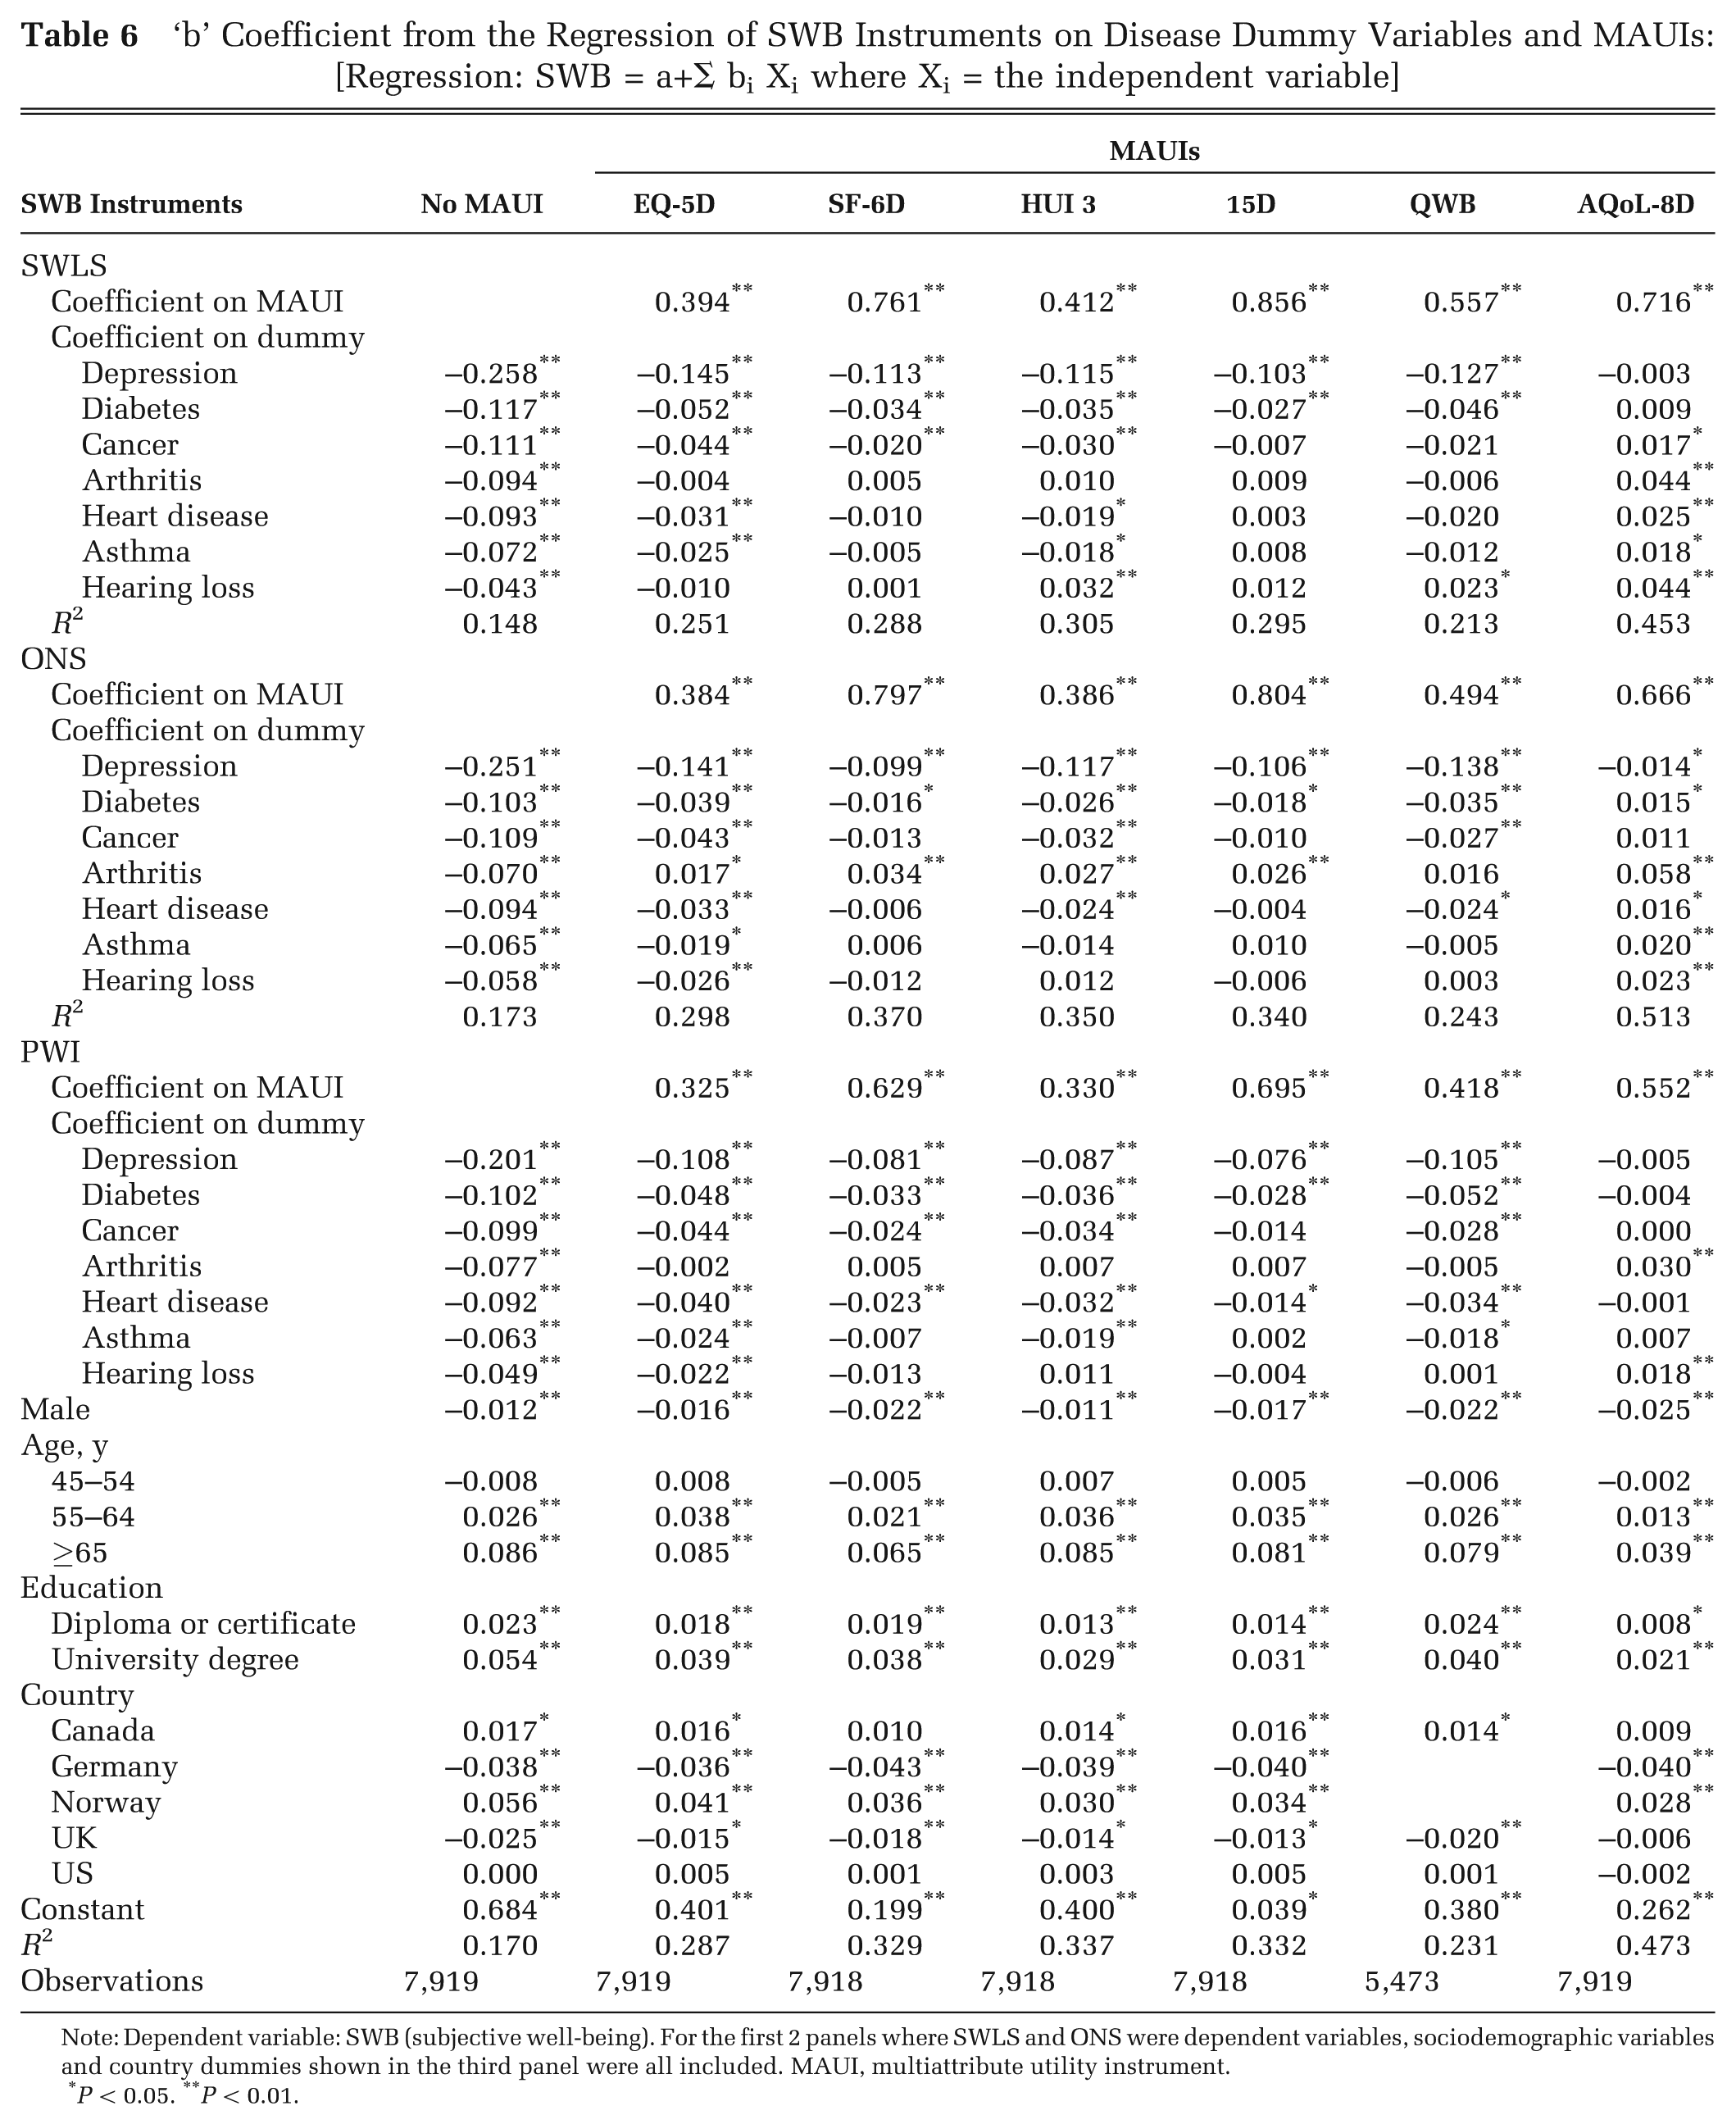
Note: Dependent variable: SWB (subjective well-being). For the first 2 panels where SWLS and ONS were dependent variables, sociodemographic variables and country dummies shown in the third panel were all included. MAUI, multiattribute utility instrument.
P < 0.05. ** P < 0.01.
The 3 measures of SWB give consistent results with respect to the effect of the 7 diseases. From the second column, depression has a significantly greater effect on SWB than any other disease. The reduction in the index of SWB is between 0.2 and 0.25, which is more than double the next-highest effect, which is associated with diabetes and cancer. The smallest effect is consistently for patients with hearing problems, followed by patients with asthma. The average loss of SWB associated with these diseases is about 20% and 25% of the loss associated with depression, respectively. The effects of the 7 diseases upon the PWI are shown in Figure 1.
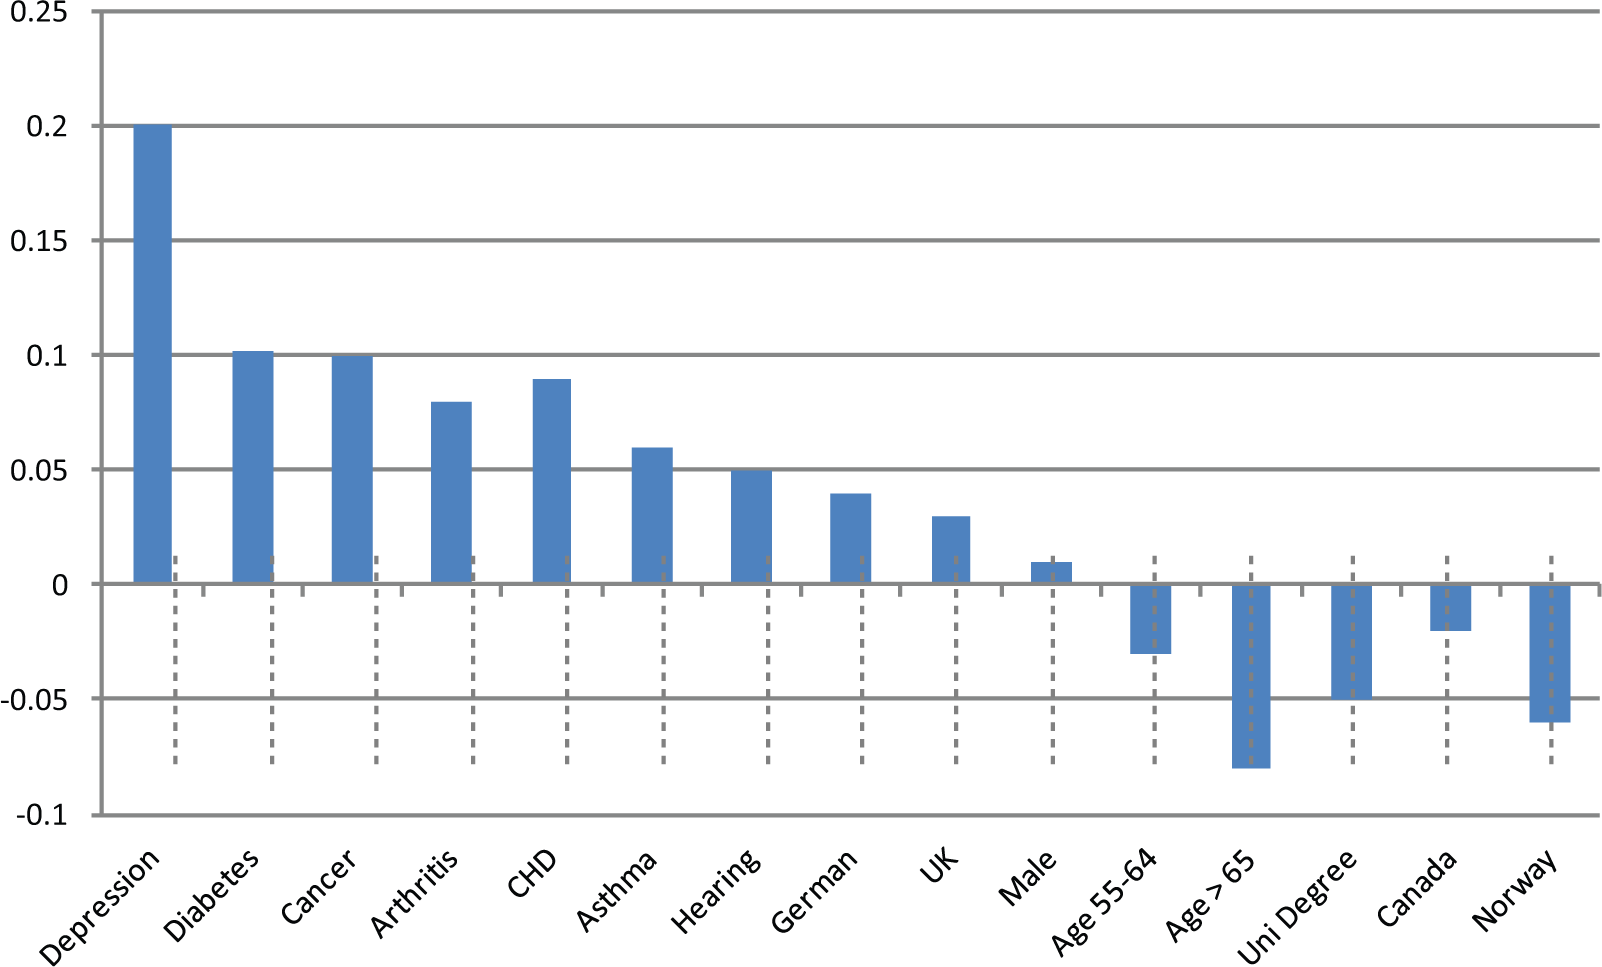
Reduction in Personal Wellbeing Index associated with independent variables. Negative reductions represent higher index scores. CHD, coronary heart disease; uni, university.
Inclusion of the different estimates of utility in the 3 equations has a broadly similar effect. The magnitude of the coefficient upon the dummy variables is reduced but, with several exceptions, remains negative. Exceptions occur with respect to hearing loss and arthritis where the coefficients generally become insignificant. The other exceptions are the equations that include AQoL-8D. These eliminate the negative coefficient on variables in every disease category and with every measure, with the single exception of depression, where there remains a marginally significant but small negative coefficient of 0.014 in the ONS equation.
A simple index of the extent to which the different MAUIs take account of SWB may be obtained by summing the number of results where the negative sign on a disease dummy variable is eliminated or becomes statistically insignificant. The result of this exercise, in order of success, is as follows: AQoL-8D (20 of 21), 15D (14 of 21), SF-6D (12 of 21), QWB (10 of 21), HUI 3 (7 of 21), EQ-5D (3 of 21). While the inclusion of utility did not fully account for SWB in the majority of cases, it did result in a diminution of the b coefficient, indicating a partial response to SWB. The magnitude of this effect for the PWI is shown in Figure 2.
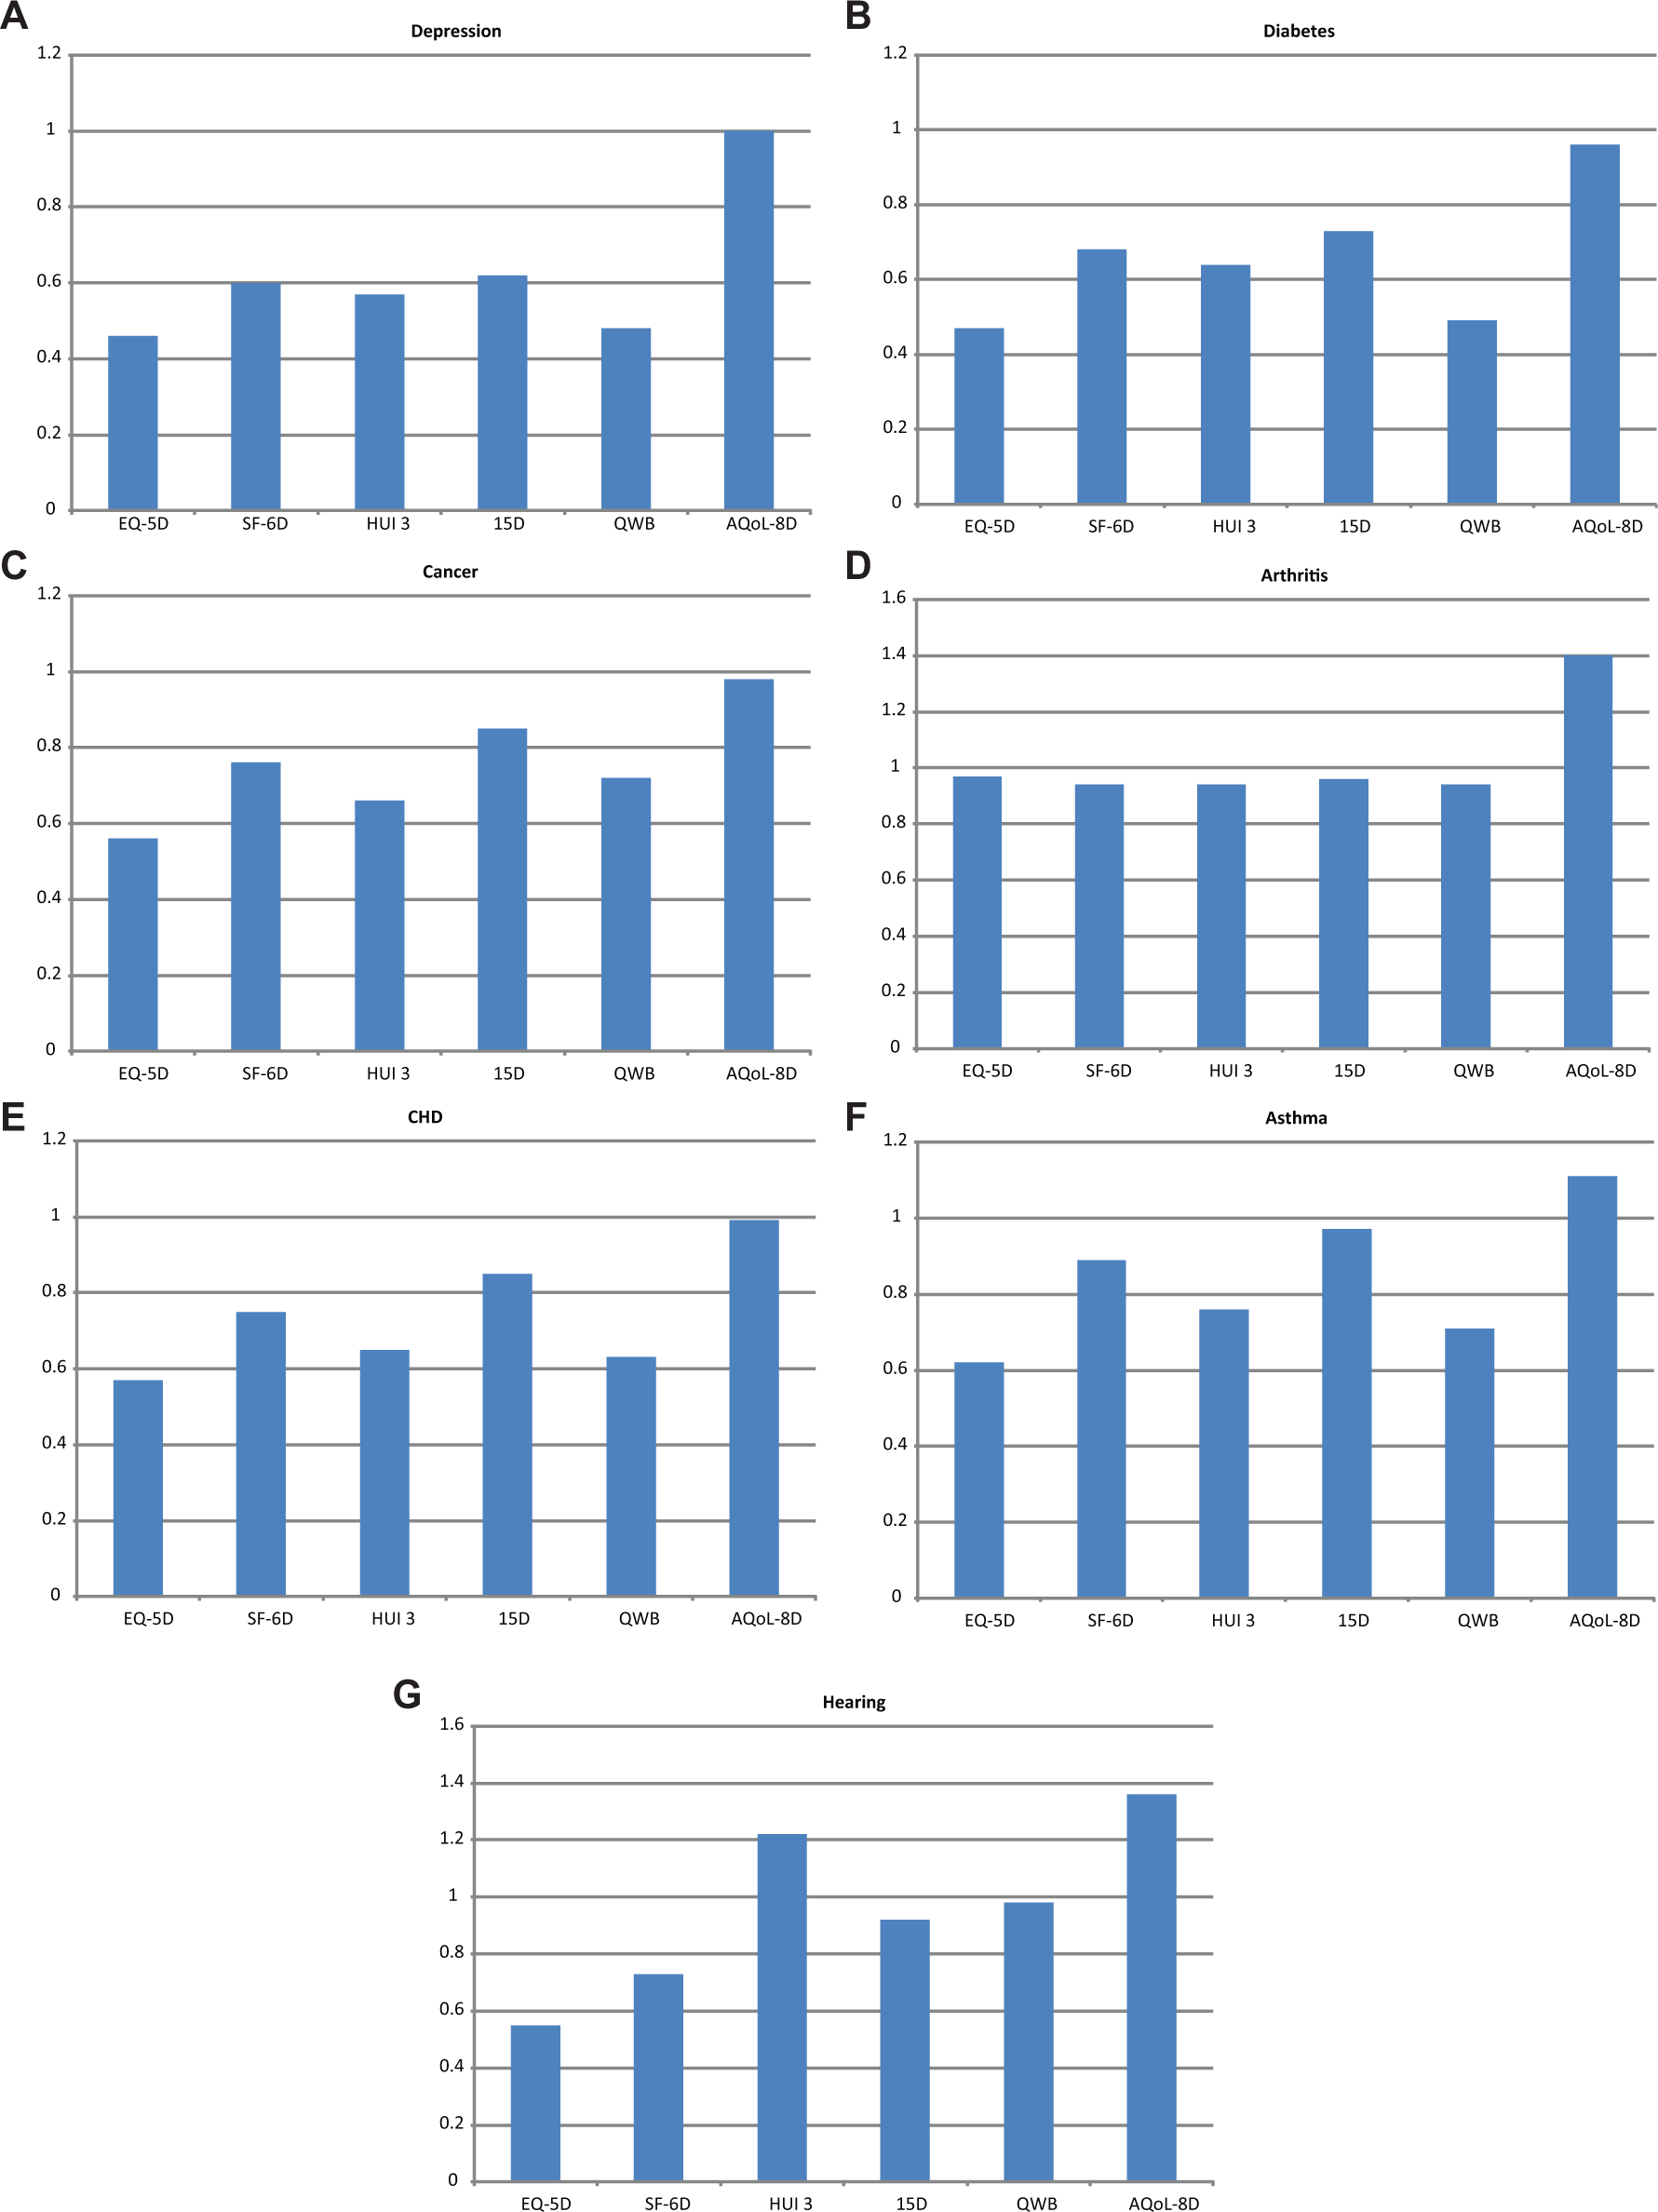
Proportion of the disease dummy coefficient reduced by inclusion of each MAU instrument in PWI equations.
According to the same criteria as above—the elimination of a significant negative coefficient—the diseases where the MAUIs were least able to account for the loss of SWB were depression and diabetes, where only the AQoL-8D fully accounted for SWB. These diseases were followed by cancer and heart diseases (8 coefficients eliminated in at least 1 regression by the SF-6D, 15D, QWB, and AQoL-8D), asthma (14; all instruments except EQ-5D), and hearing loss (15; all instruments except EQ-5D).
With the inclusion of utility, there are a number of cases in Table 6 where the coefficient on the dummy variable switches from negative to significantly positive. This implies that utility overpredicts the loss of SWB in the disease group and that the positive coefficient on the dummy variable is needed to offset this. Switching primarily occurs with the inclusion of AQoL-8D in SWLS and ONS regressions. However, switching also occurs for arthritis in ONS regressions with every MAUI, and it occurs for hearing loss in SWLS regressions when utility is measured by the HUI 3 or QWB. Overprediction is discussed further in the following section.
Discussion
The case for replacing or supplementing utility with SWB in the assessment of health services has drawn on the argument that decision utility and experienced utility—SWB—are largely incommensurable: that the perspectives and experiences of individuals prior to entering a health state do not permit them to properly take account of the SWB that they would experience in that state. In particular, it has been argued that they would fail to fully anticipate hedonic adaptation: their capacity to adjust to the new circumstances. The present article sought to test a contrary view—namely, that these problems are largely attributable to the failure of the health state description to provide information on attributes directly associated with SWB and, in particular, information relating to psychosocial health.
The article presented 2 tests that related to these alternative hypotheses. The first test was the correlation between the 2 sets of measures. Results confirm that the relationship between MAUI and SWB varies with the composition of the instrument’s descriptive system and specifically with the psychosocial content of the descriptive system. The SF-6D and HUI 3—which have 3 of 6 and 2 of 8 of their items in the psychosocial domain—result in larger beta coefficients than those of the EQ-5D, with only 1 of its 5 items in the psychosocial domain. The 15D has beta coefficients similar to those of the SF-6D and HUI 3, and 3 of the 15D items are dedicated to depression. Beta coefficients for AQoL-8D are significantly larger than they are for other instruments, and 7 of its items are dedicated to mental health and 4 to happiness, the items most closely related to SWB.
The results are consistent with the psychological literature. As noted earlier, in every case in which it has been studied, mental health has been found to be the most important determinant of SWB. 28 Independent analyses of the Multi-instrument Comparison survey data indicate that the AQoL-8D has the largest and the EQ-5D, the lowest, psychosocial content, as measured by the dimensions of the SF-36. 40
The second test was the extent to which the reduction in SWB associated with 7 chronic conditions could be explained by utility as measured by each MAUI. Results vary with the measure of SWB, reflecting the nonlinear relationship among the 3 instruments. Nevertheless, they are broadly consistent and suggest that utility may fully explain the reduction in SWB. There are, however, several important caveats. First, the result is a necessary but not sufficient condition for the conclusion. It is possible that utility only partially but systematically takes account of SWB and that the coefficient upon utility inflates the partial effect to fully account for SWB in the regression equations. Second, as discussed further below, the ability of utility to account for SWB does not negate the normative argument for the use of SWB as a measure of outcome.
Third, data for the study were obtained from an online survey. Despite the editing described earlier, respondents are not representative of the general community. However, there are no a priori reasons for believing that their self-selection would systematically change the relationship between utility and SWB. The inclusion of patients from 7 disease areas resulted in a wide cross section of health states, and the diversity of respondent experience was more important for this study than population representativeness.
The most important caveat relates to the ability of instruments to account for adaptation. Prima facie, it may appear implausible that an instrument with a fixed utility formula could account for variation in a person’s preferences because of adaptation. However, in principle, this may be achieved if the descriptive system includes dimensions that reflect the effect of adaptation. As noted above, SWB is primarily associated with mental health, and the inclusion of appropriate psychosocial dimensions has the potential to accommodate the effects of hedonic adaptation; that is, pre- and postadaptive health states may be measured with the same instrument, as adaptation will alter the responses to the psychosocial items. Whether or not this is achieved is therefore an empirical question.
Contrary to the concern in the literature, the empirical evidence indicates that for the most widely used utility instruments, the problem is not the inability of the instrument to take account of improved SWB when hedonic adaptation occurs. Rather, it is the inability of these instruments to fully explain the reduction in SWB associated with chronic illness. That is, irrespective of hedonic adaptation, the instruments generally take too little, rather than too much, account of SWB. As noted, exceptions to this generalization occur in the case of hearing loss and arthritis and when the AQoL-8D is included in equations. A likely explanation for the results for hearing loss and arthritis is that the elements affecting SWB are adequately represented in the descriptive systems of the MAUI. Arthritis is dominated by pain and physical function, and each instrument includes items describing these. The only MAUI that does not fully account for hearing loss is the EQ-5D, which contains no item directly associated with hearing loss.
Interpretation of the results is complicated by the overprediction of the loss of SWB associated with arthritis in all the equations using the ONS and also when utility is measured by the AQoL-8D. The present evidence does not permit a fully satisfactory explanation of these anomalies. It is possible that during the interview used to obtain utility weights, the importance of pain and hearing loss were exaggerated by respondents. Consequently, utilities would be depressed. If so, the overprediction of the loss of SWB would depend on the strength of the correlation between utility and SWB. In the case of arthritis, this is consistent with the results in Table 6 when SWB is measured by the ONS. The rank order of the overprediction closely follows the rank order of the correlation between the ONS and utilities in Table 5. A similarly exaggerated response might explain the overprediction of the effect of hearing loss by HUI 3 for the SWLS and AQoL-8D for each of the three measures of SWB.
This tentative explanation supports the argument that—at least in these cases—utilities obtained from the public do not fully reflect the experience of patients. This may be attributable to a degree of adaptation in these disease areas or to the failure of imagination by respondents to a utility scaling survey. While responses to psychosocial variables may accurately reflect the postadaptive health state and are weighted appropriately, the pain (arthritis) and hearing variables may retain their preadaptive utility weights, which exaggerates their importance. If subsequent research confirmed this explanation, one solution would be to adjust the weights to reflect the importance of the variables after adaptation. This is illustrated in Supplementary Note 1. Importantly, however, overprediction occurs for a minority of results, and with the exception of the AQoL-8D result for arthritis, the effects are relatively small.
In a rare analysis of how well utility captures the negative effects of chronic disease on SWB. Böckerman et al. 29 concluded that the utility instruments that they employed—the EQ-5D and 15D—fail to capture the effects of some chronic conditions upon SWB and, in particular, that using utility as the basis for resource allocation is likely to result in the underfunding of psychiatric problems where utility appeared least able to account for variation in SWB. The present results suggest that this conclusion was a reflection of the choice of utility instruments and not a necessary result arising from the concept of utility. The ability of utility instruments to account for SWB varies with the quality of the description of mental health. With the larger description contained in the AQoL-8D, utility fully accounted for variation in SWB.
The importance of the composition of an instrument’s descriptive system also varied with the disease. The primary effect of arthritis is on pain and physical activity, which are well described by the EQ-5D. In the corresponding equations, arthritis is the single disease where the EQ-5D accounts for variation in SWB. Similarly, 2 of the 8 HUI 3 items are dedicated to senses, and HUI 3 fully accounts for variation in SWB associated with hearing.
As noted earlier, the ability to account for SWB does not imply that utility is the appropriate criterion for evaluating health programs. Beta coefficients in Table 5 are less than 1.00, implying that a change in utility is associated with a smaller shift in SWB (relative to the standard deviation of each measure). This suggests that while people take account of SWB, it is not the only influence on utility. A normative argument might be made for disregarding these other influences, especially if it could be demonstrated that these influences reflected poor judgment. However, there is no agreement in the literature that SWB is the appropriate social objective. There is also a normative argument for the use of utility to preserve autonomy and, as elsewhere, to require people to bear the consequences of their own decisions. The questions of what society values, what should be included in economic evaluation studies, and how these questions should be resolved are not answered by the present empirical results, which help to inform but not resolve these normative issues.
Notwithstanding the normative arguments, results here indicate that the transition to SWB as a unit of outcome might be premature. The 3 measures of SWB employed in this study differ in content, and their association is imperfect. The nonlinear relationship reported among them (in supplementary material) implies a varying interval property for the units of the 3 measures. This is indicative of the unsettled question in the literature about what constitutes “SWB,” which parallels the question in the economics literature concerning the appropriate content and properties of MAUIs.
Conclusions
There have been relatively few empirical studies of the relationship between utility and SWB. The multi-instrument survey data employed here provide a unique opportunity for their comparison. They confirm the low correlation between the 2 concepts as measured by any of the instruments in the survey. However, the results do not suggest that utility and SWB are incommensurable concepts. Variation in SWB among health states may be largely explained by utility. While the results here apply specifically to utilities measured by MAUIs, a single example of an instrument’s capacity to account for SWB suggests that the result is more general. Consistent with the literature, the strength of the association and the capacity of MAUIs to account for variation in SWB varies significantly with the detail relating to mental health that is in the instrument’s descriptive system. With its uniquely limited coverage of mental health, the EQ-5D is least able to account for variation in SWB, and its widespread use implies the systematic disadvantaging of therapies that primarily increase SWB and, in particular, psychiatric services.
While there has been concern in the literature with respect to the inability of utility to take account of adaptation, results here suggest that this concern has largely arisen from the use of MAUIs that do not contain items that can reflect adaptation. While this remains an area where further research is needed, supplementary material suggests one approach that has the potential to accommodate adaptation when this is known to occur.
Finally, while similar conclusions were reached with each of the three measures of SWB used in the study, results varied with the choice of SWB instrument. The nonlinear relationship among them indicates that—as with the measurement of utility—there is no simple and unambiguous measure of SWB, and further research in this area is needed to establish its role in economic evaluation.
Footnotes
Acknowledgements
We thank Professor Erik Nord and Professor Paul Menzel for detailed and helpful comments on the manuscript. This work was supported by the National Health and Medical Research Council (grant 1069241).
This research was funded by a project grant from the National Health and Medical Research Council (ID 1069241). The funding body had no involvement in the study design, data collection, analysis, and interpretation of the data or in the decision to submit this article for publication.
The authors report no financial conflict of interest. They include the authors of the AQoL-8D instrument used in the study. The authors have no competing interests to disclose.
References
Supplementary Material
Please find the following supplemental material available below.
For Open Access articles published under a Creative Commons License, all supplemental material carries the same license as the article it is associated with.
For non-Open Access articles published, all supplemental material carries a non-exclusive license, and permission requests for re-use of supplemental material or any part of supplemental material shall be sent directly to the copyright owner as specified in the copyright notice associated with the article.