
Abstract
The economic evaluation of health services that alter the quality of life (QoL) commonly employ cost utility analyses (CUA) to rank alternative services according to the cost of obtaining an additional quality-adjusted life-year (QALY) from the use of the service. QALYs are defined as life-years times an index of the QoL, measured as utility (i.e., the strength of preference for a health state). This has been assessed, increasingly, using one of a small number of multiattribute utility instruments (MAUI),1,2 and the validity of the economic evaluations that use these instruments is therefore dependent on the sensitivity and validity of the instruments. The validity of the comparison of services therefore depends on the validity of the comparisons made using these MAUI.
A review of the literature between 2000 and 2010 identified 1663 studies that had employed 1 of the major MAUI. 3 These contained 392 head-to-head comparisons of the utilities obtained from the instruments. These all found a significant correlation between MAUI scores and, in some cases, demonstrated the existence of common latent dimensions. 4 However, most studies also identified significant differences between estimated utilities, with the largest US-based comparison reporting an average correlation between 4 MAUI of 0.71. 5 Most authors in the reviewed studies concluded that instruments “are not equivalent,” 6 that they are imprecisely related, 5 and that their comparison warrants caution. 7 Similarly, a more recent comparison using 5 MAUI in a prospective and follow-up study of cataract and heart failure patients concluded that there is a “lack of interchangeability among different preference-based measures.” 8
Between 2010 and 2015, the Web of Science and Ovid Medline identified 56 articles as having included 3 or 4 MAUI. With few exceptions, these focused on individual illnesses or health states: arthritis,9–11 diabetes, 12 multiple sclerosis,13,14 cancer, 15 disc displacement, 16 vision,17,18 chronic obstructive pulmonary disease, 8 hearing, 19 and urinary incontinence. 20 The majority of these studies note the differences obtained by the use of different instruments and, generally, their capacity to discriminate between the public and differing classes of patient. Several studies explicitly consider instrument validity in the context of the single disease. 14 Using item response theory, one study derived test-retest standard deviations and structural deviations for 4 MAUI. 21 Results were derived from the general public, and the validity of extrapolation to particular patient groups is not reported.
In sum, the empirical literature has demonstrated differences obtained by MAUI but generally refrained from recommending one instrument in preference to another. Notwithstanding the difficulty of comparing multidimensional instruments, it is an important question. As recognized in the literature, the difference between MAUI has important consequences for CUA. 22 An economic evaluation is more likely to find a service to be cost effective if it employs a MAUI that predicts a larger improvement in utility than alternative MAUIs, and the funding of a service by a health authority may depend on the instrument used in its evaluation. This highlights the need for more evidence on the comparative strengths and weaknesses of different MAUI.
The present article is a response to this need. It examines 2 of the key properties of a MAUI. The first is its sensitivity, the extent to which predicted utilities differ with a change in a person’s QoL. The second is the instrument’s validity: evidence that the instrument measures the theoretical construct that it purports to measure, which, for a MAUI, is the strength of people’s preferences for different health states.
In practice, demonstrating validity is problematic, as an instrument will, typically, be neither (completely) valid nor (completely) invalid. As argued by Streiner and Norman, 23 “validation” is “a process of hypothesis testing . . . to determine the degree of confidence we can place on inferences we make . . . based on scores” (p 174). Confidence increases when the scores correlate as expected with scores from other instruments. However, in the absence of a gold standard, the choice of comparator instruments is contestable. Consequently, the process of validation—in Cronbach and Meehl’s terminology, the creation of a “nomological” network of supporting evidence and theory—evolves with the addition of new test results. 24 The present article contributes to this process by reporting the results of 6 tests of validity for 6 MAUI in 7 disease areas. Three tests of sensitivity are additionally reported. Final comparisons are therefore based on 9 tests.
Tests of validity have been variously classified. 23 The present study is concerned with the generic category of “construct validity” and, more specifically, 1) convergent validity, the strength of the association with variables that seek to measure a similar or the same construct (i.e., the strength of preferences), and 2) content validity, the extent to which an instrument describes or represents the full range of attributes needed to draw correct inferences with respect to the construct. It is demonstrated by the correlation of MAUI scores with measures of the physical and mental QoL.
The sensitivity of an instrument reflects the correspondence between the attributes of a health state and the domains included in the instrument. Its measurement is affected by the instrument’s reliability and whether items are appropriately worded to identify changes in attributes. However, the change in utility predicted by a MAUI also depends on the effective measurement scale that was employed when utilities were assigned to the instrument’s health state descriptions. Despite each MAUI seeking to anchor its scale at 0.00 = death and 1.00 = best health, the effective measurement scales differ significantly between instruments. 25 Consequently, an increment of utility may have a different meaning when it has been derived from a different MAUI. This may mask the sensitivity attributable to instrument content and reliability and make evaluation of sensitivity problematic.
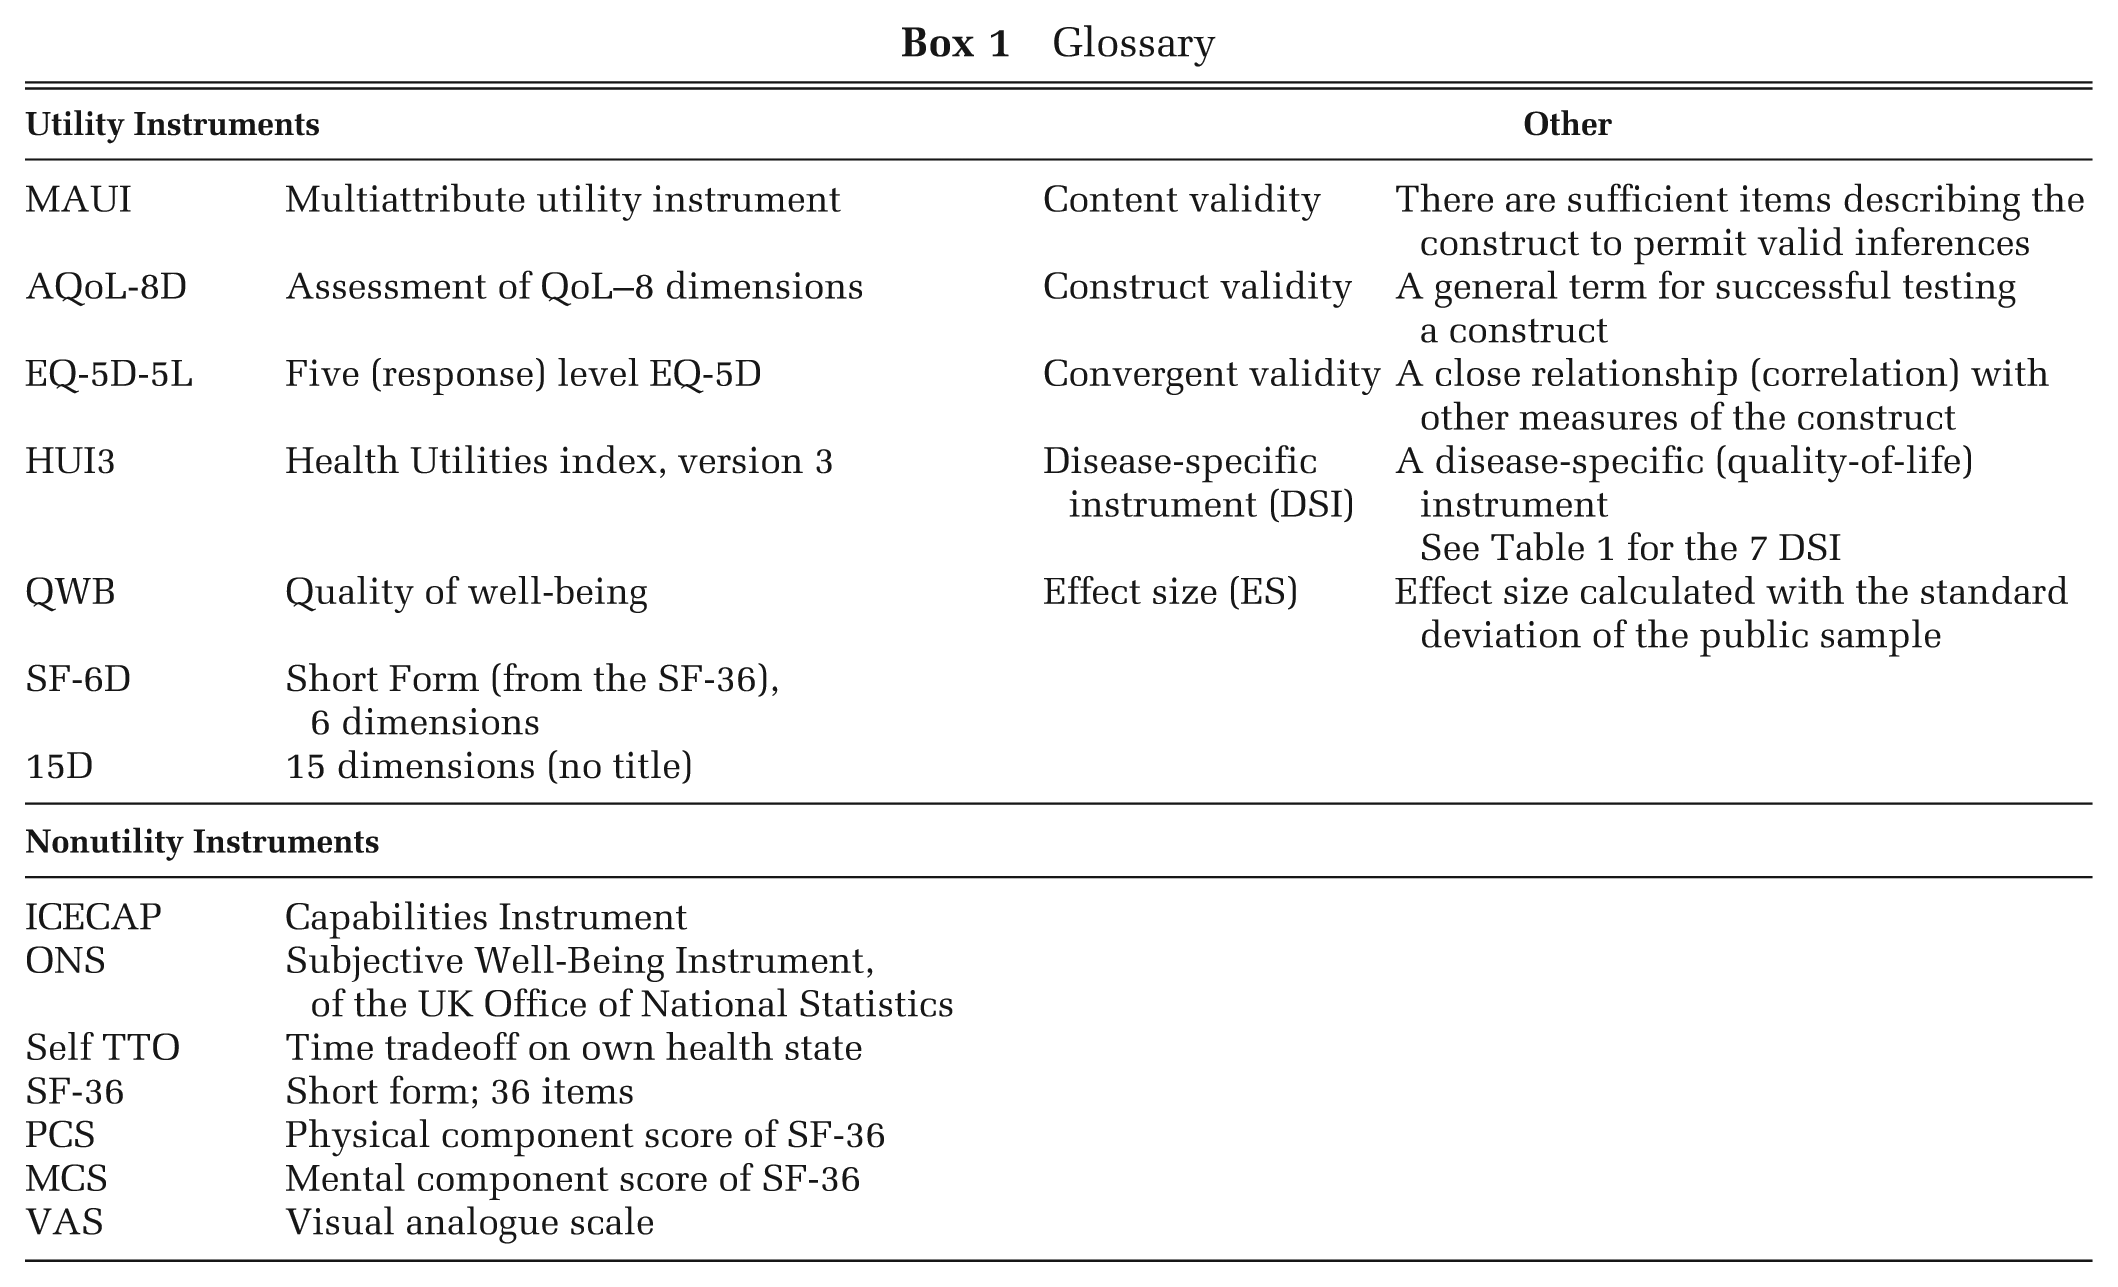
The present article has 2 specific objectives. The first is to compare 3 methods for measuring sensitivity and to compare results from 6 tests of construct validity. The second objective is to rank instruments by the results of each test. However, as a choice of instrument requires a single, not multiple, ranking, results are also combined into a single indicative index of sensitivity and validity, which is used to rank the MAUI in each of the 7 disease areas analyzed. The study is based on a large multi-instrument comparison (MIC) survey, which is described in the second section below along with the methods used for measuring sensitivity and testing construct validity. The third section presents the results, which are discussed in the fourth section. Abbreviations used throughout the paper are defined in Box 1.
Glossary
Data and Methods
The MIC Survey
An online survey was conducted in 6 countries: Australia, Canada, Germany, Norway, the United Kingdom, and the United States. Respondents were initially asked to indicate if they had a chronic disease and to rate their overall health on a visual analogue scale (VAS), where 0.0 represented death and 100 represented “best possible health (physical, mental, social).” The “healthy” public was defined by the absence of chronic disease and by a score greater than 70 on the VAS. Quotas were used to achieve demographically representative samples of the public in each country; that is, public respondents were recruited until the predetermined target for each demographic cell was reached. Quotas were also applied to obtain a target number of respondents in each of 7 chronic disease areas, namely, arthritis, asthma, cancer, depression, diabetes, hearing loss, and heart disease.
Instruments used in the study are listed in Table 1, which also reports the balance between physical and psychosocial items in the 6 MAUI. Utilities for 5 of the MAUI were assigned using algorithms provided by the instruments’ authors: the 5-level EQ-5D-5L utilities were obtained from the crosswalks published by the EuroQoL Group. Both the MAUI and comparator instruments, described below, were administered in random order. The full dataset is freely available on the AQoL website. 47
Instruments by Role in the Analysis
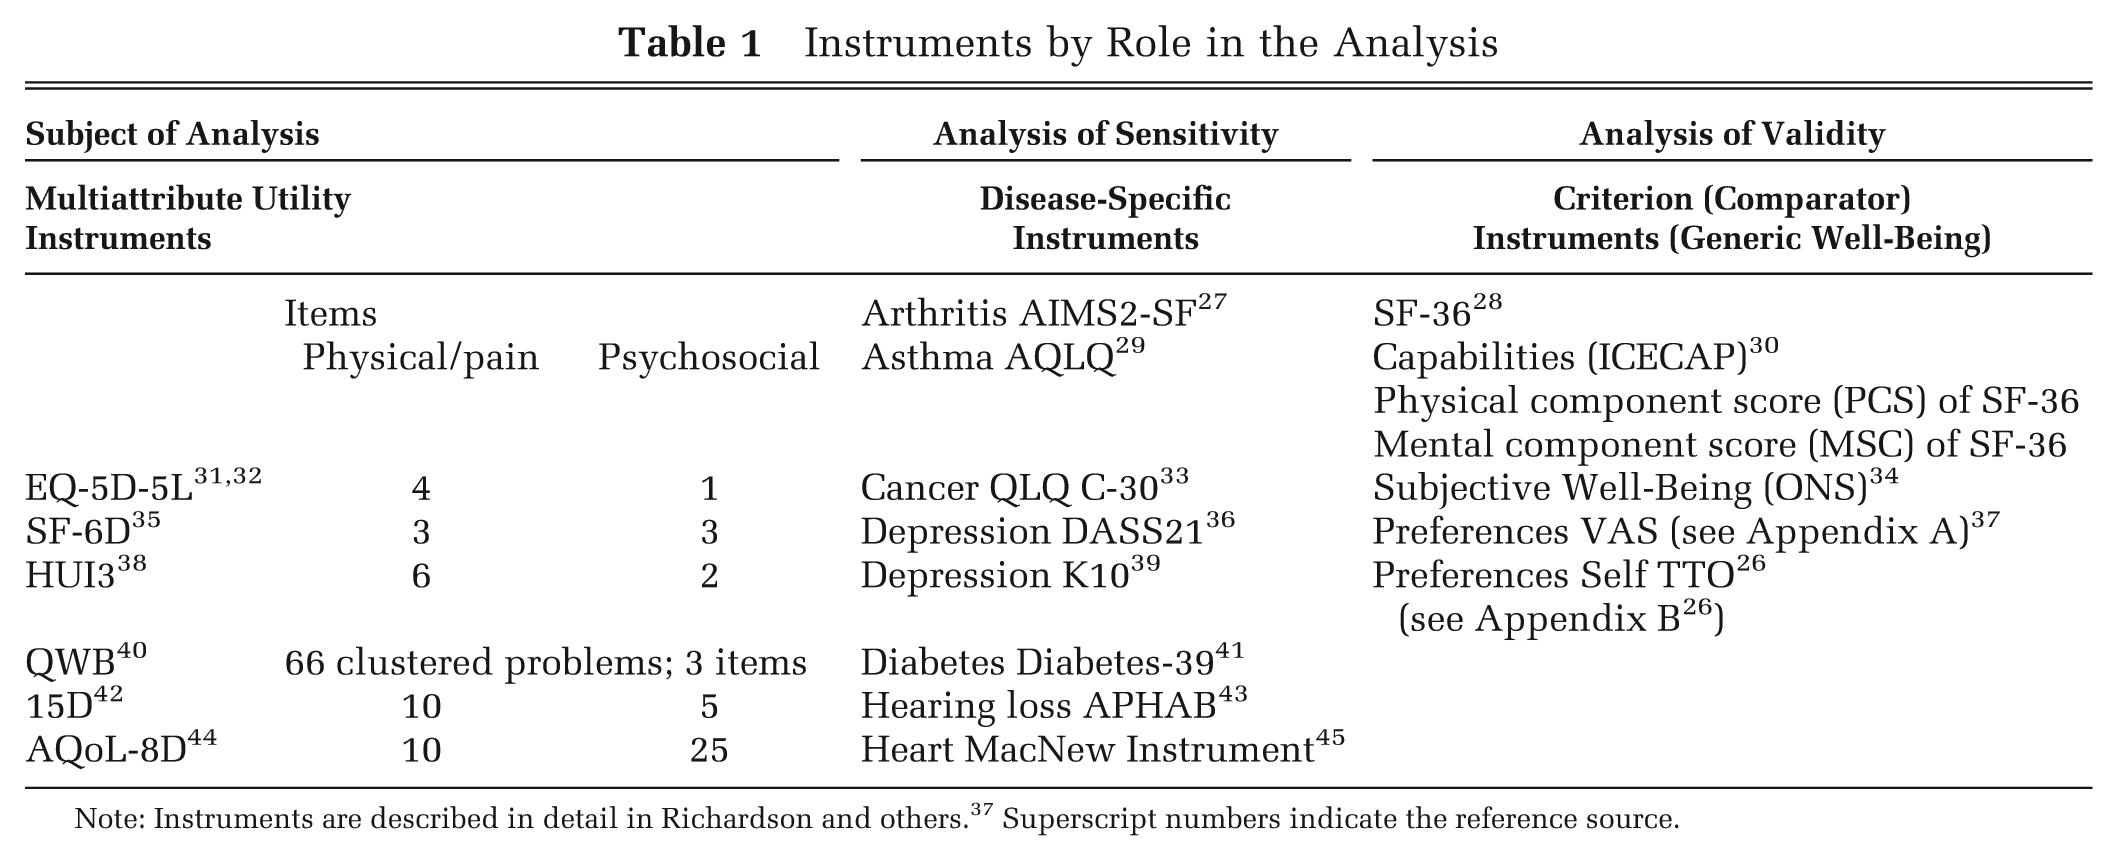
Note: Instruments are described in detail in Richardson and others. 37 Superscript numbers indicate the reference source.
Comparator Instruments
Disease-specific instruments (DSI) listed in Table 1 were selected from the literature upon advice from leading researchers in each area. Their correlation with the MAUI is presented in bar charts in Appendix A. Two preferences measures—the VAS and Self Time Tradeoff (TTO)—are described in Appendices B and C. The latter experimental instrument asked respondents to tradeoff time in their present health state against length of life. 26 Physical health–related QoL was measured with the SF-36 physical component score (PCS) and psychosocial health by both the SF-36 mental component score (MCS) and with a new subjective well-being (SWB) instrument developed by the UK Office of National Statistics (ONS). It was preferred to other measures of SWB in the MIC survey as it achieved a higher correlation with all other instruments. The Capabilities Instrument (ICECAP) instrument focuses on a specific subset of capabilities, namely, the ability to function as an independent and emotionally fulfilled individual, a concept close to the notion of eudemonia. Irrespective of its nomenclature, in the recent literature it has been nominated as an important measure of well-being, which supports its use as a test of the content validity of the MAUI.
Eight edit criteria were employed. Six of these were based on 6 questions, which were repeated at some stage of the survey. Results were not used when responses to these questions differed by 2 or more response categories or when 2 or more of the answers differed by more than 1 response category. Surveys were removed that were completed in less than 20 min, which was deemed to be the minimum time for the provision of more than 300 items of information. The edit procedures, the questionnaire, and its administration are described in Richardson and others. 46 The online survey was administered by a global panel company, CINT Pty Ltd. The survey was approved by Monash University Human Research Ethics Committee, Monash University, Melbourne, Australia, reference number CF11/3192-2011001748.
Methods
In each of the 7 disease areas, 3 measures of sensitivity were estimated and compared. These were 1) unadjusted differences between public and patient mean utilities, 2) the Cohen effect size (the mean differences divided by the standard deviation of the public sample), and 3) the Pearson correlation between MAUI utilities and scores from the relevant DSI. The latter 2 measures are independent of scale effects and were combined into a single index of sensitivity.
Convergent and content validity were tested and compared using the correlation between each of the MAUI and the comparator (criterion) variables. Based on the correlation between them, the criterion variables were collapsed into 3 broad categories: 1) preference, 2) physical, and 3) psychosocial variables. The utility that MAUI seek to measure refers to the strength of a person’s preferences, so convergent validity was tested by the correlation between MAUI and an index of the 2 preference measures. Content validity was tested by the correlation between MAUI and indices of physical and psychosocial variables.
In each case in which an index was constructed, there was no overarching criterion for weighting the importance of each test. Results are also measured on different scales. To combine test results, each result used in an index was therefore converted to a percentage of the highest test result for that test in a disease group, and indices were constructed as the unweighted average of the converted test scores. The procedure gives equal importance to each test in the index and equal importance to the same relative differences that occur on each of the component scales.
There is also no overarching criterion for combining the indices of sensitivity and validity, but the ranking of instruments requires their implicit or explicit combination. Indicative summary scores were therefore calculated using the methodology described above; that is, the indices of sensitivity and validity for each instrument were converted to a percentage of the highest index in the disease group and the indicative score calculated as the average of the 2 converted indices.
Results
Data were obtained from 9665 individuals. Edit procedures described above resulted in the removal of 17% of the total: 9.3% as a result of inconsistencies on individual repeated questions, 4.8% because of multiple inconsistencies, and 2.9% because of the minimum time requirement. Numbers removed by edit criteria are given in country-specific reports available on the AQoL website. 47 The remaining 7933 respondents are classified by age, gender, education, and disease area in Supplementary Table S1. Patient numbers varied from 772 for cancer to 943 for heart disease. The total sample contained a similar number of respondents by country, varying from 1177 from Norway to 1460 from the United States. The use of quotas led to a demographic profile for the healthy public, which closely resembled the public in each country.
Summary statistics for the full survey population are reported in Supplementary Table S2. Mean utilities predicted by the MAUI for the public and total samples vary by 27% and 33%, respectively. For the total sample, the standard deviation varies by a factor of 2.08. The range of scores varies by a factor of 2.16, with minimum utilities varying from 0.3 for the SF-6D to −0.51 for the EQ-5D-5L. The EQ-5D-5L, AQoL-8D, and SF-6D assign the maximum utility of 1.00 to 19.1%, 0.35%, and 1.3% of the total respondents, respectively; 0.3%, 1.3%, and 14.7% of utilities predicted by the 15D, SF-6D, and AQoL-8D fall below 0.4.
Differences are summarized in Figure 1. This was constructed by ranking the utilities predicted by each MAUI from highest to lowest and dividing them into 100 percentile groups. The figure plots the average utility in each percentile on the vertical axis by its rank order on the horizontal axis. The 15D compresses utilities. SF-6D, and to a greater extent Quality of Well-Being (QWB), utilities initially decline very quickly but, subsequently, the curves flatten and utilities become greater than other utilities, with the exception of the 15D.
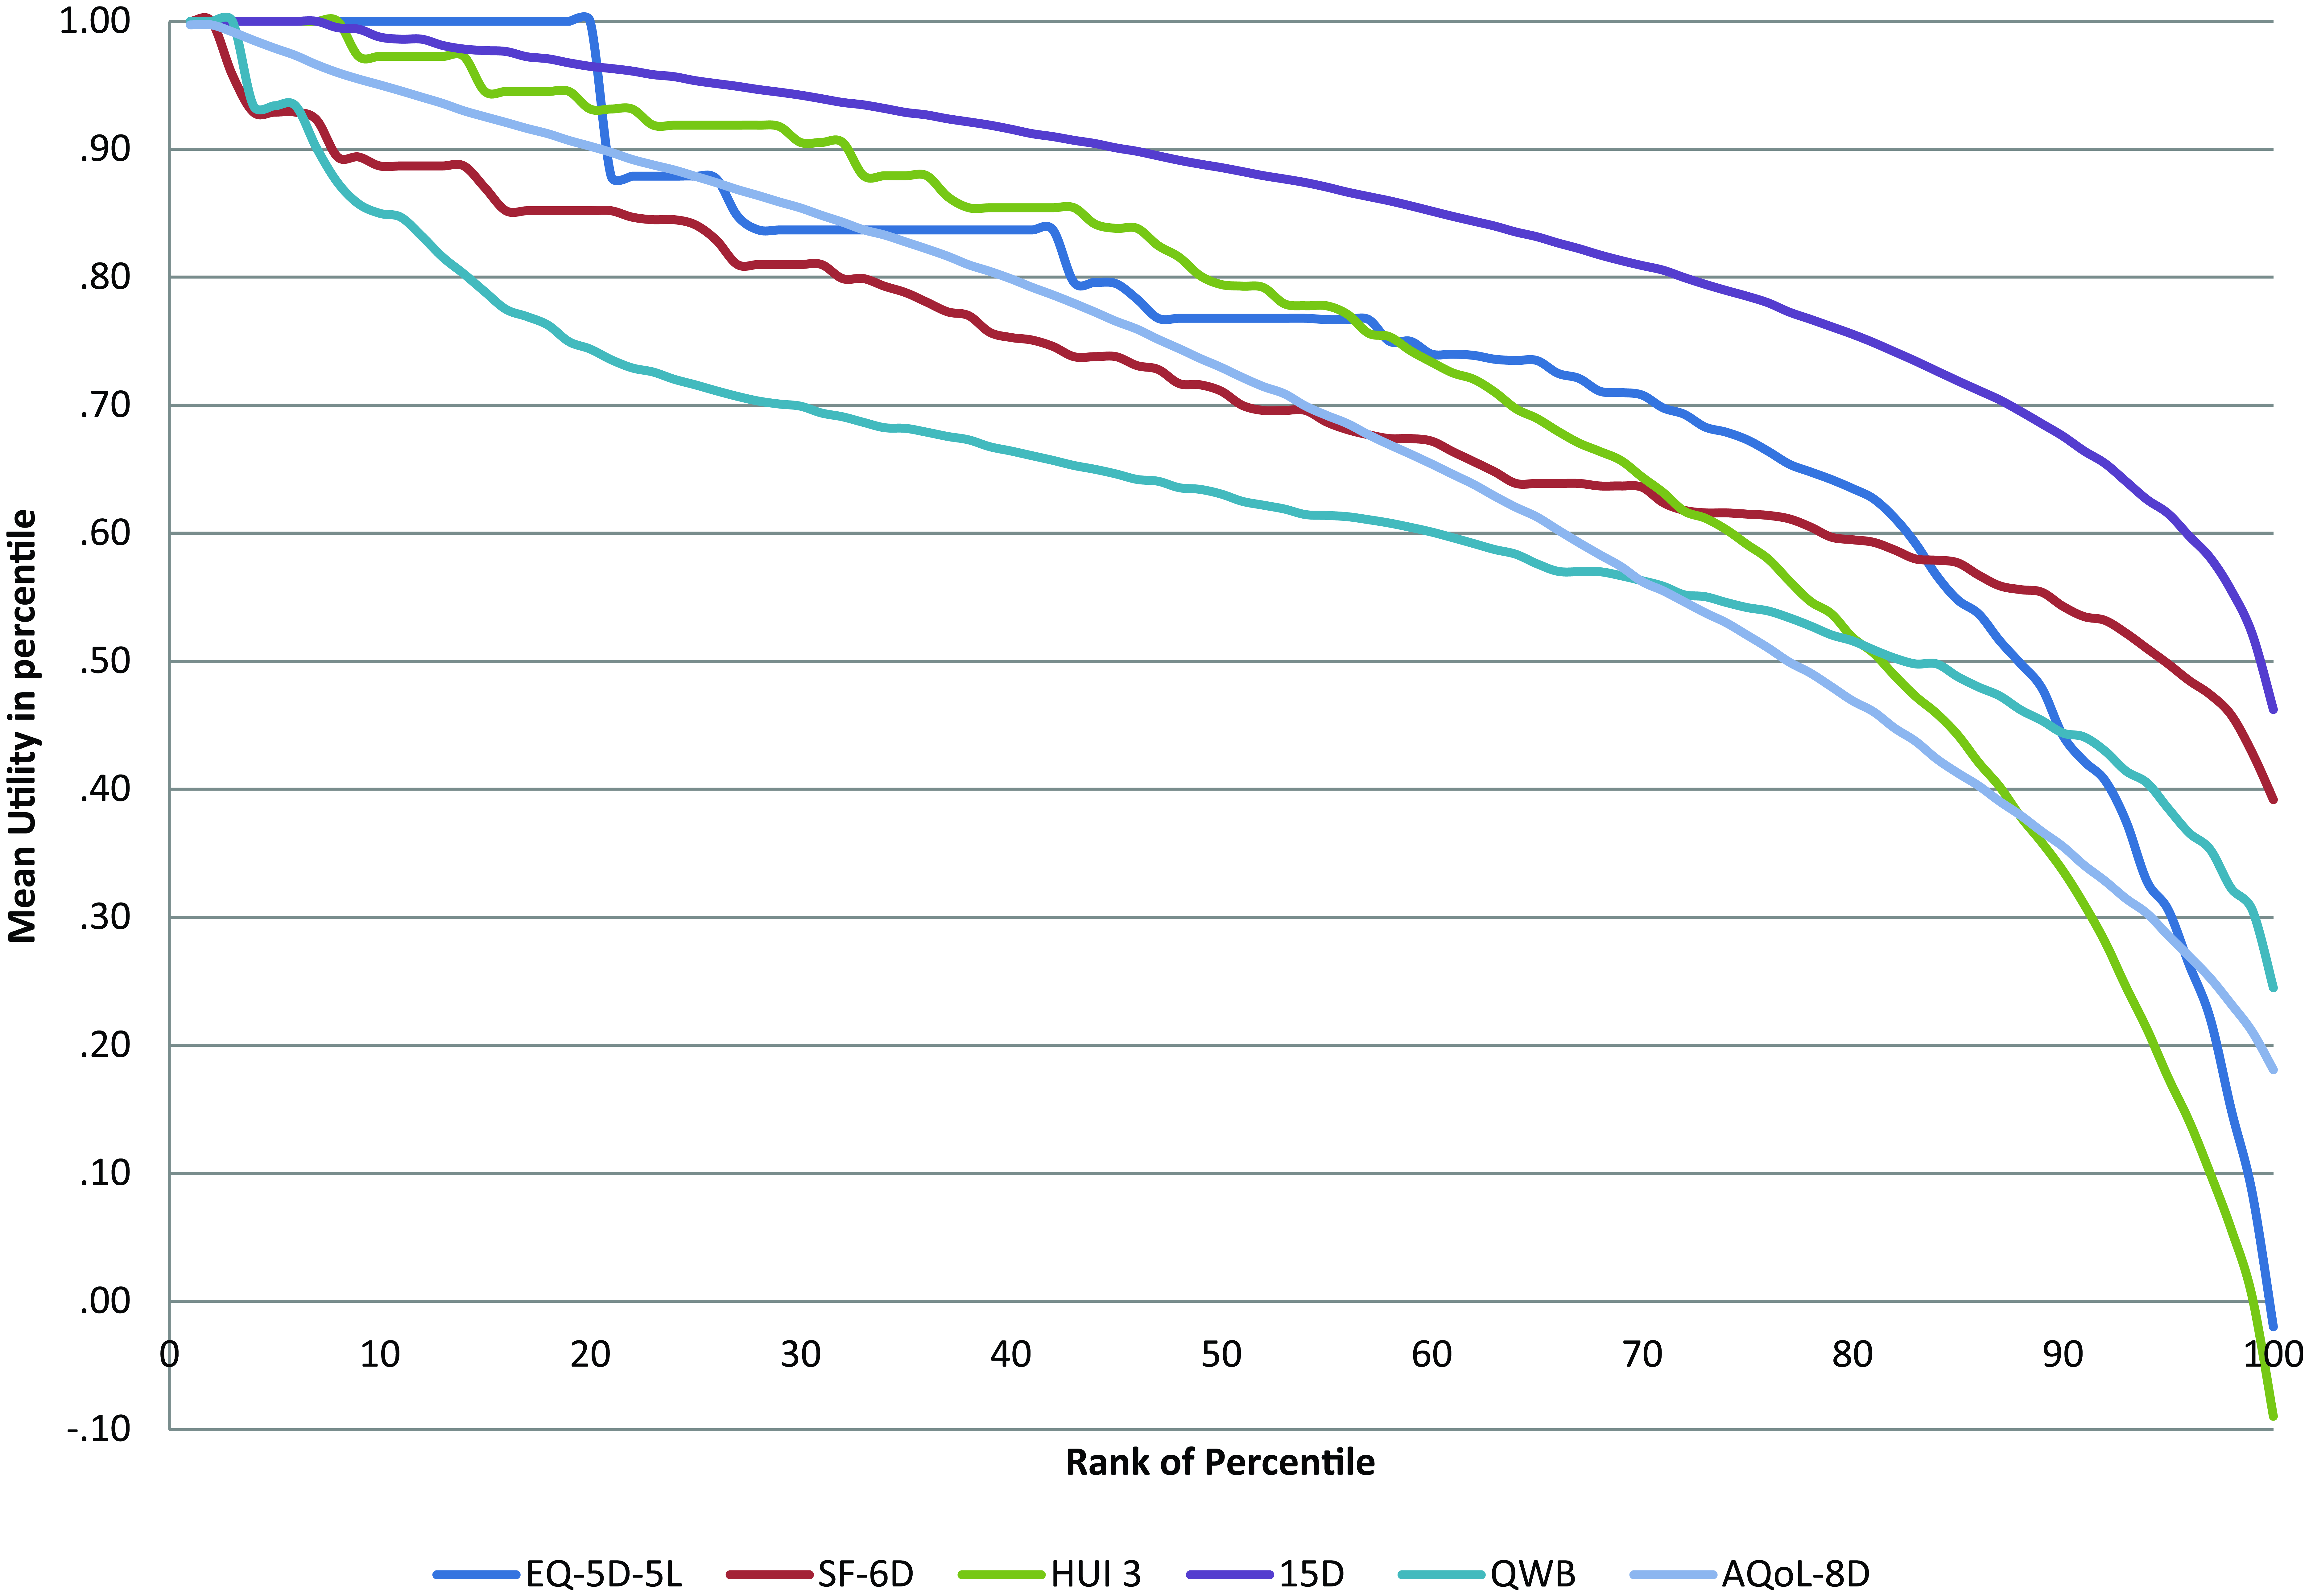
Mean multiattribute utility by ranked percentile. Source: Richardson and others. 46
Instrument Sensitivity
Table 2 reports unadjusted differences between mean public and patient utilities. These vary from an average difference of 0.27 for depression to 0.10 for hearing loss. Differences vary significantly when they are measured by different MAUIs. From the final column, the difference varies by a factor of 3.62 for hearing loss and by a factor of 2.11 for all patients; that is, the estimated effect of curing a disease varies, on average, by more than 100% depending on the choice of instrument.
Difference between Public and Patient Mean Utilities by Disease and Multiattribute Utility Instrument
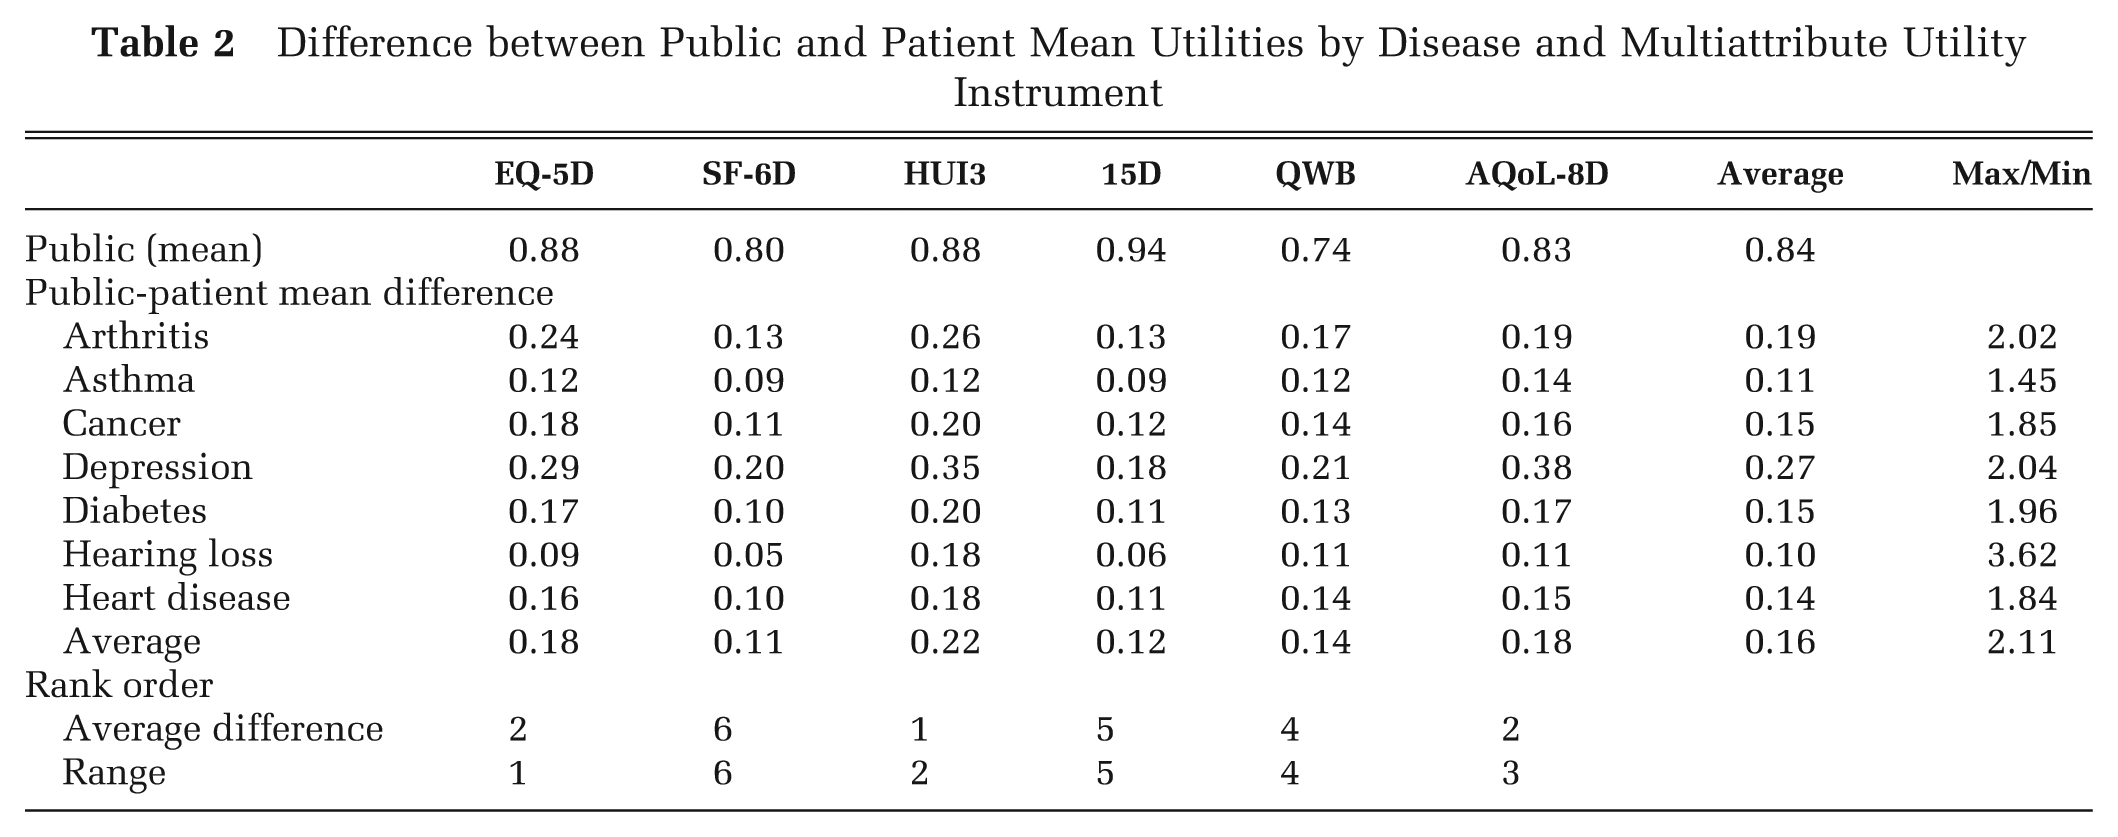
The bottom 2 rows of Table 2 indicate that, as a measure of sensitivity, the unadjusted difference in utility between patients and the public is likely to be confounded and possibly dominated by differences in the measurement scale of the MAUI. The rank order of the average difference in utilities (HUI 3 first; SF-6D last) is almost identical to the rank order of the range of observations. Consistent with this, independent analysis of the same data found, on average, that 30.3% of the difference between instrument utilities could be explained by linear scale effects. 25 The alternative measures of sensitivity—the Cohen effect size and the correlation with the DSI—take account of linear differences in the scale.
The 3 measures of sensitivity are reported and compared in Figure 2a–h. For each disease area, the 6 MAUI are rank ordered in the 3 columns by the score from the 3 measures of sensitivity, which is reported in brackets below the MAUI name. The location of the MAUI name in each column visually indicates the relative numerical value of the measure on a 100-point scale. Thus, in Figure 2h, the difference in mean public and patient utilities for all disease areas varies from 0.22 for HUI 3 to 0.11 for SF-6D. Therefore, these 2 instruments are located on the standardized scale at 100 and 0.0, respectively. From column 2, the average effect size varies from 1.93 for the 15D to 1.02 for SF-6D, and these 2 instruments are located at 100 and 0.0 on the scale, respectively. In the final column, the Pearson correlation between the DSI and MAUI varies from 0.56 for AQoL-8D to 0.37 for the QWB, and these instruments are located on the scale at the 100 and 0.0, respectively. These average results indicate a difference of 100%, 89.2%, and 51% between the maximum and minimum scores for the 3 measures. The rank order of the scores varies substantially, and the order varies by disease area.
Three measures of sensitivity: each figure ranks the multiattribute utility instruments (MAUIs) by (1) differences between mean utilities of the patient and public group; (2) by the effect size calculated using the standard deviation of the public; and (3) the Pearson correlation between the MAUI and the disease-specific, quality-of-life instrument (DSI). Numbers in brackets are the absolute differences (column 1), effect sizes (column 2) and correlation coefficients (column 3).
Construct Validity
The correlation between criteria instrument scores is reported in Supplementary Table S3. The comparatively high correlation between the MCS, ONS, and ICECAP contrasts with their low correlation with the PCS and indicates that the 3 instruments are more closely related to psychosocial than to physical attributes. Consequently, in the summary Table 3, the correlations between MAUI and these 3 variables were averaged to obtain a single index of psychosocial content. Only a single index of physical health–related QoL was available, namely, the PCS of the SF-36, and it was employed as the index of physical content. Correlations between the 2 preference instruments, the VAS and Self TTO, were also averaged to obtain a single index.
Bolded numbers indicate the instrument ranked first in the category. Underlining indicates an instrument ranked fifth or sixth in the category.
Correlations between MAUI and each criterion variable are reported as supplementary material.
Correlation between MAUI and PCS.
Correlation between MAUI and average of MCS, ICECAP, and ONS after rescaling to a 0 to 1 scale.
Correlation between MAUI and average of the VAS and Self TTO after rescaling to a 0 to 1 scale.
A relatively clear pattern emerges in Table 3. The 15D has the highest and the AQoL-8D the lowest average correlation with the PCS. However, with the exception of AQoL-8D and QWB, the average correlation across all disease areas is similar, differing by only 0.07. AQoL-8D has the highest average correlation with psychosocial variables and QWB the lowest, followed by EQ-5D-5L. Differences are large, with the average correlation varying from 0.48 (EQ-5D-5L) to 0.72 (AQoL-8D). AQoL-8D also has the largest average correlation with the preferences index across all disease areas (0.51), with QWB and EQ-5D-5L again having the lowest score (0.38 and 0.43, respectively). The correlations between the MAUI utilities and scores from individual criterion variables are reported in Appendix D for each disease area.
Indicative Summary Scores
The indices for instrument sensitivity, construct validity, and the indicative summary scores are reported in Table 4. While results vary by disease, several patterns emerge. In the majority of disease areas, the 15D obtains the highest overall composite score (Table 4c) followed in each case by the AQoL-8D or HUI3. Exceptions to this pattern are hearing loss and depression, for which the HUI3 and AQoL-8D have the highest average scores, respectively. In contrast, the QWB consistently achieves the lowest scores on every criterion for every disease except hearing loss. The EQ-5D obtains the second lowest score for 5 of the 7 diseases.
Indices of Sensitivity, Validity, and Indicative Summary Score
Averages were calculated by first dividing the component indices for each MAUI by the maximum component index. The indices of sensitivity and validity were then obtained.
Bold indicates highest score.
Lowest score excluding QWB. Index numbers are subscripts presented in parentheses.
For reasons outlined below, the effect size and therefore the indicative summary scores of the 15D and SF-6D are inflated and deflated, respectively, by nonlinear scale effects. Omitting the effect size from the indices (Table 4d) improves the ranking of the SF-6D for every disease category and reduces the ranking of the 15D in 5 and the HUI3 in 4 of the 7 disease categories. The ranking of the remaining instruments remains relatively stable.
Discussion
In CUA, the comparison of services is based on the assumption that the QALYs they produce, and therefore the utilities used to calculate the QALYs, have the same cardinal property: an increment of utility produced by service A has the same importance as the same increment produced by service B. This assumption may be violated by the use of different MAUI, which have different scale properties and differing sensitivities to health states. For example, from Table 2, the substitution of the SF-6D for the HUI3 would halve the number of QALYs apparently gained from returning the “average” arthritis patient to the average health state of the public and the priority of arthritis services would fall.
Inconsistency may be avoided by the use of a single MAUI. However, this solution is problematic because of variation in the content of instruments and therefore differing sensitivities to different health states. From Table 2, the “cure” of depression (i.e., a return from patient to public average utility), as measured by the EQ-5D, HUI3, SF-6D, and AQoL-8D, would generate 21%, 35%, 54%, and 100% more QALYs than the cure of arthritis. This implies that the result of CUA and the funding of services may depend on the choice of the MAUI.
The first objective of the present article was to compare alternative methods for measuring instrument sensitivity and construct validity. Results indicate that common approaches to measuring sensitivity do not yield similar results. In 5 of the 7 disease areas, the mean difference between public and patient utilities is greatest when it is measured by the HUI3. Using the 15D, the difference is smallest or next to smallest in every disease area. In contrast, the effect size using the 15D is largest in every case, except for hearing loss, while the HUI3 retains the second highest average rank order. However, using the correlation with a DSI as the criterion, the average rank order of HUI3 falls to fourth and AQoL-8D replaces 15D as having the highest average ranking. SF-6D, which has the lowest average ranking using both mean differences and the effect size as the criterion rises to have the third highest average ranking.
A limitation with these observations is that they document the problem of obtaining an unambiguous ranking of instrument sensitivities, but they do not fully identify the reason for the differences. The change in apparent sensitivity that occurs when it is measured by the effect size rather than by differences in mean utilities is attributable to differences in the standard deviations and the scales employed in the assignment of utilities. As shown in Figure 1, ceiling effects differ. Using the EQ-5D-5L, 41% of the healthy public assigned a utility of 1.00 to their health state. In contrast, the SF-6D and AQoL-8D assigned a utility of 1.00 to 4.2% and 4.9% of the healthy public, respectively. 46 Frequency distributions in Figure 1 also vary with the severity of the health state. Near full health, there is a high compression of 15D utilities resulting in a low standard deviation and large effect size. The converse is true for the SF-6D. The present results do not indicate whether these differences are a result of health state descriptions, the assignment of utilities to items, or the reliability of the items, an investigation that would require a separate analysis using a technique such as item response theory. In sum, interpretation and comparison of the effect sizes is problematic, and as shown in Table 4c and 4d, its inclusion or exclusion significantly alters the indicative ranking of instruments.
As DSI are dedicated to particular diseases, they might be seen as a gold standard for measuring sensitivity. However, their use is also subject to a number of caveats. First, DSI are typically administered only to patients in a disease category (as occurred in the present MIC survey). Consequently, their correlation with a MAUI indicates sensitivity within the disease area and not between average patient and full health. With the varying frequency distributions of utilities, these may differ. Second, there are a large number of DSI, and none can claim to be a gold standard for assessing utility. As in the MAUI literature, there is an unresolved question concerning the appropriate content of the instruments and the appropriate composition of the descriptive system. The MIC survey included instruments that, from the literature and from clinical advice, appeared most able to evaluate patient QoL. However, the choice of instrument is contestable.
The analysis of content and convergent validity further demonstrated the complexity of comparisons between MAUI. Evidence for construct validity varies with the criterion and disease area. As judged by the instruments in the MIC survey, the 15D scores most highly with respect to physical content and the AQoL-8D with respect to both psychosocial content and preference scores. Tests were necessarily limited to comparisons with a small number of criterion instruments, and alternative tests are possible. However, as noted, validation is an ongoing process of testing the properties and not a “one-shot” definitive test.
The second objective of the article was to determine whether, given the ambiguities in the test results, conclusions could be drawn with respect to the preferred instrument in each disease area. This raises the contentious issue of how to combine results from different tests. However, different weightings of the 3 broad sets of results are unlikely to significantly alter the ranking of the overall index in Table 4. Increasing the importance of physical content would favor the 15D; increasing the weighting on psychosocial or preference scores would favor AQoL-8D.
The final summary scores in Table 4 do not purport to identify the best instrument in all contexts: they summarize a limited number of criteria combined as described. In selecting the appropriate instrument for use in a study, other considerations may also be relevant. In particular, the cross-section MIC survey does not allow the estimation of test-retest reliability scores for instruments as, for example, in the 5-instrument comparison by Palta and others. 21 Research may also have a focus on a particular aspect of health due, for example, to the presence or absence of particular comorbidities in their patients’ population. This could lead to the preference for an instrument with a disproportionate focus on physical or psychosocial health or a property or content omitted from the present study.
Caveats also arise from the data used in the analysis. A web-based survey has less control over the quality of the data at the point of collection. However, the stringent edit procedures described earlier resulted in a data set with a high degree of internal consistency. The correlation between instruments was generally higher than found in other studies, which increases confidence in the integrity of the data. The respondents were nevertheless self-selected members of a survey panel. But the analysis in the present article did not require a fully representative sample of the general or patient populations as its purpose was the comparison of the properties of instruments. This required a comparison of results from the same—not representative—patients and members of the public.
A further caveat is that the same MAUI algorithms were used with all individuals irrespective of their country of origin. Ideally, utility weights should be derived from representatives with similar preferences (implying not simply a common nationality but similar socioeconomic and health-related characteristics). In practice, it is unlikely that the present results would be affected significantly by the use of a nationally derived algorithm. Analysis of MIC data has demonstrated that the differences between MAUI utilities in the study are overwhelmingly attributable to instrument content and scale effects. The residual role of the preferences of those sampled explains less than 4% of the variation in preferences. 25 Even if this figure were larger, there is no clear way in which differing preferences would explain the pattern of results reported here, which are more readily explained by the varying MAUI scale effects shown in Figure 1 and the dissimilar descriptive systems summarized in Table 1.
Conclusions
Irrespective of the ambiguities arising from differing tests, researchers using CUA must select an instrument for measuring utility. However, the choice is problematic as there is no simple gold standard for evaluating instruments. This article has attempted to demonstrate a number of these problems but to report results that may assist with the selection of an MAUI.
Results indicate that each of the measures of sensitivity considered here is subject to a bias that is difficult to quantify. Tests of both the content and convergent validity of the MAUI give differing results. The final choice of instrument therefore requires consideration of several sources of imperfect evidence. Despite these problems, some conclusions are well supported by the results. The optimal instrument varies with the disease area: HUI3 achieves the highest average scores in the context of hearing loss, the AQoL-8D in the context of psychosocial problems, and the 15D in the context of physical problems. Overall, the evidence is favorable to the more widespread use of the 15D and AQoL-8D and the more limited use of the EQ-5D-5L.
Footnotes
Acknowledgements
The authors would like to thank the reviewers for helpful suggestions.
This research was funded by the National Health and Medical Research Council (NHMRC) grant 1006334 and National Health and Medical Research Council grant 1006334.
References
Supplementary Material
Please find the following supplemental material available below.
For Open Access articles published under a Creative Commons License, all supplemental material carries the same license as the article it is associated with.
For non-Open Access articles published, all supplemental material carries a non-exclusive license, and permission requests for re-use of supplemental material or any part of supplemental material shall be sent directly to the copyright owner as specified in the copyright notice associated with the article.